. 2024 Jul 23;43(7):114434.
doi: 10.1016/j.celrep.2024.114434. Epub 2024 Jul 3.

CB2 stimulation of adipose resident ILC2s orchestrates immune balance and ameliorates type 2 diabetes mellitus

Affiliations

CB2 stimulation of adipose resident ILC2s orchestrates immune balance and ameliorates type 2 diabetes mellitus

Pedram Shafiei-Jahani et al. Cell Rep. .

Abstract

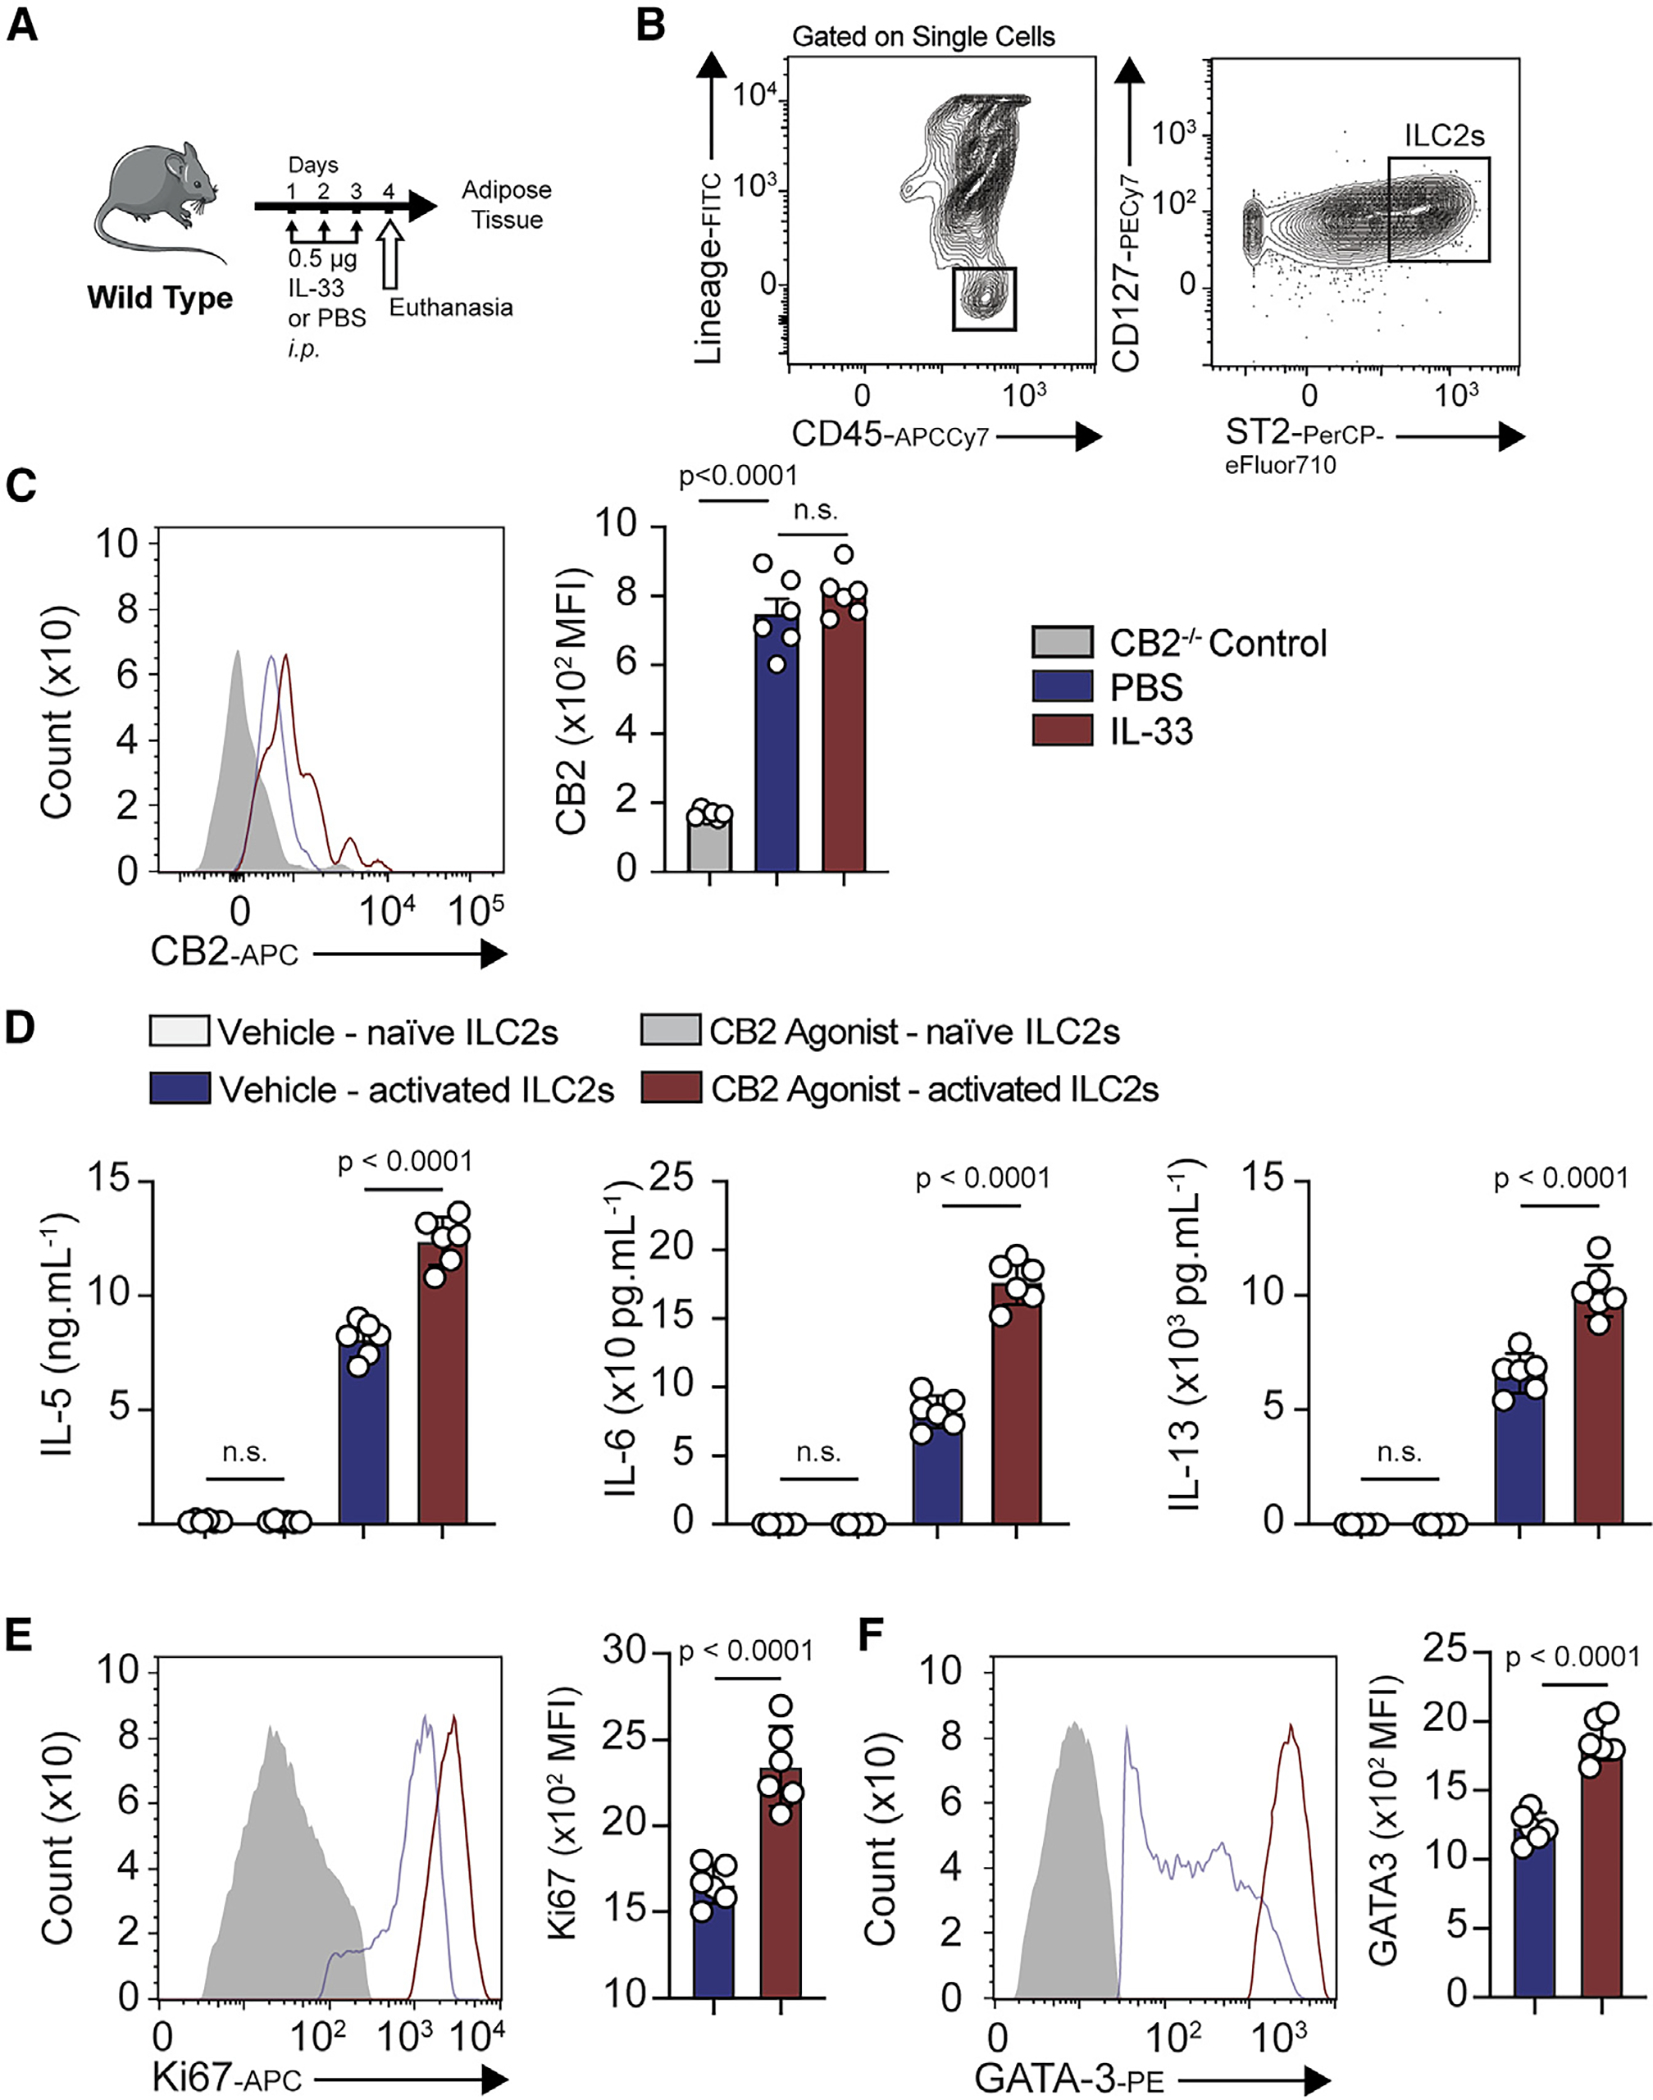
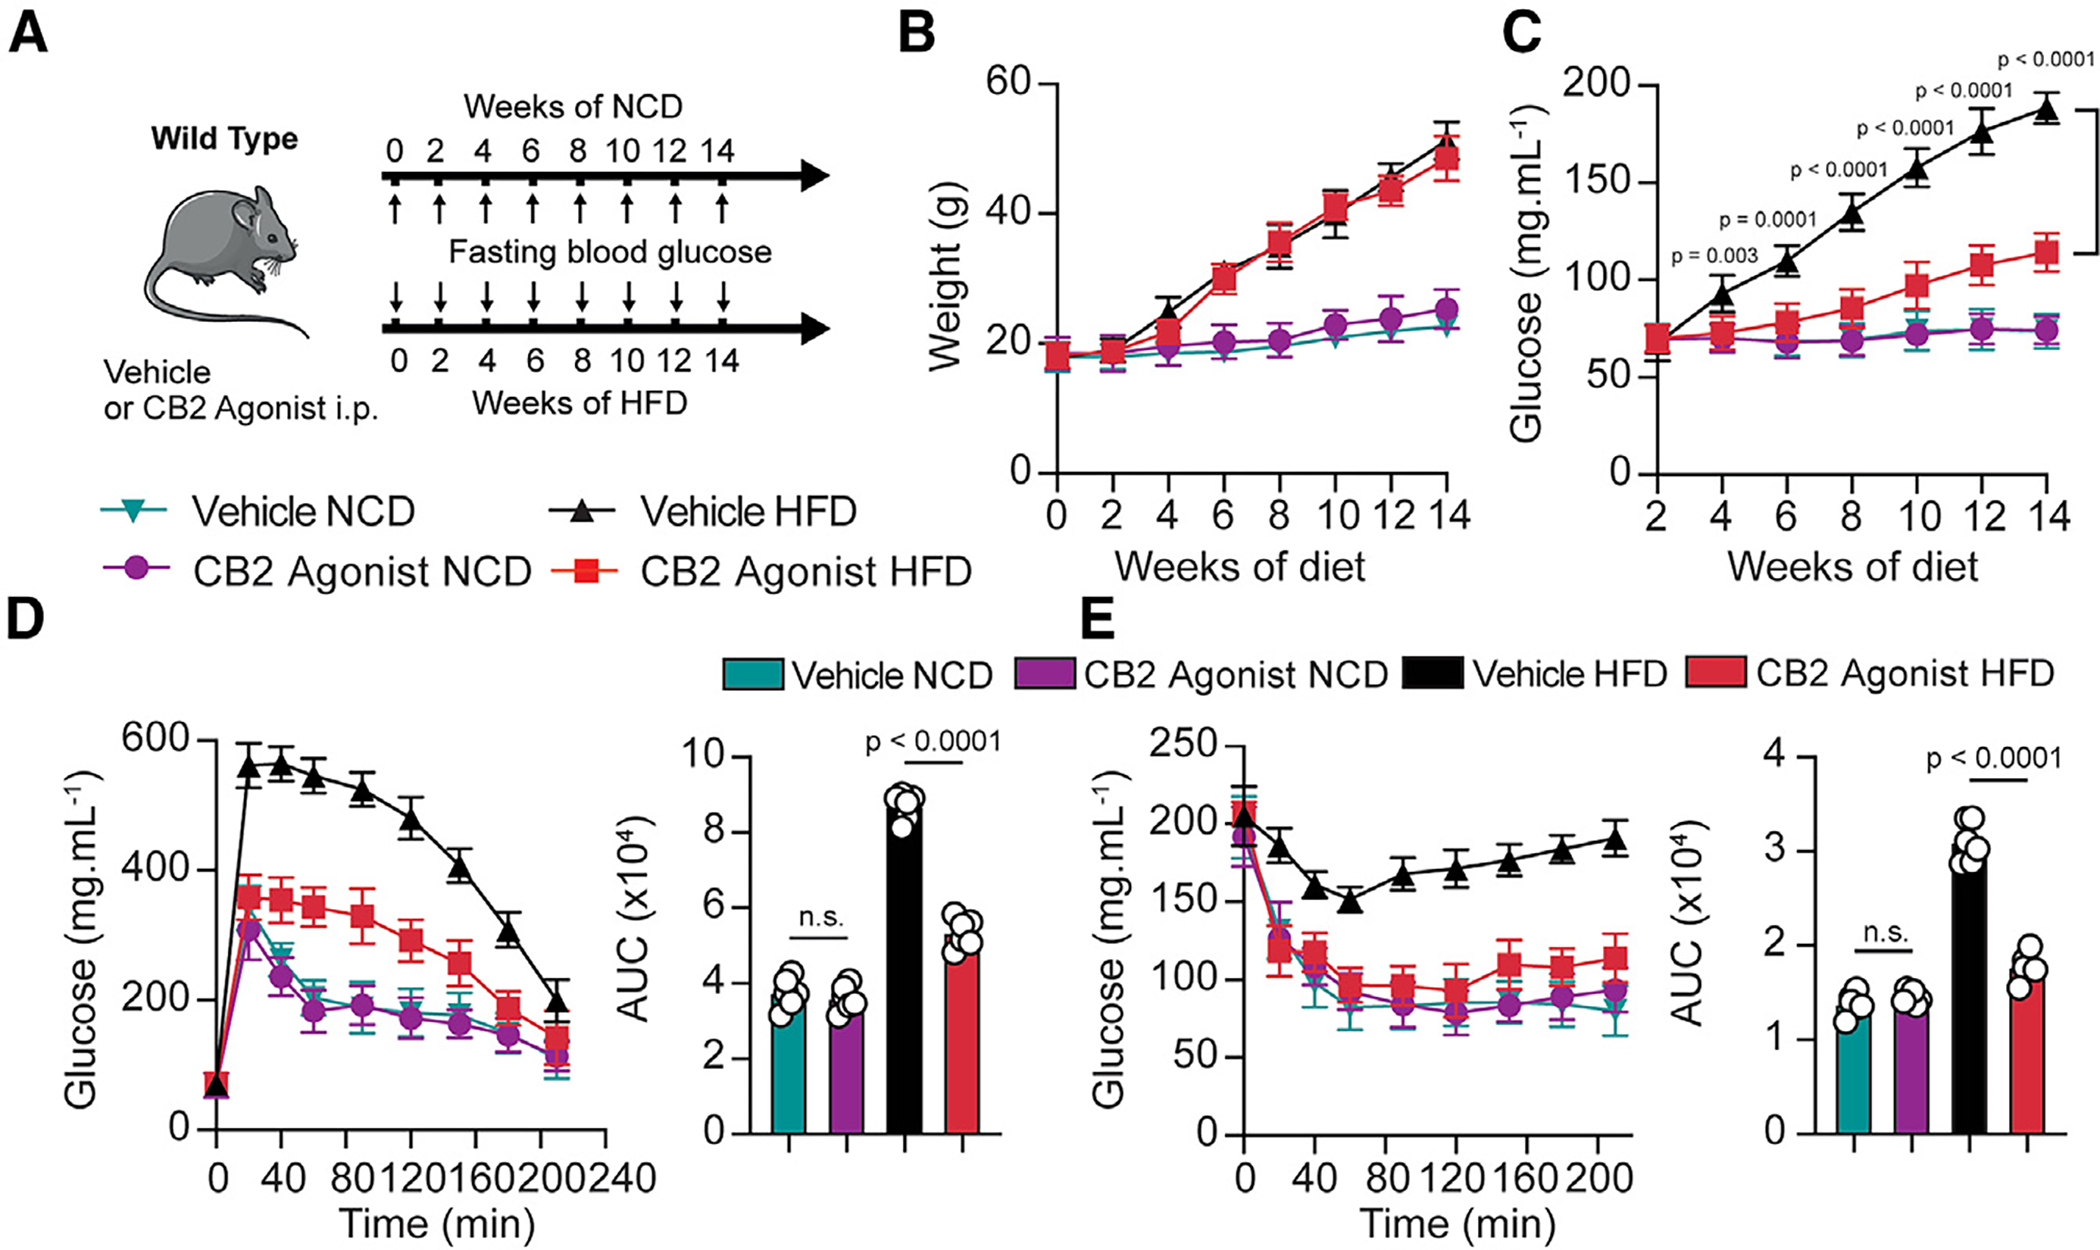
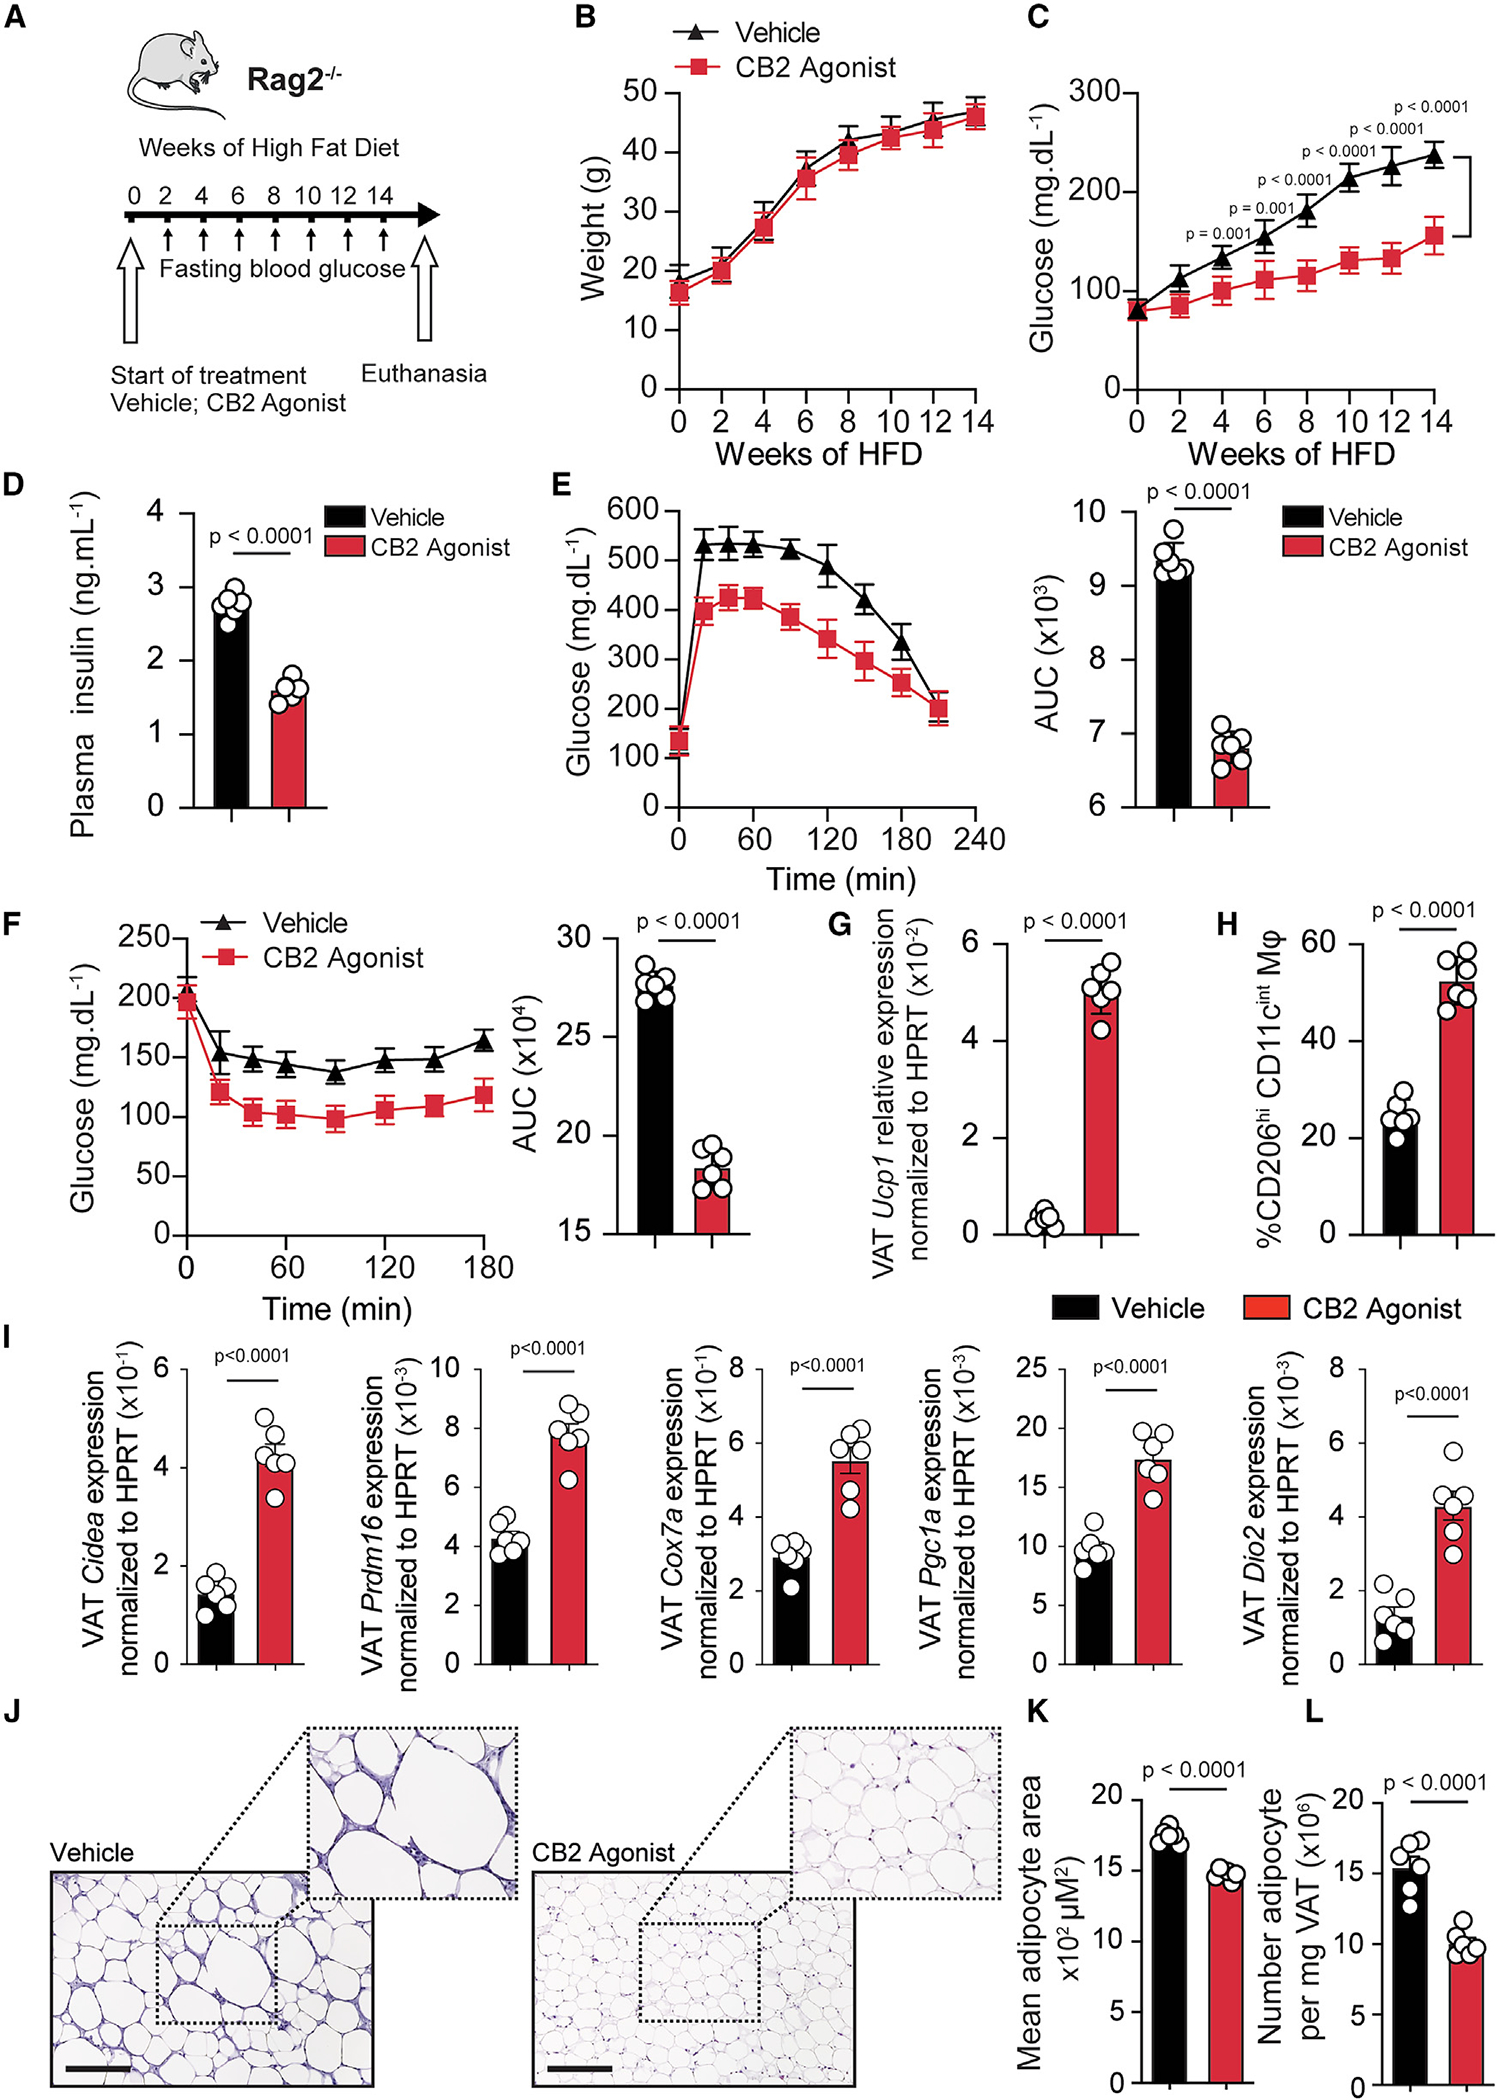
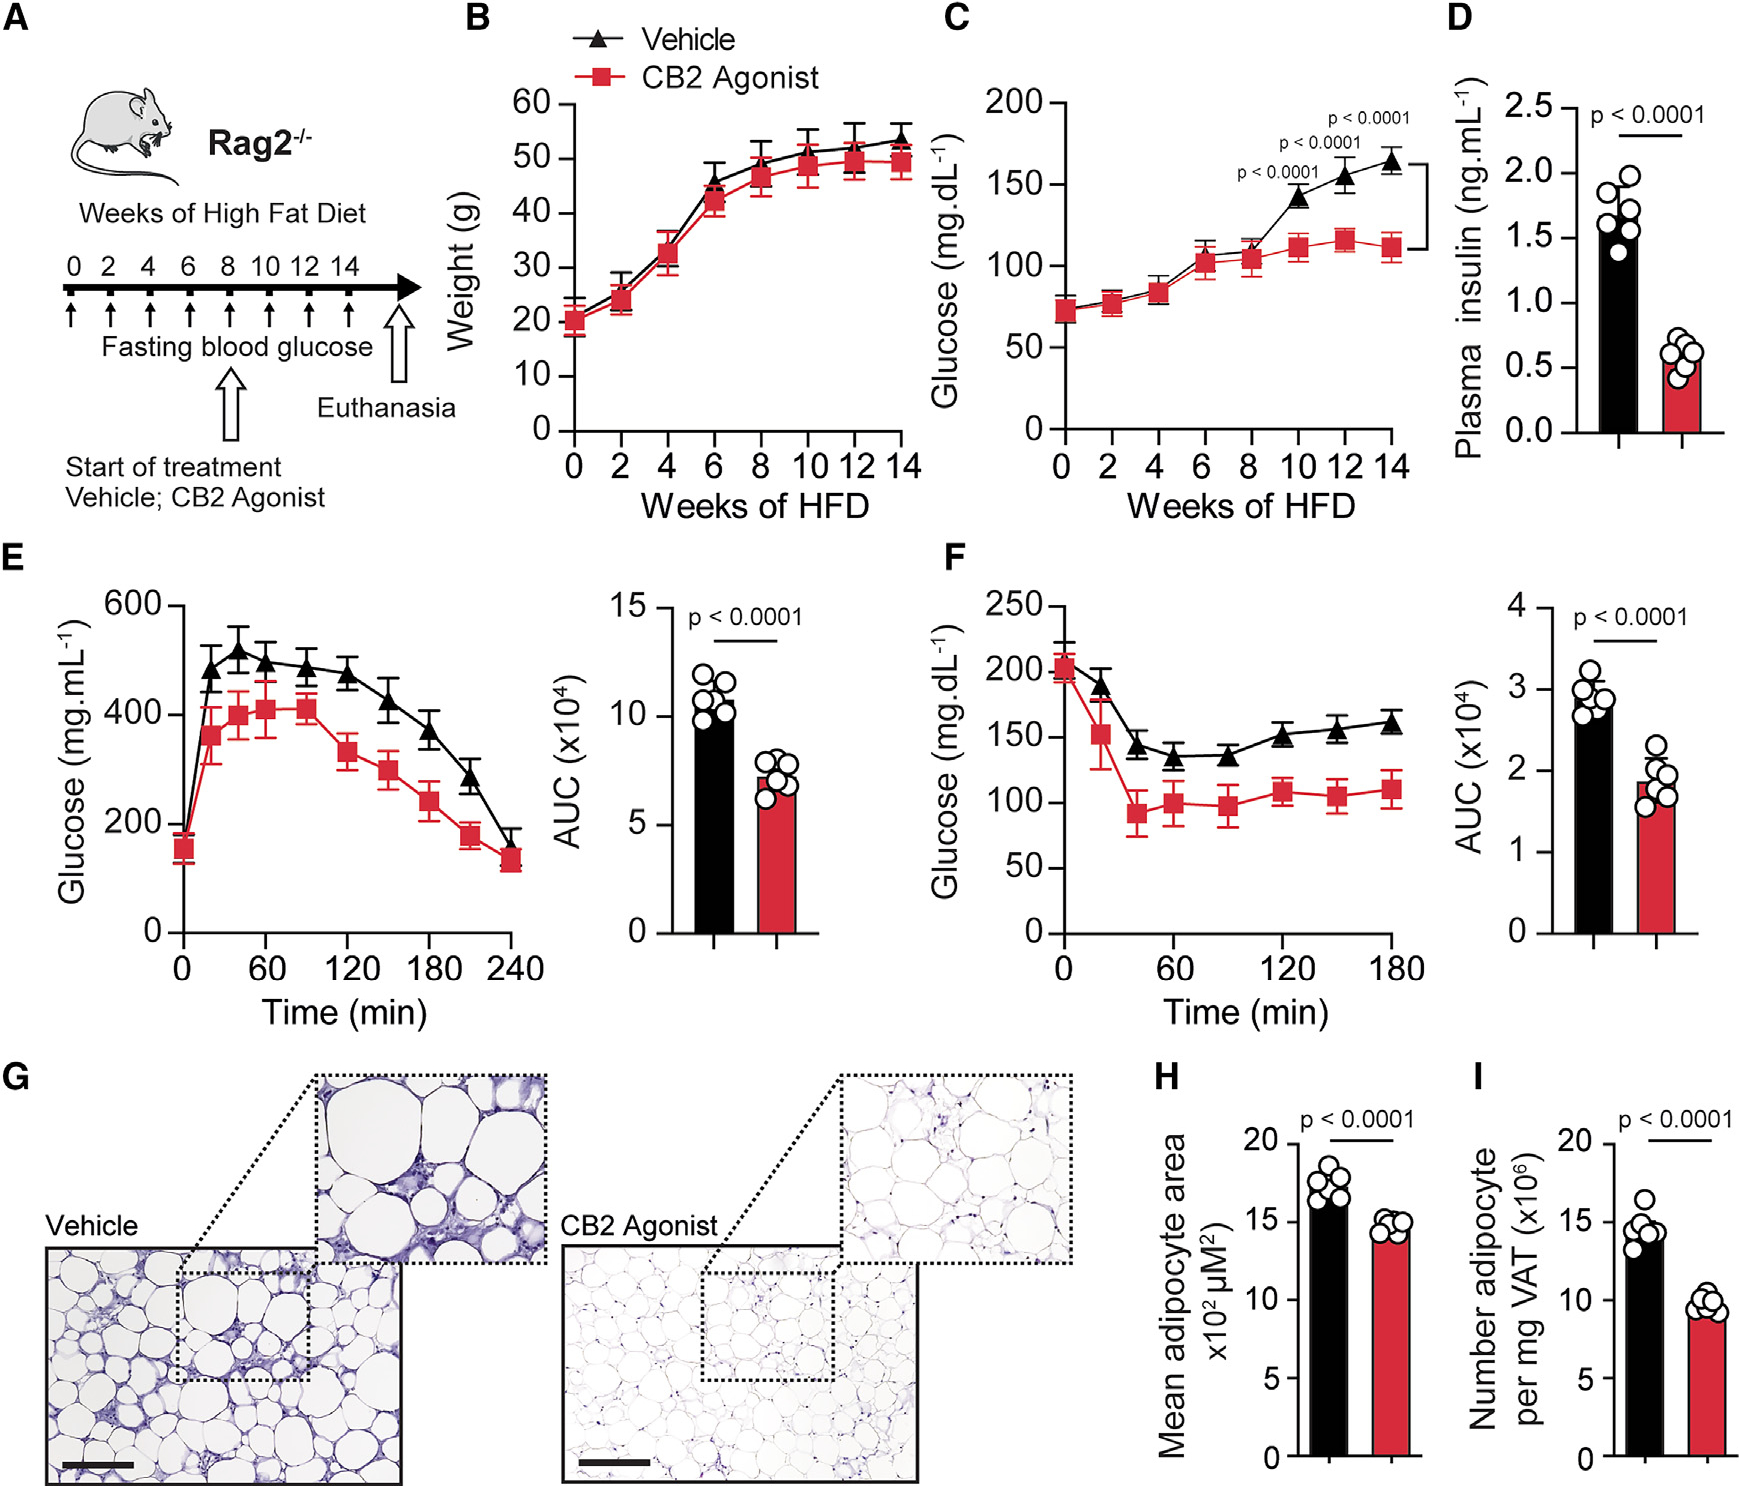
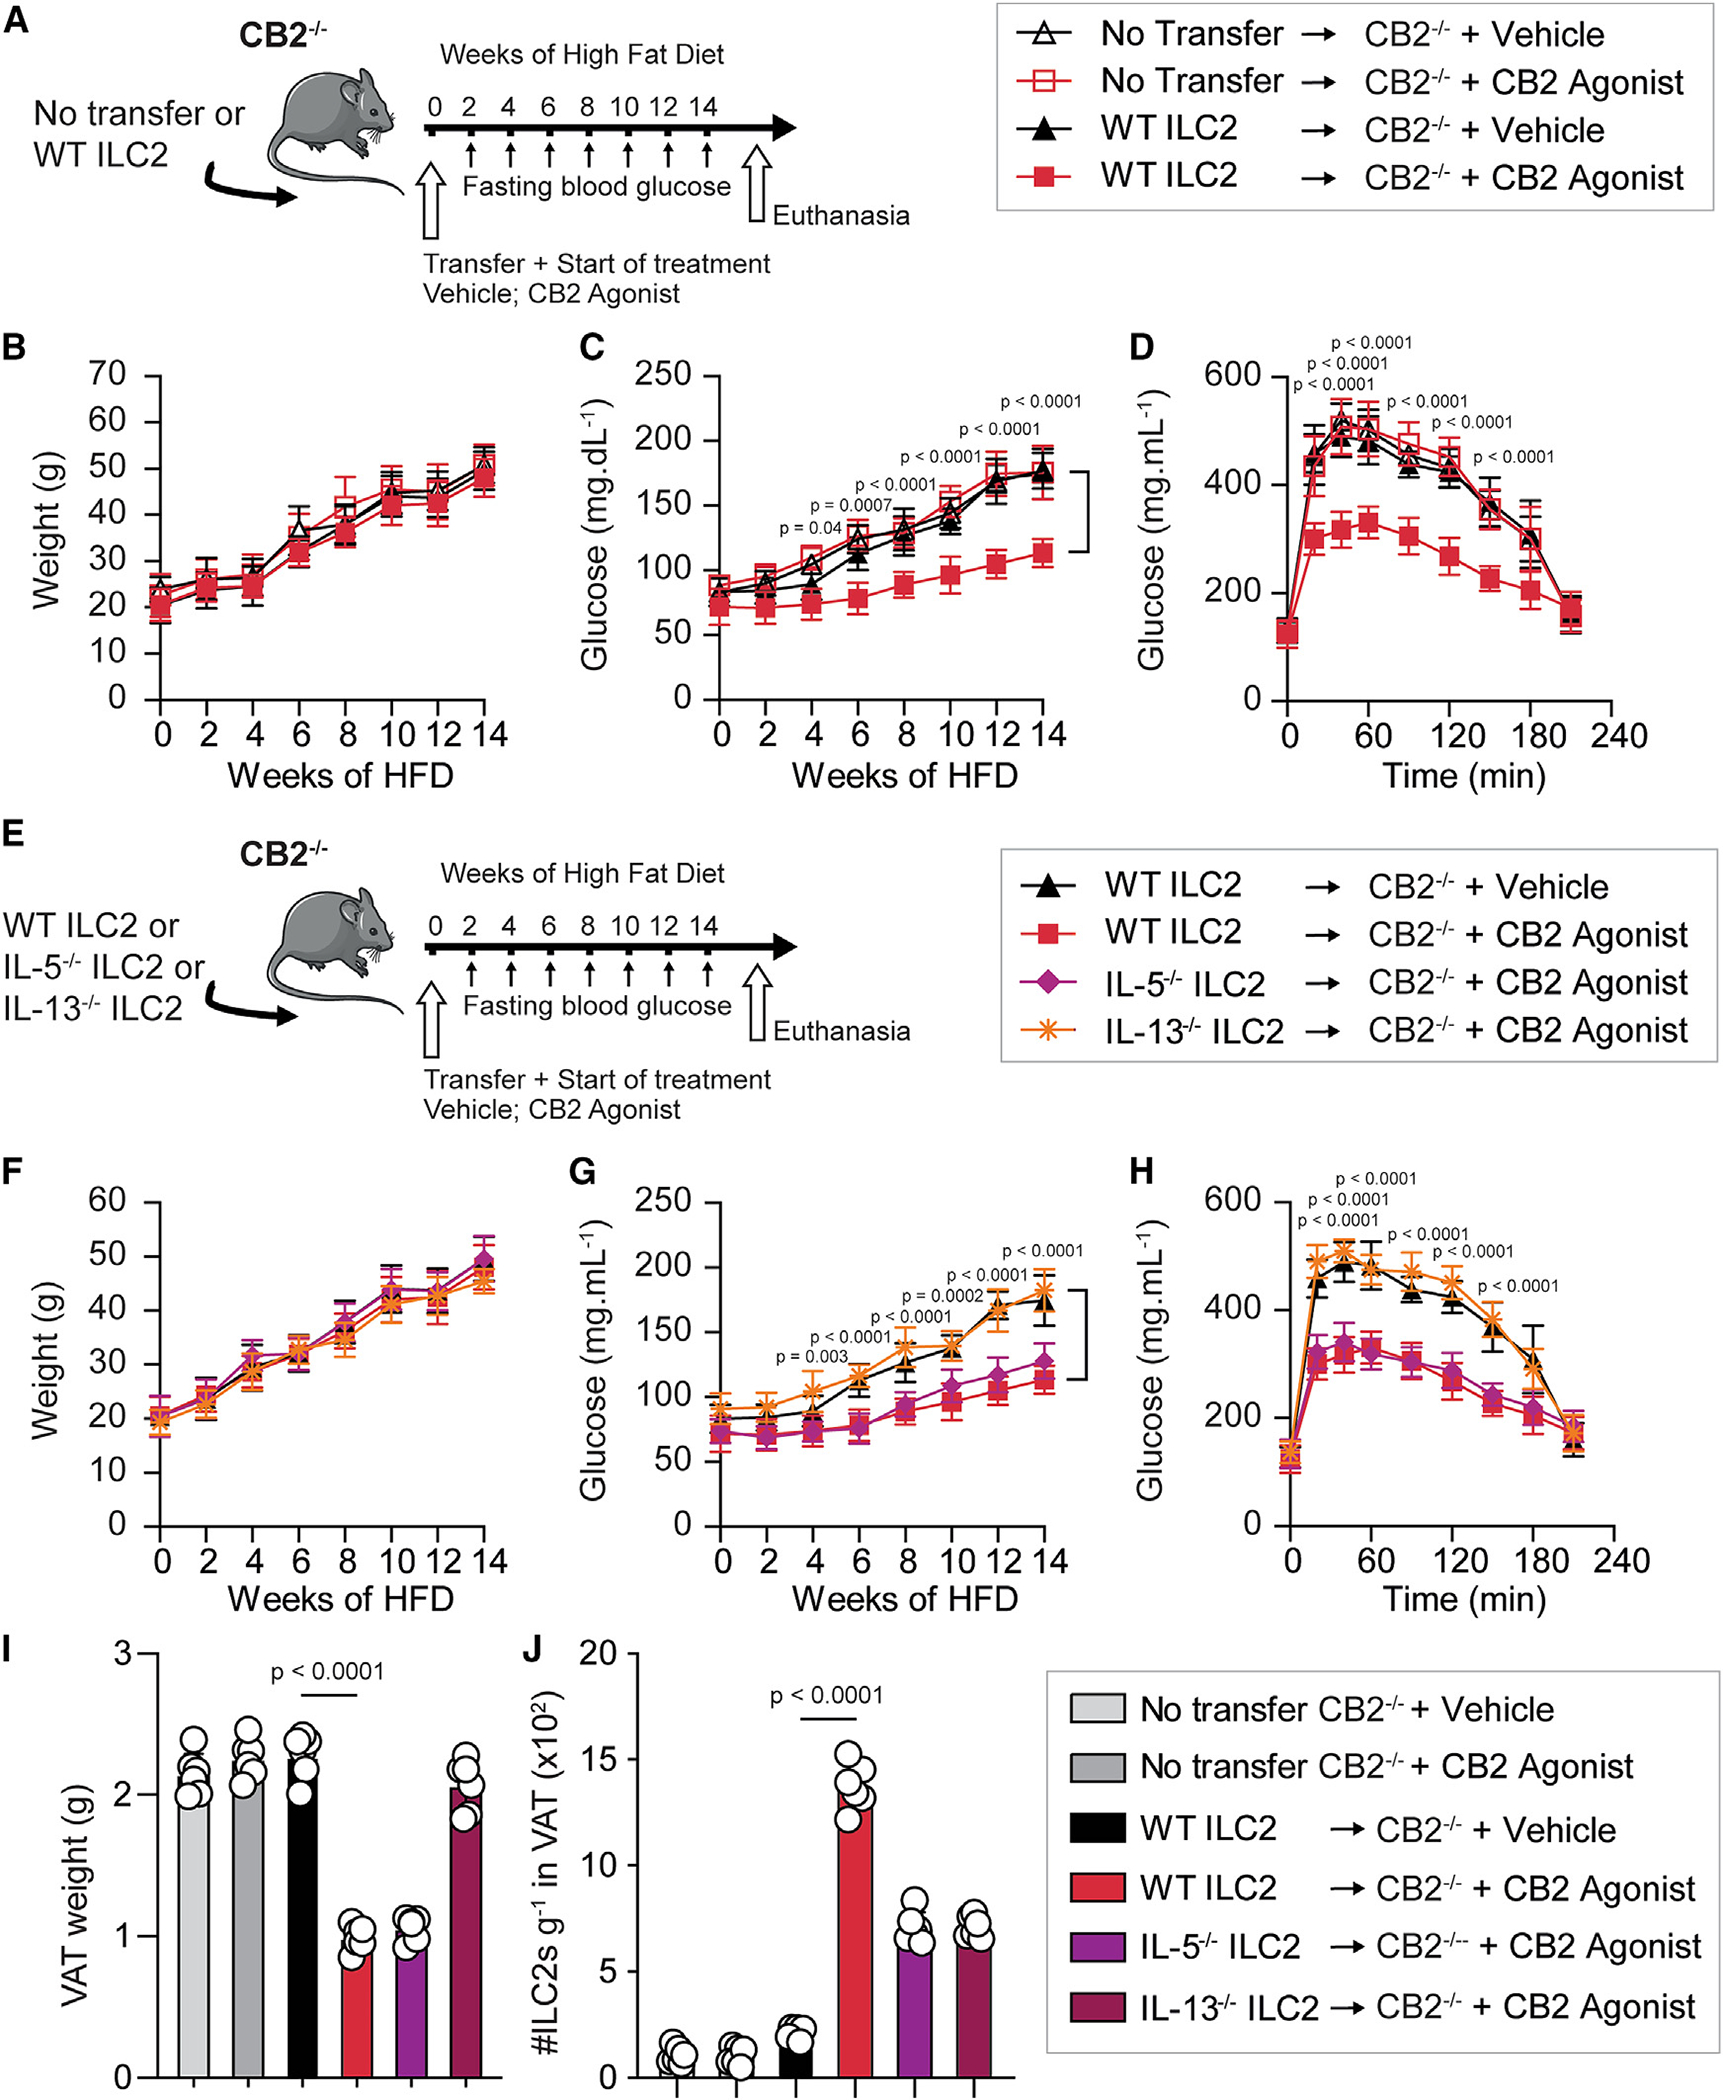
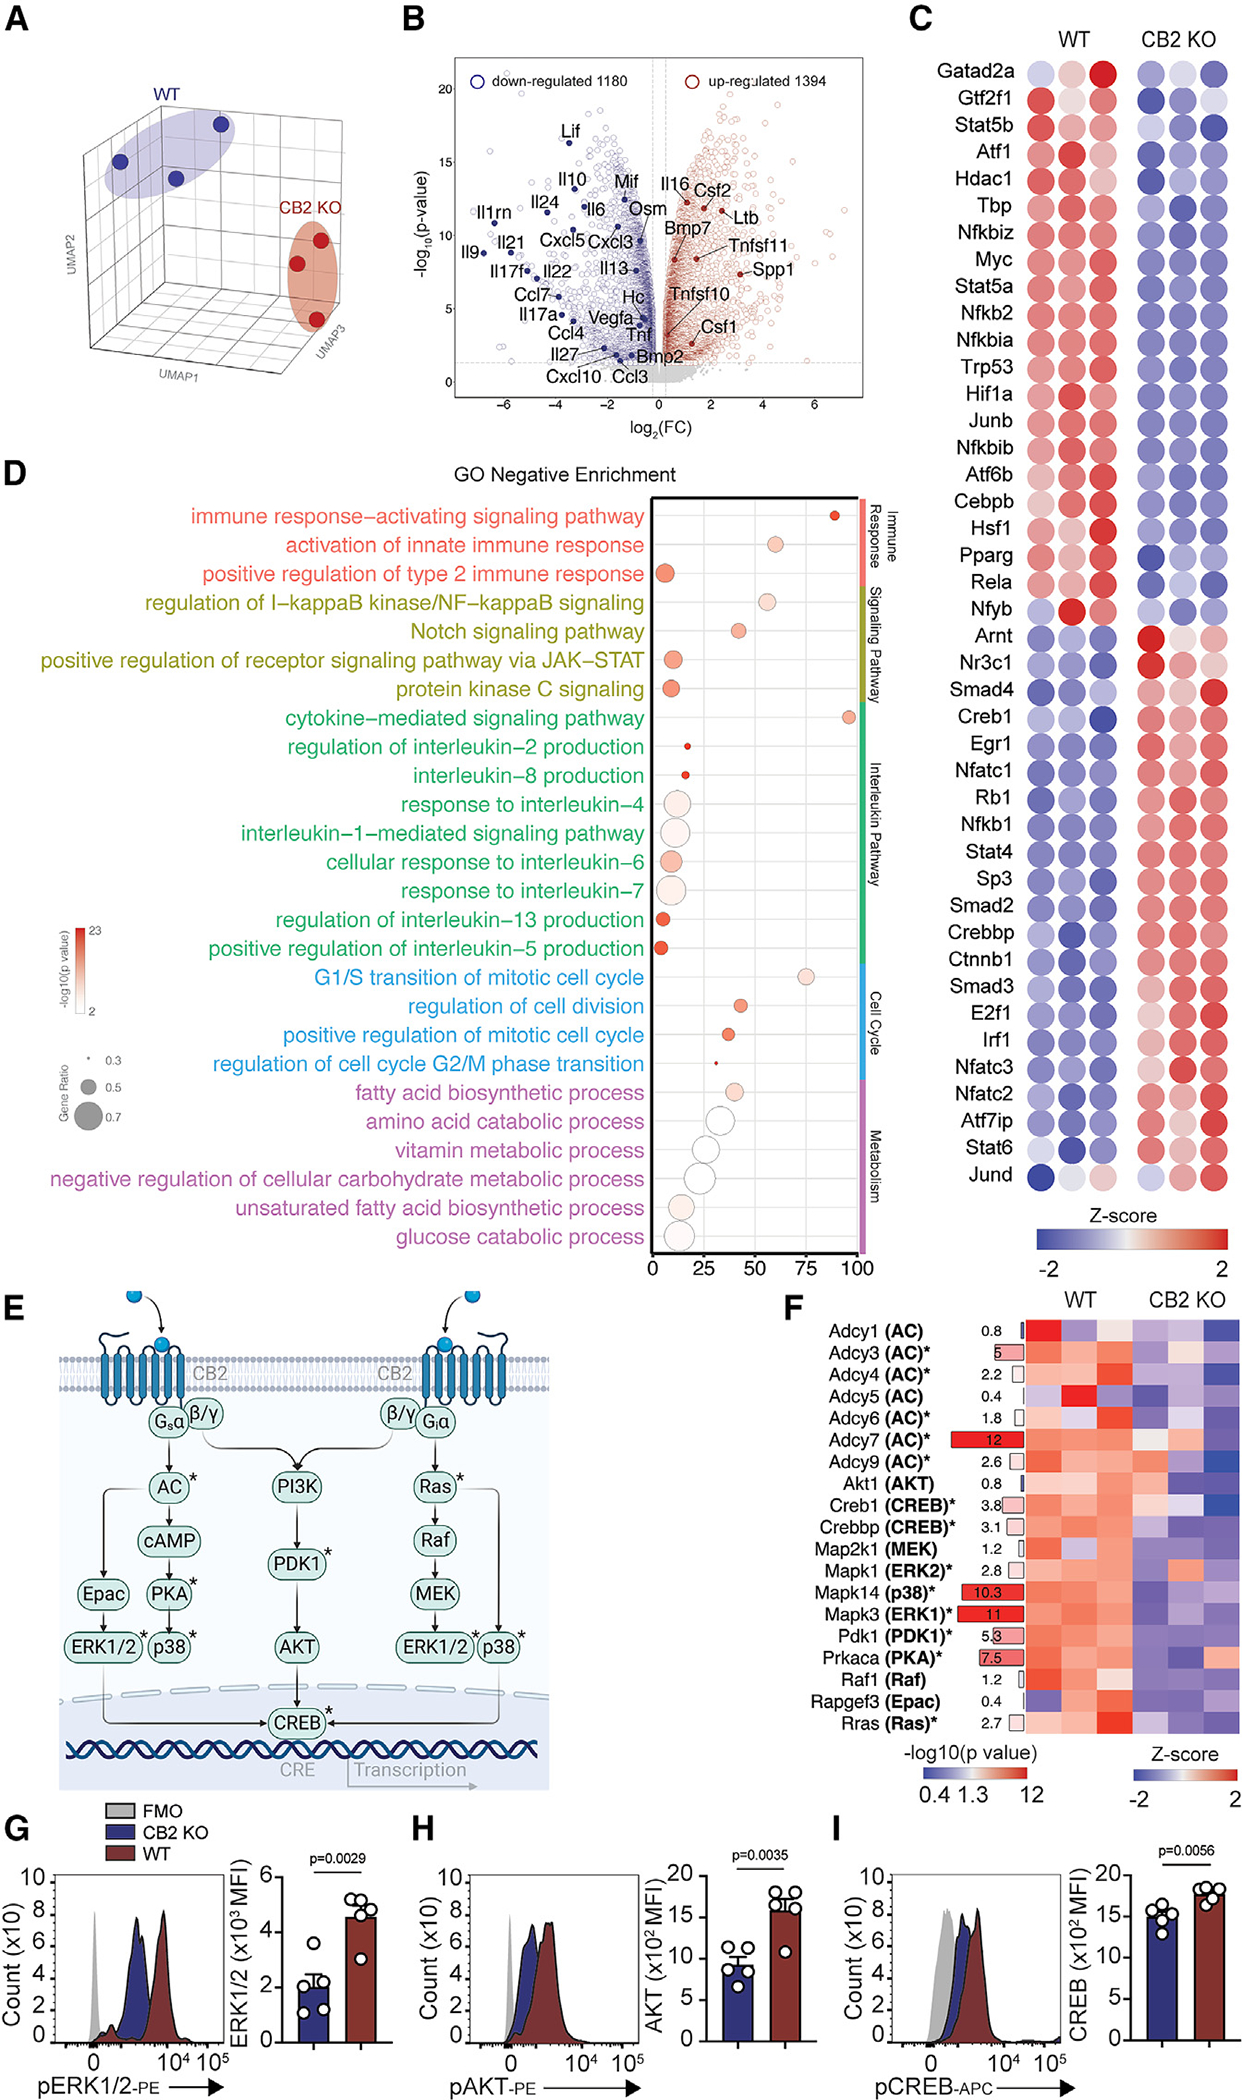
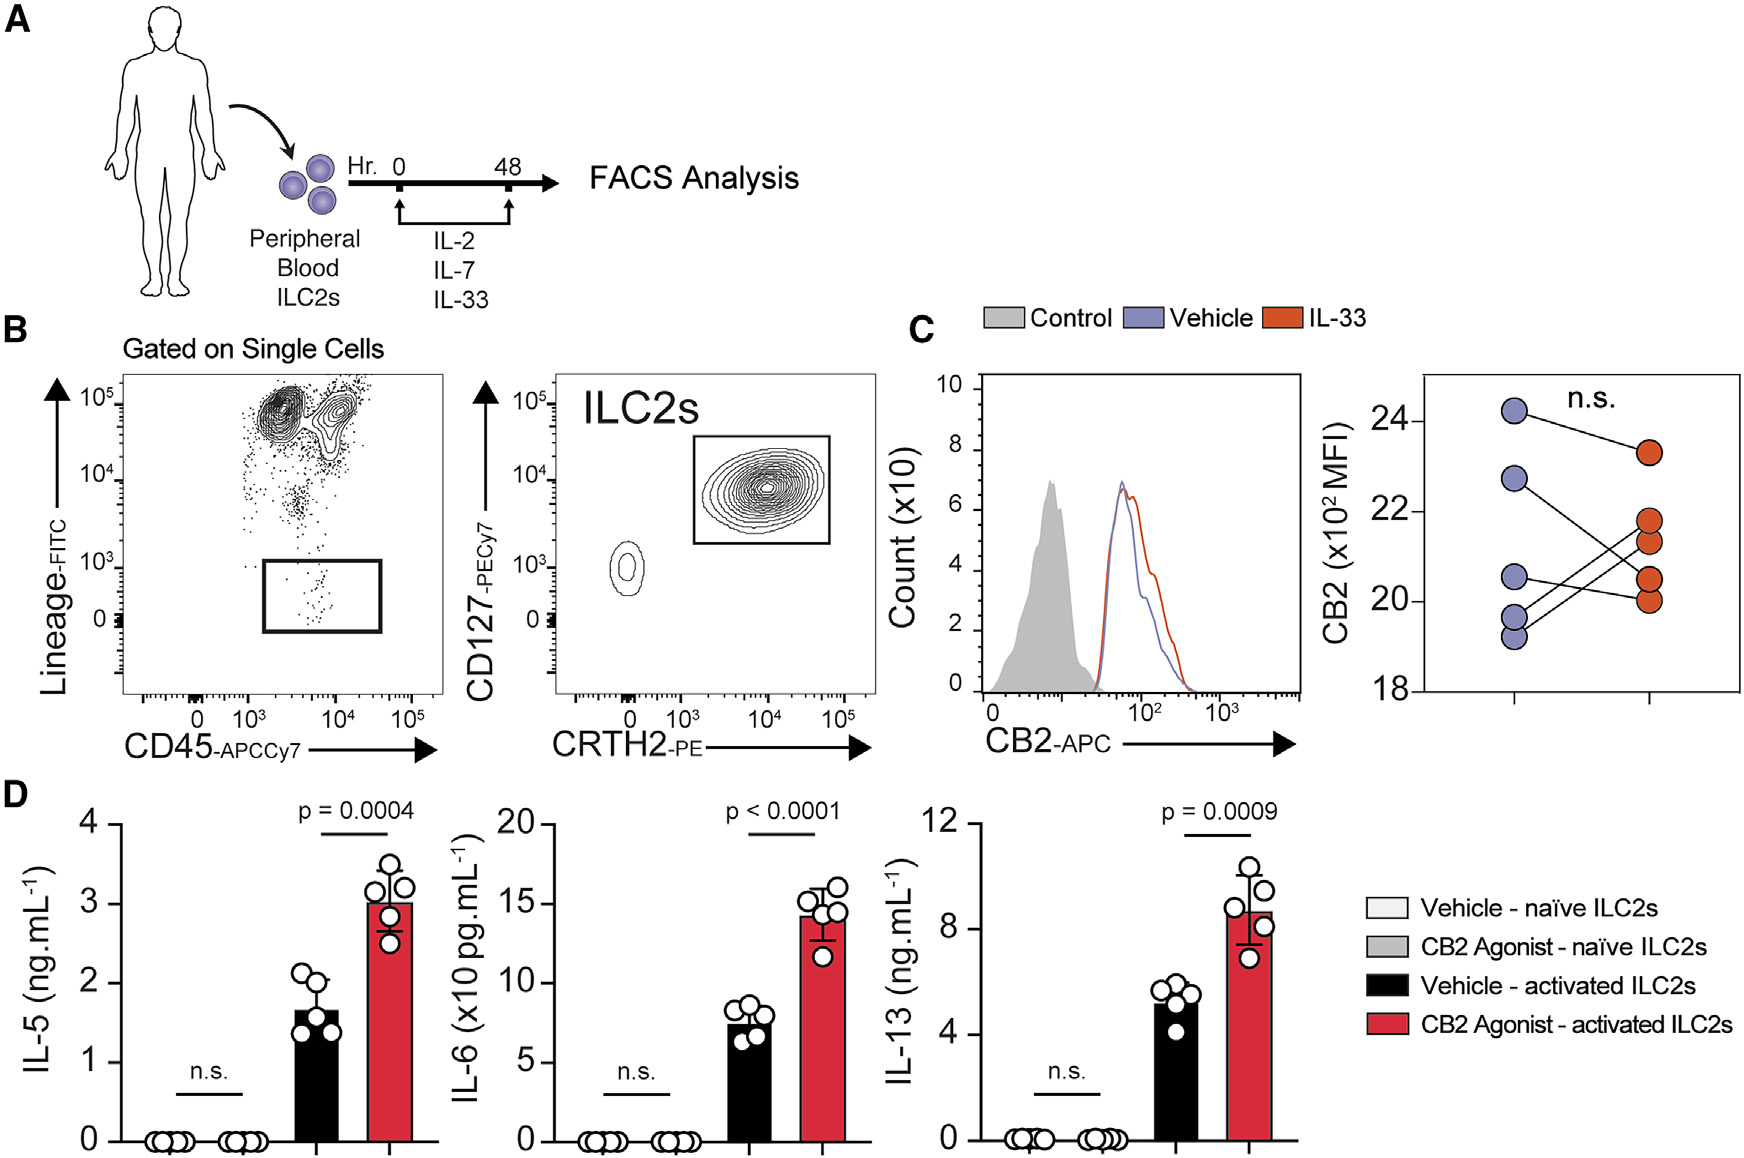
Development of type 2 diabetes mellitus (T2DM) is associated with low-grade chronic type 2 inflammation and disturbance of glucose homeostasis. Group 2 innate lymphoid cells (ILC2s) play a critical role in maintaining adipose homeostasis via the production of type 2 cytokines. Here, we demonstrate that CB2, a G-protein-coupled receptor (GPCR) and member of the endocannabinoid system, is expressed on both visceral adipose tissue (VAT)-derived murine and human ILC2s. Moreover, we utilize a combination of ex vivo and in vivo approaches to explore the functional and therapeutic impacts of CB2 engagement on VAT ILC2s in a T2DM model. Our results show that CB2 stimulation of ILC2s protects against insulin-resistance onset, ameliorates glucose tolerance, and reverses established insulin resistance. Our mechanistic studies reveal that the therapeutic effects of CB2 are mediated through activation of the AKT, ERK1/2, and CREB pathways on ILC2s. The results reveal that the CB2 agonist can serve as a candidate for the prevention and treatment of T2DM.

Keywords: CB2; CP: Immunology; CP: Metabolism; ILC2; T2DM; adipose inflammation; glucose tolerance; immunotherapy; insulin resistance.


Conflict of interest statement

Declaration of interests The authors declare no competing interests.

Figures

Figure 1.
Figure 1.. CB2 engagement enhances activity and proliferation of activated ILC2s
(A) C57BL/6J mice were assigned to receive a normal chow diet (NCD) for 14 weeks, followed by intraperitoneal (i.p.) administration of recombinant mouse (rm)IL-33 (0.5 μg in 50 μL) or PBS for 3 days. On the 4th day, the mice were euthanized, and visceral adipose tissue (VAT) was collected. n = 6. (B) Gating strategy of LinCD45+IL-7R+ST2+ILC2s. (C) CB2 expression in naive and IL-33-activated murine VAT-derived ILC2s versus the vehicle control. CB2 expression is quantified as mean fluorescence intensity (MFI). (D–F) Naive and activated VAT ILC2s were cultured with rmIL-2 and rmIL-7 and stimulated with CB2 agonist (10 μg/mL) or vehicle control (2% dimethyl sulfoxide) for 48 h. Levels of IL-5, IL-6, and IL-13 in culture supernatants were assessed by LEGENDplex (D). Intranuclear expression of Ki67 (E) and GATA-3 (F) were quantified as MFI. Data are representative of 3 independent experiments, and bar graphs are shown as mean ± SEM. Statistical analyses involved one-way ANOVA (C) and two-tailed Student’s t test (D–F); n.s.: p > 0.05. Mouse image used with permission from Servier Medical Art.
Figure 2.
Figure 2.. CB2 stimulation protects from the onset of type 2 diabetes in WT mice
(A) Cohorts of C57BL/6J mice were assigned to receive either a NCD or a high-fat diet (HFD) and treated with either CB2 agonist (1 mg/kg/mouse) or vehicle control (2% dimethyl sulfoxide) via i.p. injections every 4 days. n = 6. (B and C) Mice weight (B) and fasting blood glucose levels (C) were measured every 2 weeks for 14 weeks. (D and E) Glucose tolerance test (D) and insulin tolerance test (E) were conducted on the 14th and 15th week of the treatment, respectively. Data are representative of 3 independent experiments, and bar graphs are shown as mean ± SEM. Statistical analysis involved one-way ANOVA (B and C) and two-way ANOVA (D and E); n.s.: p > 0.05. Mouse image used with permission from Servier Medical Art.
Figure 3.
Figure 3.. CB2 engagement provides preventive protection against type 2 diabetes in alymphoid mice
(A) Cohorts of Rag2−/− mice were fed an HFD and i.p. treated with either CB2 agonist (1 mg/kg/mouse) or vehicle (2% dimethyl sulfoxide) every 4 days. n = 6. (B and C) Mice weights (B) and fasting blood glucose levels (C) were measured every 2 weeks for 14 weeks. (D) Plasma insulin concentrations were quantified using ELISA. (E and F) Glucose tolerance test (E) and insulin tolerance test (F) were performed at the end of the 14th and 15th weeks, respectively. The corresponding area under the curve (AUC) was calculated for each group. (G) Relative expression of Ucp1 mRNA in VAT lysates. (H) Relative amount of CD45+CD11bhiF4/80hiCD206+CD11c+ alternatively activated macrophages (AAM) in VAT after 14 weeks of treatment. n = 6. (I) The mRNA expression of VAT lysates after 14 weeks was determined by real-time qPCR using specific primers for Cidea, Prdm16, Pgc1a, Cox7a, Dio2, and hypoxanthine-guanine phosphoribosyltransferase (Hprt). (J) Epididymal adipose tissue sections stained with hematoxylin and eosin (×400, scale bars: 100 μm). (K and L) Quantitation of the mean adipocyte area (K) and the number of adipocytes per milligram of VAT (L). Data are representative of 3 independent experiments, and bar graphs are shown as mean ± SEM. Statistical analysis involved one-way ANOVA (B and C), two-way ANOVA (E and F), and two-tailed Student’s t test (D, G–I, and J–K). Mouse image used with permission from Servier Medical Art.
Figure 4.
Figure 4.. Therapeutic CB2 treatment ameliorates established type 2 diabetes in alymphoid mice
(A) Cohorts of Rag2−/− mice were fed an HFD for 14 weeks. After 8 weeks of diet, mice were assigned to i.p. treatments with either CB2 agonist (1 mg/kg/mouse) or vehicle (2% dimethyl sulfoxide) every 4 days. n = 6. (B and C) Mice weights (B) and fasting blood glucose levels (C) were measured every 2 weeks for 14 weeks. (D) Plasma insulin concentrations were quantified using ELISA. (E and F) Glucose tolerance test (E) and insulin tolerance test (F) were performed at the end of the 14th and 15th weeks, respectively. The corresponding AUC was calculated for each group. (G) Epididymal adipose tissue sections stained with hematoxylin and eosin (×400, scale bars: 100 μm). (H and I) Quantitation of the mean adipocyte area (H) and the number of adipocytes per milligram of VAT (I). Data are representative of 3 independent experiments, and bar graphs are shown as mean ± SEM. Statistical analysis involved one-way ANOVA (B and C), two-way ANOVA (E and F), and two-tailed Student’s t test (D, H, and I). Mouse image used with permission from Servier Medical Art.
Figure 5.
Figure 5.. Therapeutic effects of CB2 engagement depend on CB2 and IL-13 expression on ILC2s
(A) Cohorts of CB2−/− mice were either adoptively transferred with WT ILC2s isolated from C57BL/6J mice or left untreated. Mice were then treated with CB2 agonist (1 mg/kg/mouse) or vehicle control every 4 days and fed an HFD for 14 weeks. n = 6. (B and C) Mice weights (B) and fasting blood glucose level (C) were measured every 2 weeks for 14 weeks. (D) Glucose tolerance test were measured after 14 weeks of treatment. (E) Cohorts of CB2−/− mice were adoptively transferred with ILC2s from either WT, IL-5−/−, or IL-13−/− mice and then treated with CB2 agonist (1 mg/kg/mouse) or vehicle control and fed an HFD for 14 weeks. n = 6. (F and G) Mice weights (F) and fasting blood glucose level (G) were measured every 2 weeks for 14 weeks. (H) Glucose tolerance test was performed after 14 weeks of treatment. (I and J) VAT weight (I) was measured and the number of ILC2s per gram of VAT (J) was quantified 14 weeks after adoptive transfer. Data are representative of 3 independent experiments, and bar graphs are shown as mean ± SEM. Statistical analyses involved one-way ANOVA (B, C, F, and G), two-way ANOVA (D and H), and two-tailed Student’s t test (I and J). Mouse image used with permission from Servier Medical Art.
Figure 6.
Figure 6.. CB2 signaling induces the CREB pathway in activated VAT-derived ILC2s
WT and CB2 KO mice received i.p. injections of rmIL-33 (0.5 μg in 50 μL) for 3 days. On the 4th day, the mice were euthanized, and their VAT was collected. In vivo activated VAT-derived murine ILC2s (aILC2s) were isolated and cultured in the presence of rmIL-2 and rmIL-7 for 24 h. Total RNA was isolated for bulk RNA-seq. (A) Principal-component analysis of VAT-derived aILC2s from CB2 KO (red) and WT mice (blue). (B) A volcano plot comparison illustrates whole-transcriptome gene expression in VAT-derived aILC2s from CB2 KO and WT mice. Differentially expressed genes (identified as statistically significant with an adjusted p < 0.05) showing at least a 1.5-fold change (FC) are highlighted in red (upregulated) and blue (downregulated). Relevant differentially expressed genes are labeled. (C) A heatmap presents gene-specific analysis for RNA-seq expression, highlighting the genes that are differentially regulated in CB2 KO ILC2s compared to WT ILC2s. Differentially expressed genes were selected based on p < 0.05. (D) Gene set enrichment analysis conducted through Ingenuity Pathway Analysis displays the top canonical pathways influenced in CB2 KO aILC2s compared to WT aILC2s. (E) A schematic diagram exhibits the PI3K-AKT, protein kinase A (PKA), MEK, and CREB signaling pathways downstream of CB2. (F) A heatplot shows the differentially expressed genes associated with the PI3K-AKT, PKA, MEK, ERK1/2, p38, and CREB signaling pathways. (G–I) Intranuclear expression of pERK1/2 (G), phospho-AKT (pAKT) (H), and pCREB (I) on CB2 KO and WT ILC2s, quantified as MFI. Data are representative of 3 independent experiments, and bar graphs are shown as mean ± SEM. Statistical analysis, two-tailed Student’s t test (G-I); a p value of <0.05 was considered non-significant.
Figure 7.
Figure 7.. CB2 engagement enhances human ILC2 activity
(A) Human peripheral blood ILC2s were freshly isolated and cultured with 10 ng/mL of recombinant human (rh)IL-2, rhIL-7, and rhIL-33 for 48 h. (B) The gating strategy for LinCD45+CD127+CRTH2+ human ILC2s. (C) Flow cytometry analysis of CB2 expression on naive and IL-33-activated ILC2s, quantified as MFI with SEM. (D) Naive and activated ILC2s were cultured with 10 ng/mL of rhIL-2, rhIL-7, and either CB2 agonist or vehicle control for 48 h. Levels of IL-5, IL-6, and IL-13 in the culture supernatants were quantified by LEGENDplex. Data are representative of five individual blood donors, presented as mean ± SEM. Statistical analysis involved one-way ANOVA (C) or two-tailed Student’s t test (D); n.s.: p > 0.05. Human image used with permission from Servier Medical Art.

Similar articles

Cited by

References

    1. Khan MAB, Hashim MJ, King JK, Govender RD, Mustafa H, and Al Kaabi J (2020). Epidemiology of Type 2 Diabetes - Global Burden of Disease and Forecasted Trends. J. Epidemiol. Glob. Health 10, 107–111. 10.2991/jegh.k.191028.001. - DOI - PMC - PubMed
    1. Kanneganti TD, and Dixit VD (2012). Immunological complications of obesity. Nat. Immunol. 13, 707–712. 10.1038/ni.2343. - DOI - PubMed
    1. Painter JD, and Akbari O (2021). Type 2 Innate Lymphoid Cells: Protectors in Type 2 Diabetes. Front. Immunol. 12, 727008. 10.3389/fimmu.2021.727008. - DOI - PMC - PubMed
    1. Hurrell BP, Shen S, Li X, Sakano Y, Kazemi MH, Quach C, Shafiei-Jahani P, Sakano K, Ghiasi H, and Akbari O (2024). Piezo1 channels restrain ILC2s and regulate the development of airway hyperreactivity. J. Exp. Med. 221, e20231835. 10.1084/jem.20231835. - DOI - PMC - PubMed
    1. Hurrell BP, Sakano Y, Shen S, Helou DG, Li M, Shafiei-Jahani P, Kazemi MH, Sakano K, Li X, Quach C, et al. (2024). Iron controls the development of airway hyperreactivity by regulating ILC2 metabolism and effector function. Sci. Transl. Med. 16, eadk4728. 10.1126/scitranslmed.adk4728. - DOI - PubMed

Publication types

MeSH terms

Substances