A λ-Dynamics Investigation of Insulin Wakayama and Other A3 Variant Binding Affinities to the Insulin Receptor
- PMID: 38963805
- PMCID: PMC11268370
- DOI: 10.1021/acs.jcim.4c00662
A λ-Dynamics Investigation of Insulin Wakayama and Other A3 Variant Binding Affinities to the Insulin Receptor
Abstract
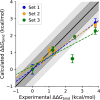
Insulin Wakayama is a clinical insulin variant where a conserved valine at the third residue on insulin's A chain (ValA3) is replaced with a leucine (LeuA3), weakening insulin receptor (IR) binding by 140-500-fold. This severe impact on binding from a subtle modification has posed an intriguing problem for decades. Although experimental investigations of natural and unnatural A3 mutations have highlighted the sensitivity of insulin-IR binding at this site, atomistic explanations of these binding trends have remained elusive. We investigate this problem computationally using λ-dynamics free energy calculations to model structural changes in response to perturbations of the ValA3 side chain and to calculate associated relative changes in binding free energy (ΔΔGbind). The Wakayama LeuA3 mutation and seven other A3 substitutions were studied in this work. The calculated ΔΔGbind results showed high agreement compared to experimental binding potencies with a Pearson correlation of 0.88 and a mean unsigned error of 0.68 kcal/mol. Extensive structural analyses of λ-dynamics trajectories revealed that critical interactions were disrupted between insulin and the insulin receptor as a result of the A3 mutations. This investigation also quantifies the effect that adding an A3 Cδ atom or losing an A3 Cγ atom has on insulin's binding affinity to the IR. Thus, λ-dynamics was able to successfully model the effects of mutations to insulin's A3 side chain on its protein-protein interactions with the IR and shed new light on a decades-old mystery: the exquisite sensitivity of hormone-receptor binding to a subtle modification of an invariant insulin residue.
Conflict of interest statement
The authors declare no competing financial interest.
Figures


Update of
-
A λ-dynamics investigation of insulin Wakayama and other A3 variant binding affinities to the insulin receptor.bioRxiv [Preprint]. 2024 Mar 17:2024.03.15.585233. doi: 10.1101/2024.03.15.585233. bioRxiv. 2024. Update in: J Chem Inf Model. 2024 Jul 22;64(14):5657-5670. doi: 10.1021/acs.jcim.4c00662. PMID: 38559010 Free PMC article. Updated. Preprint.
Similar articles
-
A λ-dynamics investigation of insulin Wakayama and other A3 variant binding affinities to the insulin receptor.bioRxiv [Preprint]. 2024 Mar 17:2024.03.15.585233. doi: 10.1101/2024.03.15.585233. bioRxiv. 2024. Update in: J Chem Inf Model. 2024 Jul 22;64(14):5657-5670. doi: 10.1021/acs.jcim.4c00662. PMID: 38559010 Free PMC article. Updated. Preprint.
-
The Black Book of Psychotropic Dosing and Monitoring.Psychopharmacol Bull. 2024 Jul 8;54(3):8-59. Psychopharmacol Bull. 2024. PMID: 38993656 Free PMC article. Review.
-
Systemic pharmacological treatments for chronic plaque psoriasis: a network meta-analysis.Cochrane Database Syst Rev. 2021 Apr 19;4(4):CD011535. doi: 10.1002/14651858.CD011535.pub4. Cochrane Database Syst Rev. 2021. Update in: Cochrane Database Syst Rev. 2022 May 23;5:CD011535. doi: 10.1002/14651858.CD011535.pub5. PMID: 33871055 Free PMC article. Updated.
-
Systemic pharmacological treatments for chronic plaque psoriasis: a network meta-analysis.Cochrane Database Syst Rev. 2017 Dec 22;12(12):CD011535. doi: 10.1002/14651858.CD011535.pub2. Cochrane Database Syst Rev. 2017. Update in: Cochrane Database Syst Rev. 2020 Jan 9;1:CD011535. doi: 10.1002/14651858.CD011535.pub3. PMID: 29271481 Free PMC article. Updated.
-
Drugs for preventing postoperative nausea and vomiting in adults after general anaesthesia: a network meta-analysis.Cochrane Database Syst Rev. 2020 Oct 19;10(10):CD012859. doi: 10.1002/14651858.CD012859.pub2. Cochrane Database Syst Rev. 2020. PMID: 33075160 Free PMC article.
Cited by
-
Quantifying the Structural and Energetic Consequences of EXOSC3 S1 Domain Variants from a Comparative Assessment of λ-Dynamics with Two Charge-Changing Perturbation Strategies.bioRxiv [Preprint]. 2025 Jul 4:2025.06.30.662390. doi: 10.1101/2025.06.30.662390. bioRxiv. 2025. PMID: 40631312 Free PMC article. Preprint.
References
-
- Adams M. J.; Blundell T. L.; Dodson E. J.; Dodson G. G.; Vijayan M.; Baker E. N.; Harding M. M.; Hodgkin D. C.; Rimmer B.; Sheat S. Structure of rhombohedral 2 zinc insulin crystals. Nature 1969, 224, 491–495. 10.1038/224491a0. - DOI
MeSH terms
Substances
Grants and funding
LinkOut - more resources
Full Text Sources
Medical

