

Genomic Epidemiology and Evolution of Rhinovirus in Western Washington State, 2021-2022
- PMID: 38963827
- PMCID: PMC11793040
- DOI: 10.1093/infdis/jiae347
Genomic Epidemiology and Evolution of Rhinovirus in Western Washington State, 2021-2022
Abstract
Background: Human rhinoviruses (RVs) primarily cause the common cold, but infection outcomes vary from subclinical to severe cases, including asthma exacerbations and fatal pneumonia in individuals who are immunocompromised. To date, therapeutic strategies have been hindered by the high diversity of serotypes. Global surveillance efforts have traditionally focused on sequencing VP1 or VP2/VP4 genetic regions, leaving gaps in our understanding of RV genomic diversity.
Methods: We sequenced 1078 RV genomes from nasal swabs of symptomatic and asymptomatic individuals to explore viral evolution during 2 epidemiologically distinct periods in Washington State: when the COVID-19 pandemic affected the circulation of other seasonal respiratory viruses except for RV (February-July 2021) and when the seasonal viruses reemerged with the severe outbreak of respiratory syncytial virus and influenza (November-December 2022). We constructed maximum likelihood and BEAST phylodynamic trees to characterize intragenotype evolution.
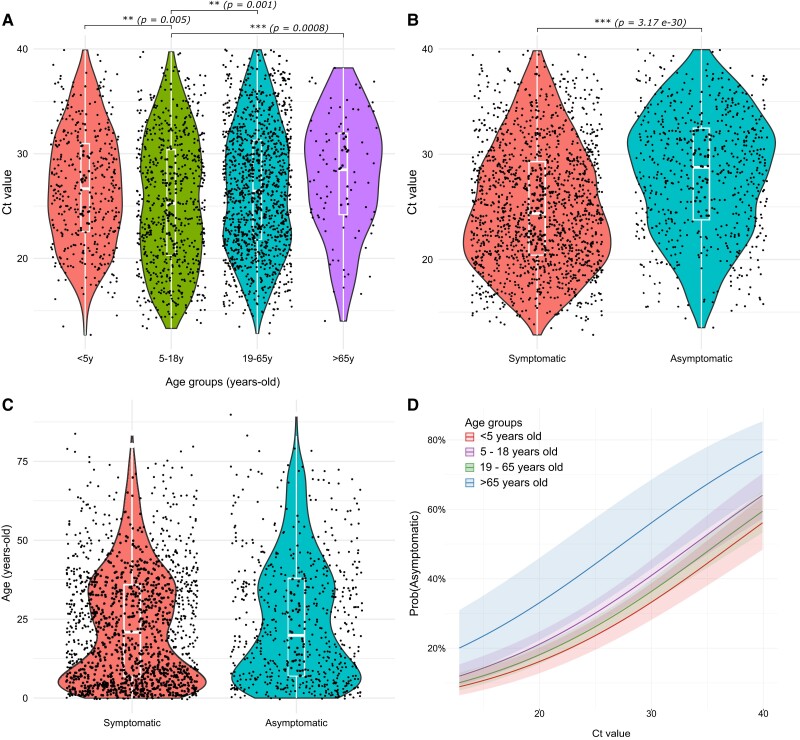
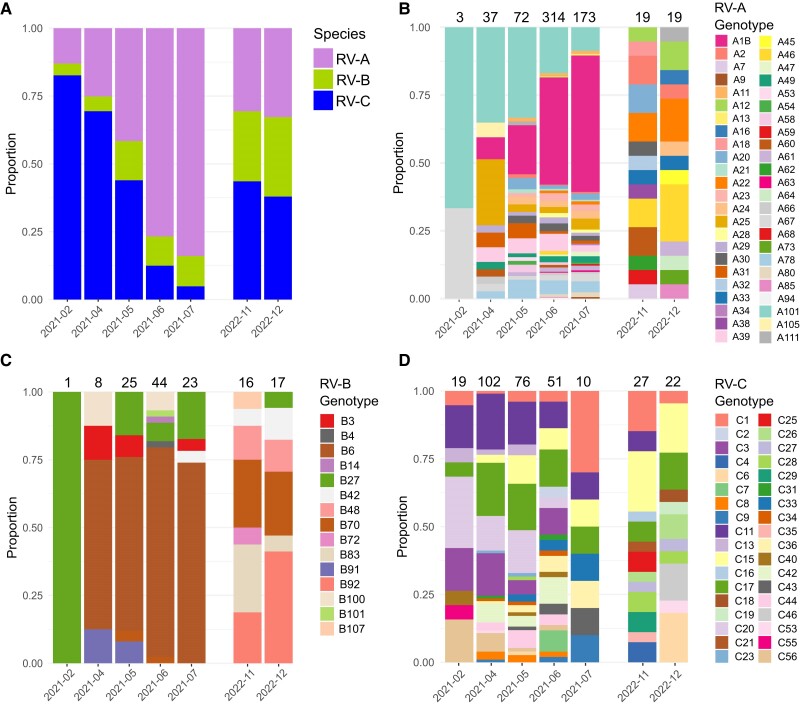
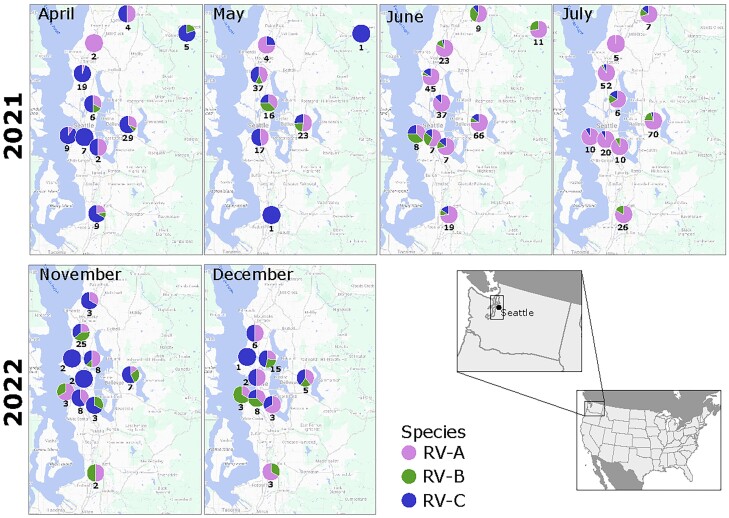
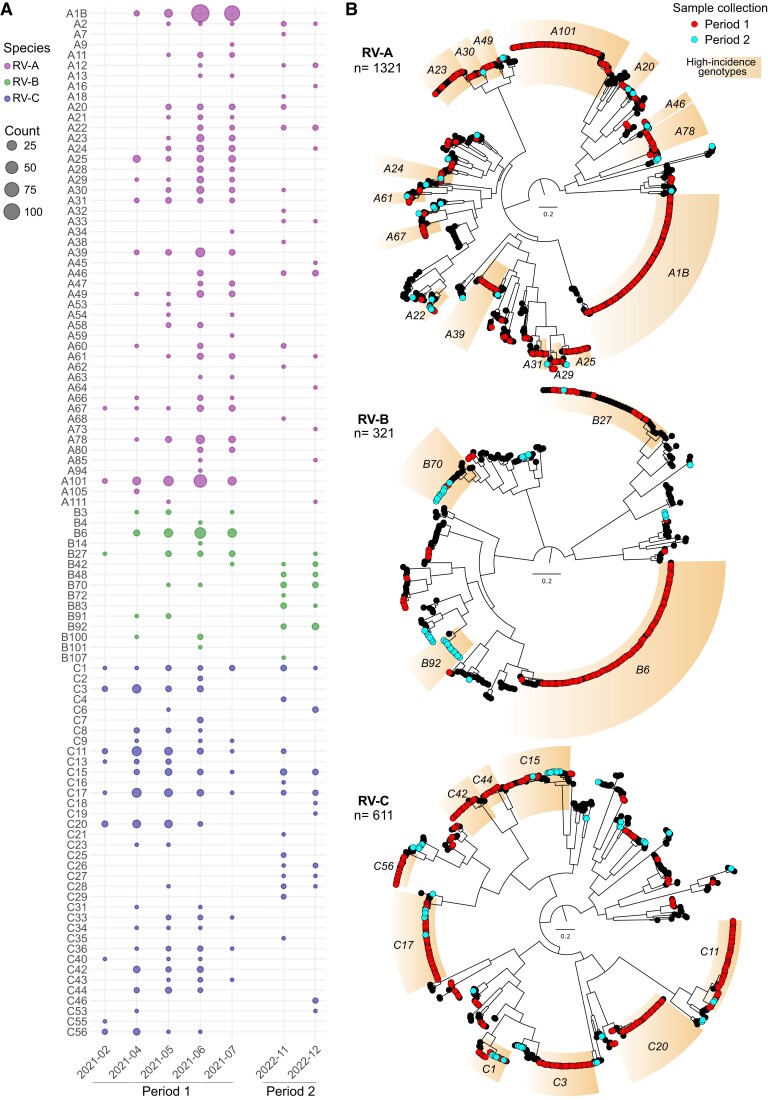
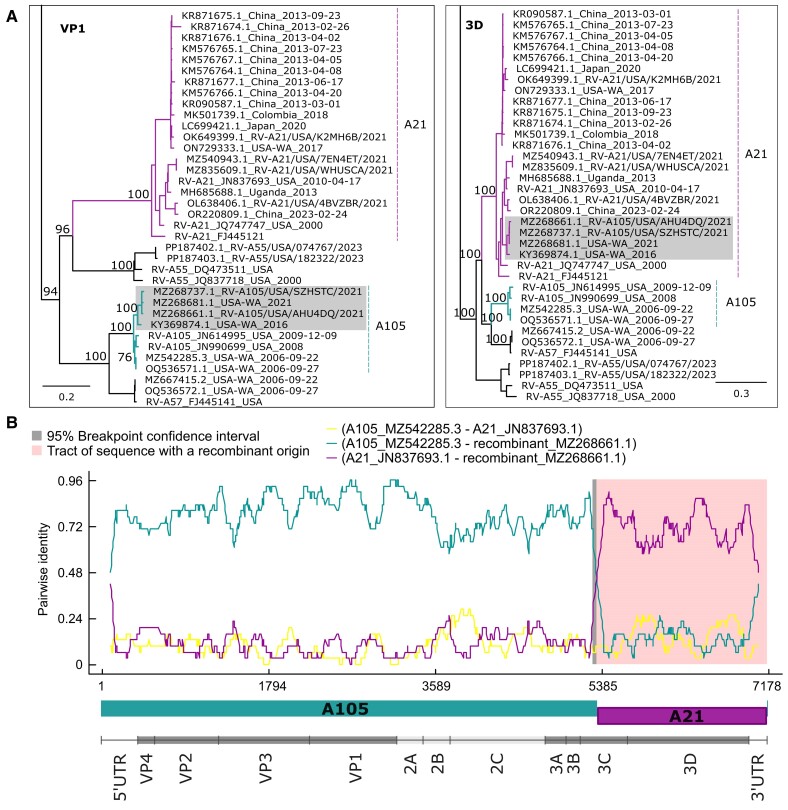
Results: We detected 99 of 168 known genotypes and observed intergenotypic recombination and genotype cluster swapping from 2021 to 2022. We found a significant association between the presence of symptoms and viral load but not with RV species or genotype. Phylodynamic trees, polyprotein selection pressure, and Shannon entropy revealed cocirculation of divergent clades within genotypes with high amino acid constraints throughout the polyprotein.
Conclusions: Our study underscores the dynamic nature of RV genomic epidemiology within a localized geographic region, as >20% of existing genotypes within each RV species cocirculated each studied month. Our findings also emphasize the importance of investigating correlations between RV genotypes and serotypes to understand long-term immunity and cross-protection.
Keywords: VP1; Washington; genomic epidemiology; rhinovirus; viral evolution.
© The Author(s) 2024. Published by Oxford University Press on behalf of Infectious Diseases Society of America.
Conflict of interest statement
Potential conflict of interest. A. L. G. reports contract testing from Abbott, Cepheid, Novavax, Pfizer, Janssen, and Hologic and research support from Gilead outside the described work. All other authors report no potential conflict of interest. All authors have submitted the ICMJE Form for Disclosure of Potential Conflicts of Interest. Conflicts that the editors consider relevant to the content of the manuscript have been disclosed.
Figures
Similar articles
-
Human Rhinoviruses in Adult Patients in a Tertiary Care Hospital in Germany: Molecular Epidemiology and Clinical Significance.Viruses. 2021 Oct 8;13(10):2027. doi: 10.3390/v13102027. Viruses. 2021. PMID: 34696457 Free PMC article.
-
[Genotypes of rhinoviruses in children and adults patients with acute respiratory tract infections].Mikrobiyol Bul. 2017 Oct;51(4):350-360. doi: 10.5578/mb.61820. Mikrobiyol Bul. 2017. PMID: 29153065 Turkish.
-
Circulation of different rhinovirus groups among children with lower respiratory tract infection in Kiremba, Burundi.Eur J Clin Microbiol Infect Dis. 2012 Nov;31(11):3251-6. doi: 10.1007/s10096-012-1692-9. Epub 2012 Jul 12. Eur J Clin Microbiol Infect Dis. 2012. PMID: 22790539
-
Effects of COVID-19 and Social Distancing on Rhinovirus Infections and Asthma Exacerbations.Viruses. 2022 Oct 25;14(11):2340. doi: 10.3390/v14112340. Viruses. 2022. PMID: 36366439 Free PMC article. Review.
-
Understanding Rhinovirus Circulation and Impact on Illness.Viruses. 2022 Jan 13;14(1):141. doi: 10.3390/v14010141. Viruses. 2022. PMID: 35062345 Free PMC article. Review.
Cited by
-
Hidden in plain sight: the impact of human rhinovirus infection in adults.Respir Res. 2025 Mar 28;26(1):120. doi: 10.1186/s12931-025-03178-w. Respir Res. 2025. PMID: 40155903 Free PMC article. Review.
-
Surveillance of Respiratory Pathogens Among Rapid Diagnostic Test-Negative Acute Respiratory Infection Patients in Myanmar in 2023, with a Focus on Rhinovirus and Enterovirus Genotyping.Viruses. 2025 Jun 17;17(6):860. doi: 10.3390/v17060860. Viruses. 2025. PMID: 40573450 Free PMC article.
References
MeSH terms
LinkOut - more resources
Full Text Sources
