. 2024 Sep 3;36(9):3770-3786.
doi: 10.1093/plcell/koae197.

A cargo sorting receptor mediates chloroplast protein trafficking through the secretory pathway

Affiliations

A cargo sorting receptor mediates chloroplast protein trafficking through the secretory pathway

Jinling Liu et al. Plant Cell. .

Abstract

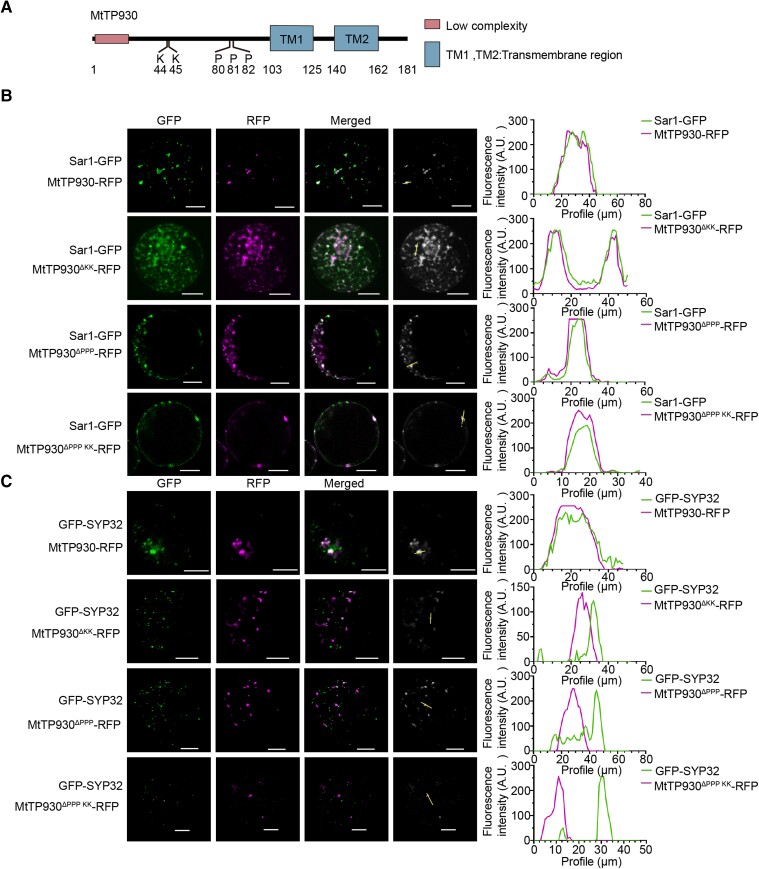
Nucleus-encoded chloroplast proteins can be transported via the secretory pathway. The molecular mechanisms underlying the trafficking of chloroplast proteins between the intracellular compartments are largely unclear, and a cargo sorting receptor has not previously been identified in the secretory pathway. Here, we report a cargo sorting receptor that is specifically present in Viridiplantae and mediates the transport of cargo proteins to the chloroplast. Using a forward genetic analysis, we identified a gene encoding a transmembrane protein (MtTP930) in barrel medic (Medicago truncatula). Mutation of MtTP930 resulted in impaired chloroplast function and a dwarf phenotype. MtTP930 is highly expressed in the aerial parts of the plant and is localized to the endoplasmic reticulum (ER) exit sites and Golgi. MtTP930 contains typical cargo sorting receptor motifs, interacts with Sar1, Sec12, and Sec24, and participates in coat protein complex II vesicular transport. Importantly, MtTP930 can recognize the cargo proteins plastidial N-glycosylated nucleotide pyrophosphatase/phosphodiesterase (MtNPP) and α-carbonic anhydrase (MtCAH) in the ER and then transport them to the chloroplast via the secretory pathway. Mutation of a homolog of MtTP930 in Arabidopsis (Arabidopsis thaliana) resulted in a similar dwarf phenotype. Furthermore, MtNPP-GFP failed to localize to chloroplasts when transgenically expressed in Attp930 protoplasts, implying that these cargo sorting receptors are conserved in plants. These findings fill a gap in our understanding of the mechanism by which chloroplast proteins are sorted and transported via the secretory pathway.


Conflict of interest statement

Conflict of interest statement. None declared.

Figures

Figure 1.
Figure 1.
The Mttp930 mutant plants have defects in growth and photosynthesis. A) Schematic diagram of the MtTP930 genomic structure and Tnt1 insertion sites. Solid rectangles represent exons, hollow rectangles represent 5′ or 3′ UTR, and lines represent introns. The vertical arrow marks the location of Tnt1 retrotransposon in the Mttp930 mutants. Scale bar, 100 bp. WT, NF7638, NF18192, and NF15873 mutant plants and proMtTP930:MtTP930/NF15873 and proMtTP930:MtTP930/NF18192 plants grown under normal conditions for 4 wk. Scale bar, 1 cm. B and C) PCR identification of the Mttp930 mutants. The Tnt1 insertion mutants of NF7638, NF18192, and NF15873 were identified. The templates were genomic DNA from the T1 generation isolated from the NF7638, NF18192, and NF15873 mutants. Tnt1-F1, Tnt1-F2, MtTP930-F, and MtTP930-R were primers for PCR of the extracted genomic DNA. The red box represents the NF7638, NF18192, and NF15873 Tnt1 homozygous mutants. N, negative control. D) RT-PCR analysis of full-length transcripts of MtTP930 in WT and NF7638, NF18192, and NF15873 mutant plants. MtACTIN was the internal reference gene. E) The chlorophyll content (SPAD indicated), maximum quantum yield (Fv/Fm) and actual quantum yield Y(II) of 4-wk-old WT, NF7638, NF18192, and NF15873 mutant plants and proMtTP930:MtTP930/NF15873 and proMtTP930:MtTP930/NF18192 plants. The data were expressed as mean ± Se. One-way ANOVA, n ≥ 30; significant differences are labeled (a, b, c, P < 0.05). F) The light curves and fluorescence-induced kinetic curves of 4-wk-old WT, NF7638, NF18192, and NF15873 mutant plants and proMtTP930:MtTP930/NF15873 and proMtTP930:MtTP930/NF18192 plants. The data were expressed as mean ± Se. One-way ANOVA, n = 2; significant differences are labeled (*P < 0.05, **P < 0.01, ***P < 0.001, ****P < 0.0001, and ns, nonsignificant). ETR: relative electron transfer rate. Light curve: the light curve program exposes a sample to stepwise increasing intensities of actinic illumination. In “rapid light curves” (RLC), the time interval of each light step is short (down to 10 s) and full equilibration of photosynthetic reactions is not reached within an illumination interval. Light induction curve data obtained follow the typical “slow-phase” fluorescence induction kinetics. G) The length of aerial part, root length, fresh weight of aerial part, and fresh weight of root of the 4-wk-old WT, NF7638, NF18192, and NF15873 mutant plants and proMtTP930:MtTP930/NF15873 and proMtTP930:MtTP930/NF18192 plants. The data were expressed as mean ± Se. One-way ANOVA, n ≥ 15; significant differences are labeled (a, b, c, P < 0.05).
Figure 2.
Figure 2.
MtTP930 was a dual-localization protein at ERESs and Golgi. A) The hypothetical membrane topology of MtTP930 predicted by the online tool “Phobius server” (https://phobius.sbc.su.se/). B) Cellular fractionation and immunoblotting analysis of MtTP930-Flag protein in N. benthamiana leaves. M, membrane proteins; C, cytoplasmic proteins; N, nuclear proteins. Immunoblotting analysis with Flag, H+-ATPase (membrane marker), cFBPase (cytoplasmic marker), and Histone (nuclear marker) antibodies. C) Protease protection assay on the topology of MtTP930. MtTP930-Flag was expressed in N. benthamiana leaves. Microsomes were isolated and treated with (+) or without (−) trypsin and with (+) or without (−) Triton X-100. Immunoblotting analysis with Flag and BIP antibody, respectively. ER lumen protein BIP as control. D) Proposed topology of MtTP930, revised from the “Protter” (http://wlab.ethz.ch/protter/). E) Colocalization of MtTP930-GFP, Sar1-RFP, and RFP-Sec12 in N. benthamiana leaf cells. Monitored by SP8 laser scanning confocal system. This far right panel converted the merge graph from RGB format to 8-bit format in order to make the straight lines appear more clearly. The relative fluorescence intensities shown were measured using the ImageJ software. The horizontal axis represents the pixel points on the line, and the vertical axis is the corresponding grayscale value of each point; the image represents the trend of the grayscale change. Comparison of the GFP/RFP channel results reflected the colocalization situation. Scale bar, 20 μm. F) Localization of MtTP930 in M. truncatula root cells by immunofluorescence assay. Detected by corresponding antibodies (anti-MtTP930, anti-ARF1, and anti-Sar1). Monitored by SP8 laser scanning confocal system. Scale bar, 20 μm.
Figure 3.
Figure 3.
MtTP930 interacted with COPII proteins. A to C) Phylogenetic identification of the homologs of AtSec12, AtSar1, and AtSec24 in M. truncatula genomic database through BLAST search (https://medicago.toulouse.inra.fr/MtrunA17r5.0-ANR/). The tree is drawn to scale, with branch lengths (next to the branches) in the same units as those of the evolutionary distances used to infer the phylogenetic tree. The box marked Medtr4g084650 is MtSec12, Medtr7g112090 is MtSar1, and Medtr7g111710 is MtSec24. D to F) Firefly luciferase complementation imaging assays of the interaction between MtTP930 and MtSec12, MtSar1, and MtSec24 in N. benthamiana leaves. Luciferase fluorescence was detected using a CCD camera. The color scale represents the intensity of luminescence. G and H) Detection of the interaction between MtTP930 and MtSec12 or MtSar1 proteins by Co-IP in Arabidopsis protoplasts. MtTP930 was tagged with GFP (MtTP930-GFP). GFP-Flag was employed as the negative control. Total proteins were extracted from the Arabidopsis protoplasts, which were cotransformed with the indicated constructs and incubated with GFP beads to immunoprecipitate the target protein. Coprecipitated proteins were analyzed by immunoblotting using anti-GFP, anti-HA, and anti-MYC antibodies. I) Detection of the interaction between MtTP930 and MtSec24 proteins by Co-IP in N. benthamiana leaves. MtTP930 was tagged with GFP (MtTP930-GFP). GFP-Flag was employed as the negative control. Total proteins were extracted from the N. benthamiana leaves, which were cotransformed with the indicated constructs and incubated with GFP beads to immunoprecipitate the target protein. Coprecipitated proteins were analyzed by immunoblotting using anti-GFP and anti-HA antibodies.
Figure 4.
Figure 4.
The PPP motif and KK motif are essential for the proper localization of MtTP930. A) The MtTP930 protein structure predicted by the SMART website (https://smart.embl.de/; MtTP930, 1 to 181 aa). B) Cotransformed MtTP930△KK-RFP, MtTP930△PPP-RFP, or MtTP930△PPP KK-RFP with Sar1-GFP in N. benthamiana protoplasts. Scale bar, 20 μm. C) Cotransformed MtTP930△KK-RFP, MtTP930△PPP-RFP, or MtTP930△PPP KK-RFP with GFP-SYP32 in N. benthamiana protoplasts. Scale bar, 20 μm.
Figure 5.
Figure 5.
MtTP930 was responsible for MtNPP transporting from ER to Golgi. A) Identification of OsNPP1 homolog in M. truncatula by phylogenetic analysis through BLAST search (https://medicago.toulouse.inra.fr/MtrunA17r5.0-ANR/). The tree is drawn to scale, with branch lengths (next to the branches) in the same units as those of the evolutionary distances used to infer the phylogenetic tree. The box marked Medtr4g103520 is MtNPP. B) Subcellular localization of MtNPP before and after BFA treatment (BFA, 2 h). Coexpression of MtNPP-GFP with ARFT31N-RFP or Sar1H74L-RFP in N. benthamiana protoplasts, after 16-h incubation; MtNPP-GFP expressed protoplasts were treated with or without 10 µg/mL BFA for 2 h, then monitored by SP8 laser scanning confocal system. Chl is chloroplast autofluorescence. Scale bar, 20 μm. C) Effect of MtTP930 mutation on the chloroplast localization of MtNPP-GFP. Expression of MtNPP-GFP in WT and Mttp930 mutant protoplasts. After 16-h incubation, MtNPP-GFP was monitored by SP8 laser scanning confocal system. Chl is chloroplast autofluorescence. Scale bar, 10 μm. D) Firefly luciferase complementary imaging assays of the interaction of full-length MtTP930 and MtNPP proteins in N. benthamiana leaves. Luciferase fluorescence was detected using a CCD camera. The color scale represents the intensity of luminescence. E) SuY2H analysis of the interaction between MtTP930 and MtNPP. NMY51 yeast cells carrying the ADE2 and HIS3 reporter genes. Yeast cells were grown on an appropriate medium (which did not contain the indicated amino acids [A, Ade; H, His, W, Trp; L, Leu] but contained 15 mm 3-AT). Alg5-NubI with MtTP930-Cub was used as positive control, and Alg5-NubG with MtTP930-Cub and Alg5-Cub with NubG-MtNPP were used as negative controls, respectively. F) Detection of MtTP930 and MtNPP interaction by Co-IP. MtTP930 was tagged with GFP (MtTP930-GFP). MtNPP was tagged with Flag (MtNPP-Flag). GFP-HA was employed as the negative control. Total proteins were extracted from Arabidopsis protoplasts, which were cotransformed with the indicated constructs and incubated with GFP beads to immunoprecipitate the target protein. Coprecipitated proteins were analyzed by immunoblotting using anti-GFP and anti-Flag antibodies. G) RT-PCR analysis of transcripts of MtNPP-GFP in proMtNPP:MtNPP-GFP/WT and proMtNPP:MtNPP-GFP/Mttp930 plants. MtACTIN4A was employed for quantification. H) Immunoblot analysis of MtNPP-GFP in proMtNPP:MtNPP-GFP/WT and proMtNPP:MtNPP-GFP/Mttp930 plants. The MtNPP-GFP fusion protein driven by the native promoter of MtNPP (2 kb) was transferred into WT and Mttp930 mutant plants, and total proteins were extracted. β-Actin was employed for quantification. I) Schemes of full length or truncated forms of MtTP930 (MtTP930n, 1 to 125 aa; MtTP930tm, 103 to 162 aa; MtTP930c, 140 to 181aa). The MtTP930 protein structure predicted by the SMART website (https://smart.embl.de/). J) Firefly luciferase complementation imaging analysis of the interaction regions of MtTP930 with MtNPP in N. benthamiana leaves. Luciferase fluorescence was detected using a CCD camera. The color scale represents the intensity of luminescence. K) Firefly luciferase complementation imaging analysis of the interaction regions of MtTP930 with MtSec12 or MtSar1 in N. benthamiana leaves. Luciferase fluorescence was detected using a CCD camera. L) Schematic diagram of the inferred structural relationship between MtTP930 and MtSec12, MtSar1, and MtNPP on the ER based on their interaction relationship.
Figure 6.
Figure 6.
The localization of MtCAH was changed in Mttp930 mutant. A) Phylogenetic identification of AtCAH1 homolog in M. truncatula through BLAST search (https://medicago.toulouse.inra.fr/MtrunA17r5.0-ANR/). The tree is drawn to scale, with branch lengths (next to the branches) in the same units as those of the evolutionary distances used to infer the phylogenetic tree. The box marked Medtr1g059960 is MtCAH. B) Subcellular localization study of MtCAH before and after BFA treatment (BFA, 2 h). Expression of MtCAH-GFP in N. benthamiana protoplasts, after 16-h incubation; protoplasts were treated with or without 10 µg/mL BFA for 2 h, then monitored by SP8 laser scanning confocal system. Chl is chloroplast autofluorescence. Scale bar, 20 μm. C) Effect of MtTP930 mutation on the chloroplast localization of MtCAH-GFP. Expression of MtCAH-GFP in WT and Mttp protoplasts. After 16-h incubation, expression of MtCAH-GFP was monitored by SP8 laser scanning confocal system. Chl is chloroplast autofluorescence. Scale bar, 10 μm. D) Firefly luciferase complementation imaging analysis of the interaction between full-length MtTP930 and MtCAH proteins in N. benthamiana leaves. Luciferase fluorescence was detected using a CCD camera. The color scale represents the intensity of luminescence. E) SuY2H analysis of the interaction between MtTP930 and MtCAH. NMY51 yeast cells carrying the ADE2 and HIS3 reporter genes. Yeast cells were grown on the appropriate medium (which did not contain the indicated amino acids [A, Ade; H, His, W, Trp; L, Leu] but contained 15 mm 3-AT). Alg5-NubI with MtTP930-Cub was used as the positive control, and Alg5-NubG with MtTP930-Cub and Alg5-Cub with NubG-MtCAH were used as negative controls, respectively.
Figure 7.
Figure 7.
The function of MtTP930 is conserved in A. thaliana. A) Mutation of AtTP930 led to dwarf and photosynthetic defects. Morphological observation of the WT (Col-0), Attp930-2, Attp930-2, and Attp930-5 mutant plants grown under normal conditions for 3 wk. Scale bar, 1 cm. B and C) Rosette area and chlorophyll content of the Col-0, Attp930-2, Attp930-3, and Attp930-5 mutant plants grown for 3 wk under normal growth conditions. The data were shown as mean ± Se, 1-way ANOVA, n > 15; significant differences are labeled (a, b, P < 0.05). D) Pictures (left panel) and PSII maximum quantum yield (Fv/Fm) false color images taken with the PlantExplorer (mobile chlorophyll fluorescence imaging system from PhenoTrait, right panel) of 3-wk-old Col-0, Attp930-2, Attp930-3, and Attp930-5 grown at normal growth conditions. Signal intensities for Fv/Fm are given by the false color scale. Scale bar, 1 cm. E) Bar graphs of the maximum quantum yield (Fv/Fm) of 3-wk-old Col-0, Attp930-2, Attp930-3, and Attp930-5 mutant plants. The data were shown as mean ± Se, 1-way ANOVA, n > 15; significant differences are labeled (a, b, P < 0.05). F) Morphological observation of Col-0, Attp930-2, Attp930-3, and Attp930-5 mutant plants grown under normal conditions for 5 wk. Scale bar, 1 cm. G) The plant height of the 5-wk-old Col-0, Attp930-2, Attp930-3, and Attp930-5 mutant plants was measured. The data were shown as mean ± Se, 1-way ANOVA, n > 15; significant differences are labeled (a, b, P < 0.05). H) Subcellular localization of MtNPP-GFP in Col-0 and Attp930 protoplasts. The MtNPP-GFP fusion protein driven by CaMV35S promoter (pE3025 vector) was transferred into the Arabidopsis mesophyll protoplasts. After a total of 16 h of transformation, fluorescence signals were observed using SP8 confocal microscope (Leica). Scale bars, 10 μm.
Figure 8.
Figure 8.
The working model of MtTP930. MtTP930 localizes in ERESs, recognizes cargo proteins MtNPP or MtCAH through the ER lumen region, and interacts with Sec12 through its N-terminal region. Sec12 then recruits Sar1 (small GTPase). After being catalyzed by Sec12, Sar1 is locally activated, exposes hydrophobic structures through GDP-GTP exchange, and inserts into the ER membrane. Then, Sar1 recruits the inner coat proteins Sec23/24, and Sec23/24 further recruit the outer coat proteins Sec13/31 to form the COPII vesicles. MtNPP, MtCAH, or other cargo proteins are loaded into COPII vesicles and transported to the Golgi apparatus.

Similar articles

Cited by

References

    1. Asatsuma S, Sawada C, Itoh K, Okito M, Kitajima A, Mitsui T. Involvement of alpha-amylase I-1 in starch degradation in rice chloroplasts. Plant Cell Physiol. 2005:46(6):858–869. 10.1093/pcp/pci091 - DOI - PubMed
    1. Bar-Peled M, Raikhel NV. Characterization of AtSEC12 and AtSAR1—proteins likely involved in endoplasmic reticulum and Golgi transport. Plant Physiol. 1997:114(1):315–324. 10.1104/pp.114.1.315 - DOI - PMC - PubMed
    1. Barlowe C, Helenius A. Cargo capture and bulk flow in the early secretory pathway. Annu Rev Cell Dev Bi. 2016:32(1):197–222. 10.1146/annurev-cellbio-111315-125016 - DOI - PubMed
    1. Béthune J, Wieland FT. Assembly of COPI and COPII vesicular coat proteins on membranes. Annu Rev Biophys. 2018:47(1):63–83. 10.1146/annurev-biophys-070317-033259 - DOI - PubMed
    1. Cervera M. Histochemical and fluorometric assays for uidA (GUS) gene detection. Methods Mol Biol. 2005:286:203–214. 10.1385/1-59259-827-7:203 - DOI - PubMed

MeSH terms

LinkOut - more resources