

Bayesian Networks for Prescreening in Depression: Algorithm Development and Validation
- PMID: 38963925
- PMCID: PMC11258528
- DOI: 10.2196/52045
Bayesian Networks for Prescreening in Depression: Algorithm Development and Validation
Abstract
Background: Identifying individuals with depressive symptomatology (DS) promptly and effectively is of paramount importance for providing timely treatment. Machine learning models have shown promise in this area; however, studies often fall short in demonstrating the practical benefits of using these models and fail to provide tangible real-world applications.
Objective: This study aims to establish a novel methodology for identifying individuals likely to exhibit DS, identify the most influential features in a more explainable way via probabilistic measures, and propose tools that can be used in real-world applications.
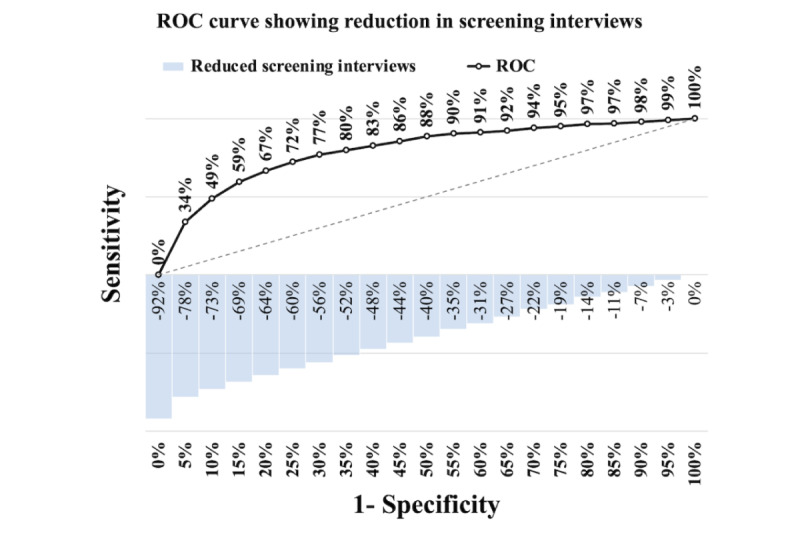
Methods: The study used 3 data sets: PROACTIVE, the Brazilian National Health Survey (Pesquisa Nacional de Saúde [PNS]) 2013, and PNS 2019, comprising sociodemographic and health-related features. A Bayesian network was used for feature selection. Selected features were then used to train machine learning models to predict DS, operationalized as a score of ≥10 on the 9-item Patient Health Questionnaire. The study also analyzed the impact of varying sensitivity rates on the reduction of screening interviews compared to a random approach.
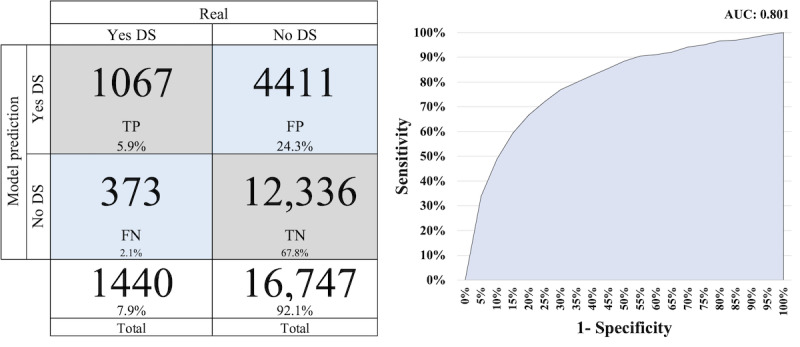
Results: The methodology allows the users to make an informed trade-off among sensitivity, specificity, and a reduction in the number of interviews. At the thresholds of 0.444, 0.412, and 0.472, determined by maximizing the Youden index, the models achieved sensitivities of 0.717, 0.741, and 0.718, and specificities of 0.644, 0.737, and 0.766 for PROACTIVE, PNS 2013, and PNS 2019, respectively. The area under the receiver operating characteristic curve was 0.736, 0.801, and 0.809 for these 3 data sets, respectively. For the PROACTIVE data set, the most influential features identified were postural balance, shortness of breath, and how old people feel they are. In the PNS 2013 data set, the features were the ability to do usual activities, chest pain, sleep problems, and chronic back problems. The PNS 2019 data set shared 3 of the most influential features with the PNS 2013 data set. However, the difference was the replacement of chronic back problems with verbal abuse. It is important to note that the features contained in the PNS data sets differ from those found in the PROACTIVE data set. An empirical analysis demonstrated that using the proposed model led to a potential reduction in screening interviews of up to 52% while maintaining a sensitivity of 0.80.
Conclusions: This study developed a novel methodology for identifying individuals with DS, demonstrating the utility of using Bayesian networks to identify the most significant features. Moreover, this approach has the potential to substantially reduce the number of screening interviews while maintaining high sensitivity, thereby facilitating improved early identification and intervention strategies for individuals experiencing DS.
Keywords: AI; Bayesian network; anxiety; artificial intelligence; depression; depressive symptom; digital mental health; eHealth; mHealth; machine learning; machine learning model; mental health; mobile health; mood; mood disorder; mood disorders; patient; patient screening; prediction; prediction modeling; probabilistic machine learning; socioeconomic data sets; stochastic gradient descent; survey; target depressive symptomatology; telehealth; utilization.
©Eduardo Maekawa, Eoin Martino Grua, Carina Akemi Nakamura, Marcia Scazufca, Ricardo Araya, Tim Peters, Pepijn van de Ven. Originally published in JMIR Mental Health (https://mental.jmir.org), 04.07.2024.
Conflict of interest statement
Conflicts of Interest: None declared.
Figures


Similar articles
-
Can Predictive Modeling Tools Identify Patients at High Risk of Prolonged Opioid Use After ACL Reconstruction?Clin Orthop Relat Res. 2020 Jul;478(7):0-1618. doi: 10.1097/CORR.0000000000001251. Clin Orthop Relat Res. 2020. PMID: 32282466 Free PMC article.
-
Screening for Depression and Anxiety Using a Nonverbal Working Memory Task in a Sample of Older Brazilians: Observational Study of Preliminary Artificial Intelligence Model Transferability.JMIR Form Res. 2024 Dec 12;8:e55856. doi: 10.2196/55856. JMIR Form Res. 2024. PMID: 39727020 Free PMC article.
-
Predicting Emotional States Using Behavioral Markers Derived From Passively Sensed Data: Data-Driven Machine Learning Approach.JMIR Mhealth Uhealth. 2021 Mar 22;9(3):e24465. doi: 10.2196/24465. JMIR Mhealth Uhealth. 2021. PMID: 33749612 Free PMC article.
-
Applications of machine learning algorithms to predict therapeutic outcomes in depression: A meta-analysis and systematic review.J Affect Disord. 2018 Dec 1;241:519-532. doi: 10.1016/j.jad.2018.08.073. Epub 2018 Aug 14. J Affect Disord. 2018. PMID: 30153635
-
Machine Learning Methods for Predicting Postpartum Depression: Scoping Review.JMIR Ment Health. 2021 Nov 24;8(11):e29838. doi: 10.2196/29838. JMIR Ment Health. 2021. PMID: 34822337 Free PMC article.
Cited by
-
A bayesian network model for neurocognitive disorders digital screening in Chinese population: development and validation study.BMC Psychiatry. 2025 Aug 4;25(1):760. doi: 10.1186/s12888-025-07189-1. BMC Psychiatry. 2025. PMID: 40760482 Free PMC article.
-
Artificial intelligence in mental health care: a systematic review of diagnosis, monitoring, and intervention applications.Psychol Med. 2025 Feb 6;55:e18. doi: 10.1017/S0033291724003295. Psychol Med. 2025. PMID: 39911020 Free PMC article.
References
-
- Lopes CS, Hellwig N, E Silva GA, Menezes PR. Inequities in access to depression treatment: results of the Brazilian National Health Survey - PNS. Int J Equity Health. 2016 Nov 17;15(1):154. doi: 10.1186/s12939-016-0446-1. https://equityhealthj.biomedcentral.com/articles/10.1186/s12939-016-0446-1 10.1186/s12939-016-0446-1 - DOI - DOI - PMC - PubMed
-
- Kroenke K, Spitzer RL, Williams JB. The PHQ-9: validity of a brief depression severity measure. J Gen Intern Med. 2001 Sep;16(9):606–13. doi: 10.1046/j.1525-1497.2001.016009606.x. https://europepmc.org/abstract/MED/11556941 jgi01114 - DOI - PMC - PubMed
-
- Squires M, Tao X, Elangovan S, Gururajan R, Zhou X, Acharya UR, Li Y. Deep learning and machine learning in psychiatry: a survey of current progress in depression detection, diagnosis and treatment. Brain Inform. 2023 Apr 24;10(1):10. doi: 10.1186/s40708-023-00188-6. https://link.springer.com/article/10.1186/s40708-023-00188-6 10.1186/s40708-023-00188-6 - DOI - DOI - PMC - PubMed
-
- Zavlis O, Matheou A, Bentall R. Identifying the bridge between depression and mania: a machine learning and network approach to bipolar disorder. Bipolar Disord. 2023 Nov;25(7):571–82. doi: 10.1111/bdi.13316. https://eprints.whiterose.ac.uk/197501/ - DOI - PubMed
MeSH terms
LinkOut - more resources
Full Text Sources
Medical
