. 2024 Sep:75:103261.
doi: 10.1016/j.redox.2024.103261. Epub 2024 Jun 28.

Mutant Nrf2E79Q enhances the promotion and progression of a subset of oncogenic Ras keratinocytes and skin tumors

Affiliations

Mutant Nrf2E79Q enhances the promotion and progression of a subset of oncogenic Ras keratinocytes and skin tumors

John G Witherspoon et al. Redox Biol. 2024 Sep.

Abstract

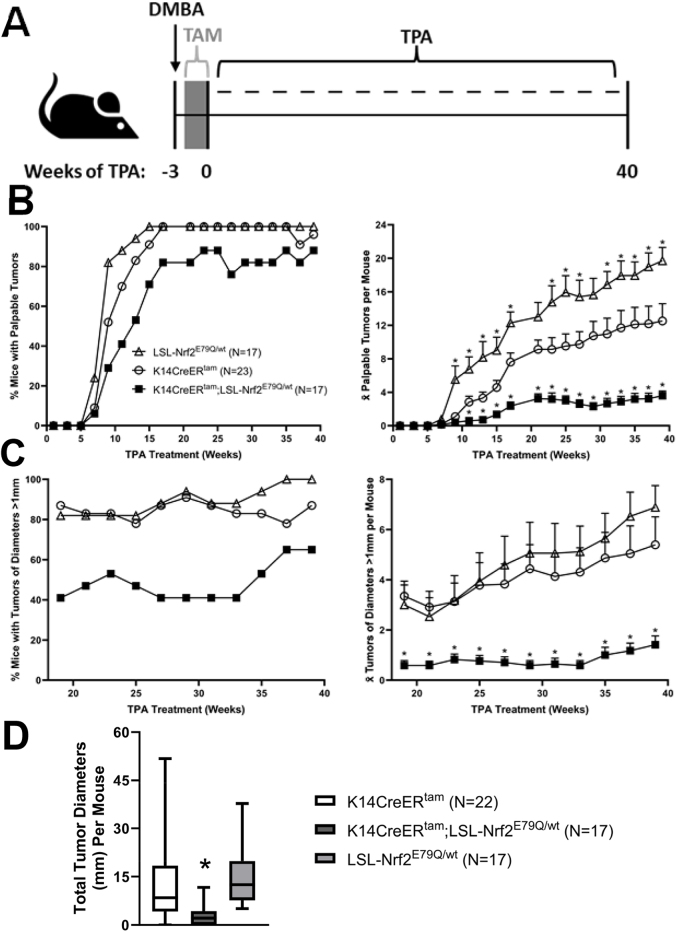
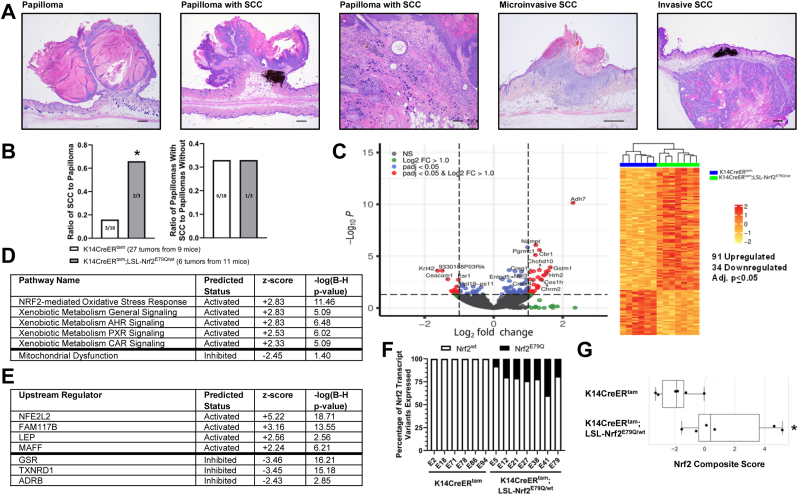
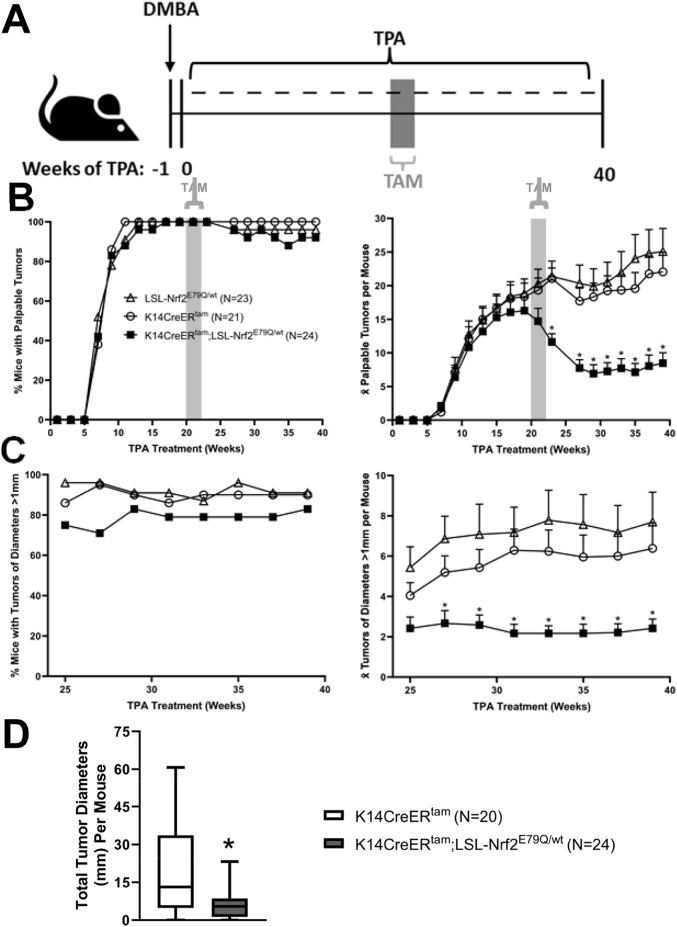
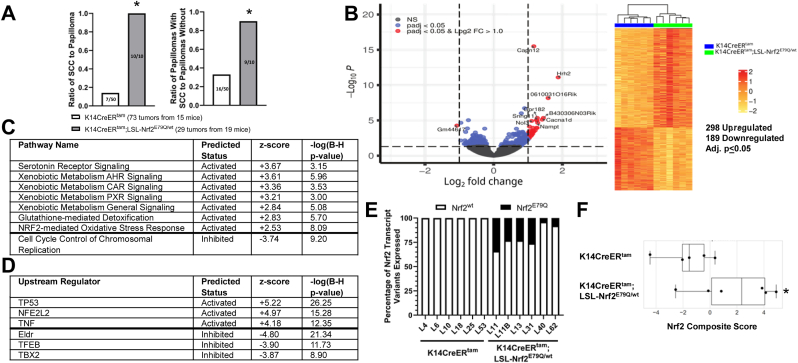
Squamous cell carcinomas (SCCs), including lung, head & neck, bladder, and skin SCCs often display constitutive activation of the KEAP1-NRF2 pathway. Constitutive activation is achieved through multiple mechanisms, including activating mutations in NFE2L2 (NRF2). To determine the functional consequences of Nrf2 activation on skin SCC development, we assessed the effects of mutant Nrf2E79Q expression, one of the most common activating mutations in human SCCs, on tumor promotion and progression in the mouse skin multistage carcinogenesis model using a DMBA-initiation/TPA-promotion protocol where the Hras A->T mutation (Q61L) is the canonical driver mutation. Nrf2E79Q expression was temporally and conditionally activated in the epidermis at two stages of tumor development: 1) after DMBA initiation in the epidermis but before cutaneous tumor development and 2) in pre-existing DMBA-initiated/TPA-promoted squamous papillomas. Expression of Nrf2E79Q in the epidermis after DMBA initiation but before tumor occurrence inhibited the development/promotion of 70% of squamous papillomas. However, the remaining papillomas often displayed non-canonical Hras and Kras mutations and enhanced progression to SCCs compared to control mice expressing wildtype Nrf2. Nrf2E79Q expression in pre-existing tumors caused rapid regression of 60% of papillomas. The remaining papillomas displayed the expected canonical Hras A->T mutation (Q61L) and enhanced progression to SCCs. These results demonstrate that mutant Nrf2E79Q enhances the promotion and progression of a subset of skin tumors and alters the frequency and diversity of oncogenic Ras mutations when expressed early after initiation.

Keywords: Cancer; Conversion; KEAP1; Mouse skin multistage carcinogenesis model; NFE2L2; Nrf2; Papilloma; Progression; Promotion; Proteomics; RNAseq; Ras; Squamous cell carcinoma.


Conflict of interest statement

Declaration of competing interest All authors have declared they have no competing interests.

Figures

Image 1
Graphical abstract
Fig. 1
Fig. 1
The K14CreERtam;LSL-Nrf2E79Q/wt mouse is a tractable system to study Nrf2E79Q activation in tumor development and progression. (A) TMX-treated K14CreERtam;LSL-Nrf2E79Q/wt mice display Cre-mediated recombination of LSL-Nrf2E79Q. (B) Volcano Plot and heatmap of epidermal RNAseq data show altered gene expression in TMX-treated K14CreERtam;LSL-Nrf2E79Q/wt mice when compared to the TMX-treated K14CreERtam mice. Each column represents epidermis from a single mouse. (C) Tamoxifen treated K14CreERtam;LSL-Nrf2E79Q/wt epidermis expresses Nrf2E79Q transcripts. Each bar represents a single mouse. (D) Volcano plot and heatmap of epidermal RNAseq data show altered gene expression in CDDO-Me treated K14CreERtam mice compared to vehicle (DMSO) K14CreERtam mice. Each column represents a single mouse. (E) IPA pathway analysis of RNAseq data reveals, of the significantly enriched pathways, the top pathways predicted to be activated (z-score ≥2.0 are predicted to be activated) in epidermis of TMX-treated K14CreERtam;LSL-Nrf2E79Q/wt mice compared to TMX-treated K14CreERtam mice. Right tailed Fisher Exact Test with Benjamini-Hochberg (B–H) multiple hypothesis testing-corrected p-value (F) IPA's upstream regulator analysis of RNAseq data reveals top upstream transcription regulators, upstream regulators with z-scores ≥2.0 are predicted to be activated and upstream regulators with z-scores ≤ −2.0 are predicted to be inhibited based on observed gene expression changes in epidermis of TMX-treated K14CreERtam;LSL-Nrf2E79Q/wt mice compared to TMX-treated K14CreERtam mice. Right tailed Fisher Exact Test with Benjamini-Hochberg (B–H) multiple hypothesis testing-corrected p-value.
Fig. 2
Fig. 2
Activation of Nrf2E79Q expression after DMBA treatment but before tumor development decreases tumor development. (A) K14CreERtam, K14CreERtam;LSL-Nrf2E79Q/wt and LSL-Nrf2E79Q/wt mice were initiated with a single topical application of 200 nmol DMBA. One week later the mice were dosed with 2.5 mg TMX i.p. once a day, 5 days a week for two weeks. One week after the cessation of TMX treatment the mice were promoted with 10 nmol TPA thrice weekly for 40 weeks. Tumors were measured and counted every two weeks during TPA promotion. After 40 weeks of promotion tumors and whole epidermis were collected for histological, protein, and RNA analysis. (B) The incidence and average number of all palpable skin tumors per mouse according to genotype. K14CreERtam;LSL-Nrf2E79Q/wt mice had significantly less tumors than K14CreERtam (p ≤ 0.05). LSL-Nrf2E79Q/wt mice had significantly more tumors than K14CreERtam (p ≤ 0.05). * Denotes p ≤ 0.05 Student's t-test. (C) The incidence and average number of skin tumors >1 mm3 per mouse according to genotype. K14CreERtam;LSL-Nrf2E79Q/wt mice had significantly less tumors than K14CreERtam (p ≤ 0.05). LSL-Nrf2E79Q/wt mice did not have significantly more tumors than K14CreERtam. *Denotes p ≤ 0.05 Student's t-test. (D) Diameters of skin tumors ≥1 mm per mouse were measured at 39 weeks and grouped according to genotype. The tumor diameters of K14CreERtam;LSL-Nrf2E79Q/wt mice were significantly less than K14CreERtam and LSL-Nrf2E79Q/wt mice. *Denotes p ≤ 0.05 Student's t-test.
Fig. 3
Fig. 3
Tumors with Nrf2E79Q activated post-DMBA display increased tumor progression and enriched Nrf2 target gene expression. (A) Representative examples of an H&E-stained papilloma, papilloma with an area of SCC, micro-invasive SCC and invasive SCC. The scale bars are equal to 500um (papilloma, papilloma with SCC, microinvasive SCC and invasive SCC) and 250um (100× original magnification of papilloma with SCC) (B) Ratio of SCC to papilloma and ratio of papilloma with SCC to papilloma analyzed from tumors collected from 9 K14CreERtam and 11 K14CreERtam;LSL-Nrf2E79Q/wt mice. * Denotes p = 0.13 Fisher's Exact Test and p = 0.08 Risk Difference. (C) Volcano plot and heatmap of tumor RNAseq data from K14CreERtam;LSL-Nrf2E79Q/wt skin tumors compared to K14CreERtam skin tumors. Each column represents a tumor from a different mouse. (D) IPA pathway analysis of RNAseq data reveals, of the significantly enriched pathways, the top pathways predicted to be activated (z-score ≥2.0 are predicted to be activated) and pathways predicted to be inhibited (z-score ≤2.0) in K14CreERtam;LSL-Nrf2E79Q/wt skin tumors compared to K14CreERtam skin tumors. Right tailed Fisher Exact Test with Benjamini-Hochberg (B–H) multiple hypothesis testing-corrected p-value (E) IPA's upstream regulator analysis of RNAseq data reveals top upstream transcription regulators, upstream regulators with z-scores ≥2.0 are predicted to be activated and upstream regulators with z-scores ≤2.0 are predicted to be inhibited based on observed gene expression changes in tumors of K14CreERtam;LSL-Nrf2E79Q/wt mice compared to K14CreERtam mice. Right tailed Fisher Exact Test with Benjamini-Hochberg (B–H) multiple hypothesis testing-corrected p-value (F) Tumors from K14CreERtam;LSL-Nrf2E79Q/wt epidermis expresses Nrf2E79Q transcripts. Each bar represents a tumor from a different mouse. (G) OIS-PRM targeted proteomics showed a significant increase in the Nrf2 score in tumors from K14CreERtam;LSL-Nrf2E79Q/wt mice compared to tumors from K14CreERtam mice. * denotes p ≤ 0.05 via Mann-Whitney U test.
Fig. 4
Fig. 4
Nrf2E79Q activation in pre-existing tumors causes tumor regression. (A) K14CreERtam, K14CreERtam;LSL-Nrf2E79Q/wt and LSL-Nrf2E79Q/wt mice were initiated with a single topical application of 200 nmol DMBA. One week later the mice were promoted with 10 nmol TPA thrice weekly for 40 weeks. After 20 weeks of TPA promotion the mice were dosed with 2.5 mg TMX i.p. once a day, 5 days a week for two weeks while continuing TPA promotion. Tumors were measured and counted every two weeks during TPA promotion. After 40 weeks of promotion tumors and whole epidermis were collected for histological, protein, and RNA analysis. (B) The incidence and average number of palpable skin tumors per mouse according to genotype. K14CreERtam;LSL-Nrf2E79Q/wt mice had significantly less tumors than K14CreERtam mice. LSL-Nrf2E79Q/wt mice did not have significantly more tumors than K14CreERtam. *Denotes p ≤ 0.05 Student's t-test. (C) The incidence and average number of skin tumors >1 mm3 per mouse according to genotype. K14CreERtam;LSL-Nrf2E79Q/wt mice had significantly less tumors than K14CreERtam mice. LSL-Nrf2E79Q/wt mice did not have significantly more tumors than K14CreERtam. *Denotes p ≤ 0.05 Student's t-test. (D) Diameters of skin tumors >1 mm3 per mouse were measured and grouped according to genotype. K14CreERtam;LSL-Nrf2E79Q/wt mice had significantly less sum tumor diameter than K14CreERtam mice *Denotes p ≤ 0.05 Student's t-test.
Fig. 5
Fig. 5
Remaining Nrf2E79Q activated tumors display enhanced progression and enrichment of Nrf2 target gene expression. (A) Ratio of SCC to papilloma and ratio of papilloma with SCC to papilloma from tumors collected from 15 K14CreERtam and 19 K14CreERtam;LSL-Nrf2E79Q/wt mice as determined by H&E histological analysis. * Denotes p ≤ 0.05 Fisher's Exact Test and p ≤ 0.05 Risk Difference. (B) Volcano plot and heatmap of tumor RNAseq data from K14CreERtam;LSL-Nrf2E79Q/wt skin tumors compared to K14CreERtam skin tumors. Each column represents a tumor from a different mouse. (C) IPA pathway analysis of RNAseq data reveals, of the significantly enriched pathways, the top pathways predicted to be activated (z-score ≥2.0) and pathways predicted to be inhibited (z-score ≤2.0) in K14CreERtam;LSL-Nrf2E79Q/wt skin tumors compared to K14CreERtam skin tumors. Right tailed Fisher Exact Test with Benjamini-Hochberg (B–H) multiple hypothesis testing-corrected p-value (D) IPA's upstream regulator analysis of RNAseq data reveals top upstream transcription regulators, upstream regulators with z-scores ≥2.0 are predicted to be activated and upstream regulators with z-scores ≤2.0 are predicted to be inhibited based on observed gene expression changes in tumors of K14CreERtam;LSL-Nrf2E79Q/wt mice compared to K14CreERtam mice. Right tailed Fisher Exact Test with Benjamini-Hochberg (B–H) multiple hypothesis testing-corrected p-value (E) Tumors from K14CreERtam;LSL-Nrf2E79Q/wt epidermis expresses Nrf2E79Q transcripts. Each bar represents a tumor from a different mouse. (F) OIS-PRM targeted proteomics showed an increase in the Nrf2 score in tumors from K14CreERtam;LSL-Nrf2E79Q/wt mice compared to tumors from K14CreERtam mice. * Denotes p = 0.08 via Mann-Whitney U test.
Fig. 6
Fig. 6
Nrf2E79Q activation early after DMBA increases the frequency of non-signature H and KRas mutations in tumors. (A) Presence of mutant Ras transcripts in 6 K14CreERtam and 7 K14CreERtam;LSL-Nrf2E79Q/wt skin tumors of early TMX treated mice collected for RNAseq. HrasQ61L mutations were significantly altered in the K14CreERtam;LSL-Nrf2E79Q/wt mice. *Denotes p ≤ 0.05 Fisher's Exact Test. (B) Percentage of the specific mutated Ras isoform mRNA and it's wild type isoform mRNA for each tumor in Fig. 6A. (C) Presence of mutant Ras transcripts in 6 K14CreERtam and 6 K14CreERtam;LSL-Nrf2E79Q/wt skin tumors of late TNX treated mice collected for RNAseq. (D) Percentage of the specific mutated Ras isoform mRNA and it's wild type isoform mRNA for each tumor in Fig. 6C.

References

    1. Baird L., Yamamoto M. The molecular mechanisms regulating the KEAP1-NRF2 pathway. Mol. Cell Biol. 2020;40(13) - PMC - PubMed
    1. Cloer E.W., Goldfarb D., Schrank T.P., Weissman B.E., Major M.B. NRF2 activation in cancer: from DNA to protein. Cancer Res. 2019;79(5):889–898. - PMC - PubMed
    1. Tonelli C., Chio I.I.C., Tuveson D.A. Transcriptional regulation by Nrf2. Antioxidants Redox Signal. 2018;29(17):1727–1745. - PMC - PubMed
    1. Kobayashi A., Kang M.I., Okawa H., Ohtsuji M., Zenke Y., Chiba T., et al. Oxidative stress sensor Keap1 functions as an adaptor for Cul3-based E3 ligase to regulate proteasomal degradation of Nrf2. Mol. Cell Biol. 2004;24(16):7130–7139. - PMC - PubMed
    1. Itoh K., Chiba T., Takahashi S., Ishii T., Igarashi K., Katoh Y., et al. An Nrf2/small Maf heterodimer mediates the induction of phase II detoxifying enzyme genes through antioxidant response elements. Biochem. Biophys. Res. Commun. 1997;236(2):313–322. - PubMed

MeSH terms

Substances

LinkOut - more resources