

Comprehensive investigation in oncogenic functions and immunological roles of NCBP2 and its validation in prostate cancer
- PMID: 38964031
- PMCID: PMC11283080
- DOI: 10.1016/j.tranon.2024.102049
Comprehensive investigation in oncogenic functions and immunological roles of NCBP2 and its validation in prostate cancer
Abstract
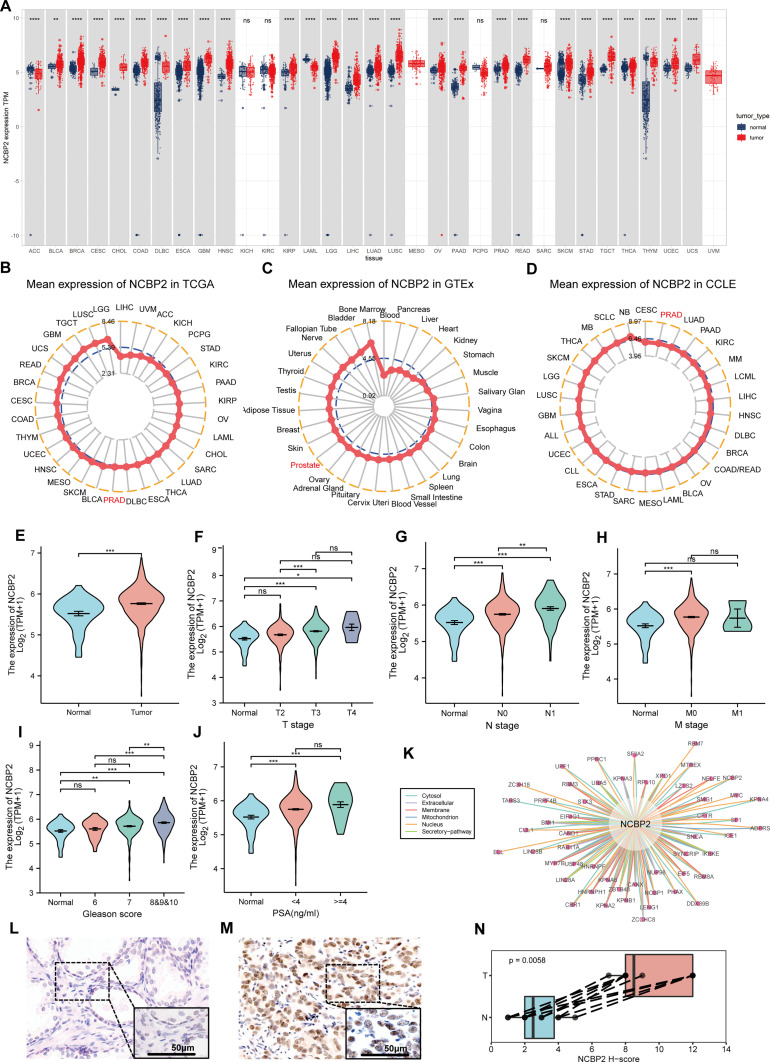
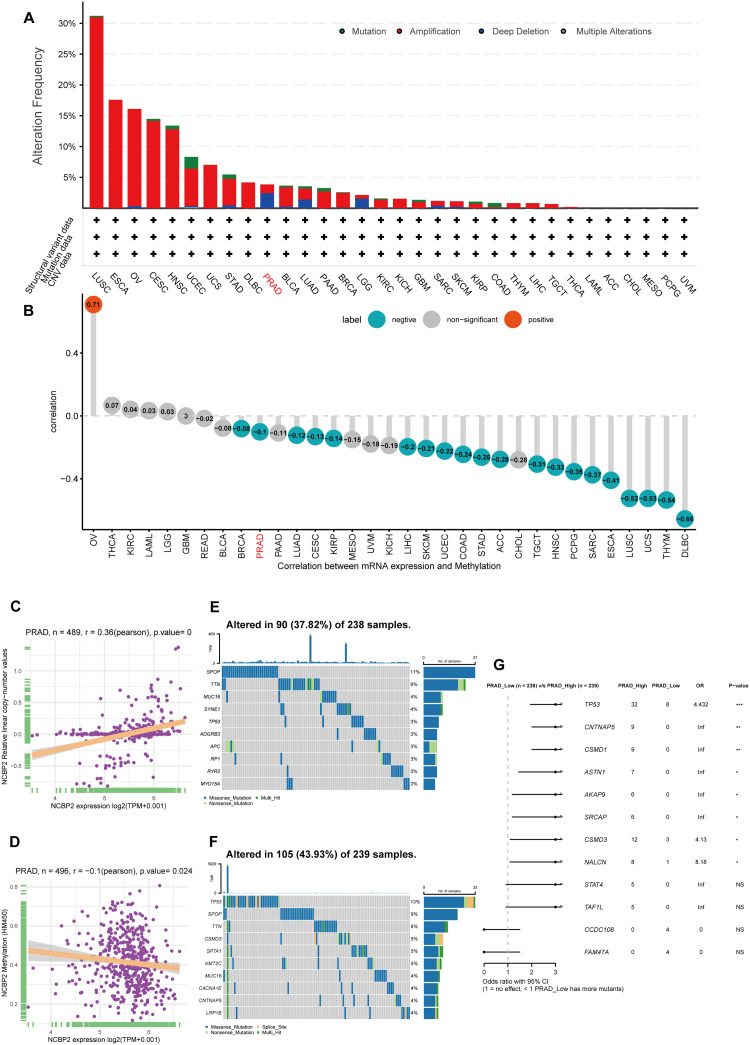
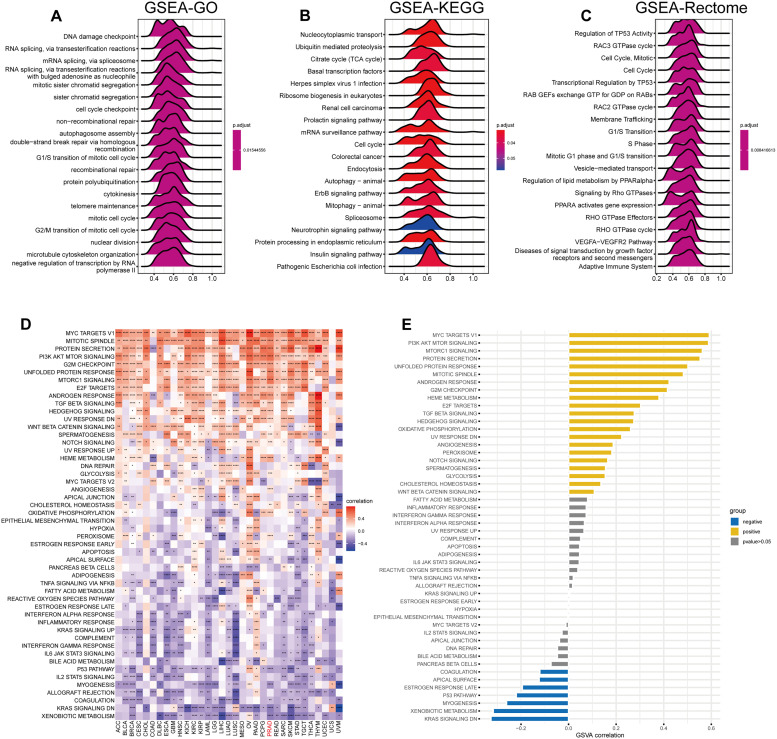
Background: Nuclear cap-binding protein 2 (NCBP2), as the component of the cap-binding complex, participates in a number of biological processes, including pre-mRNA splicing, transcript export, translation regulation and other gene expression steps. However, the role of NCBP2 on the tumor cells and immune microenvironment remains unclear. To systematically analyze and validate functions of NCBP2, we performed a pan-cancer analysis using multiple approaches.
Methods: The data in this study were derived from sequencing, mutation, and methylation data in the TCGA cohort, normal sample sequencing data in the GTEx project, and cell line expression profile data in the CCLE database.
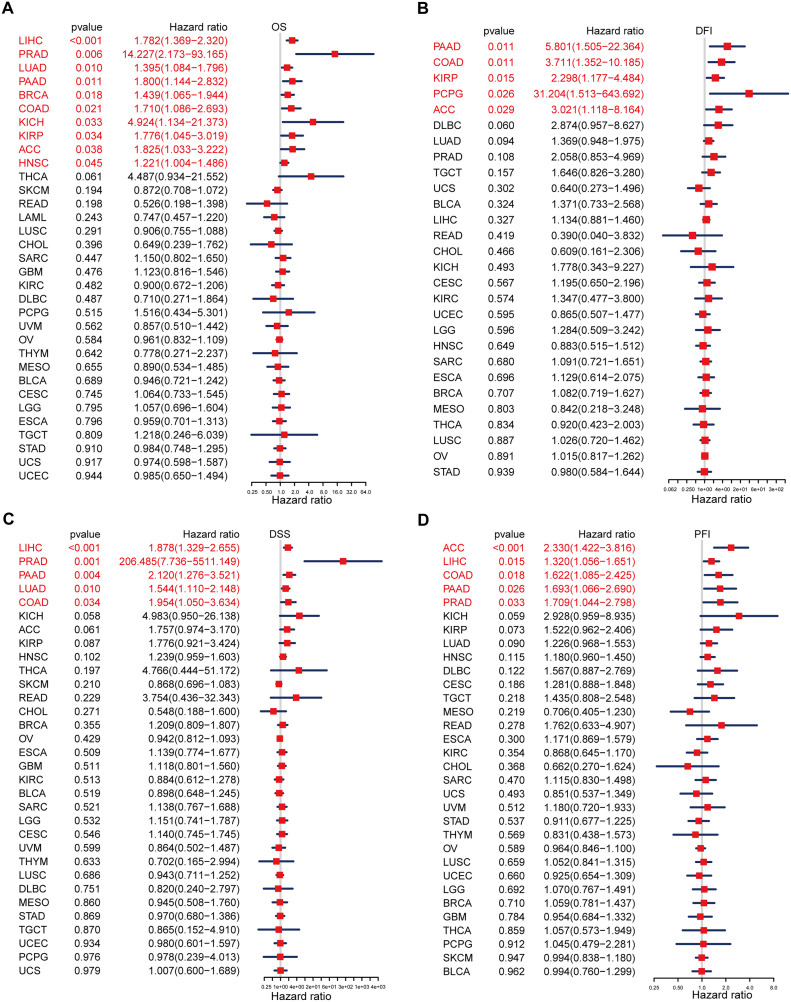
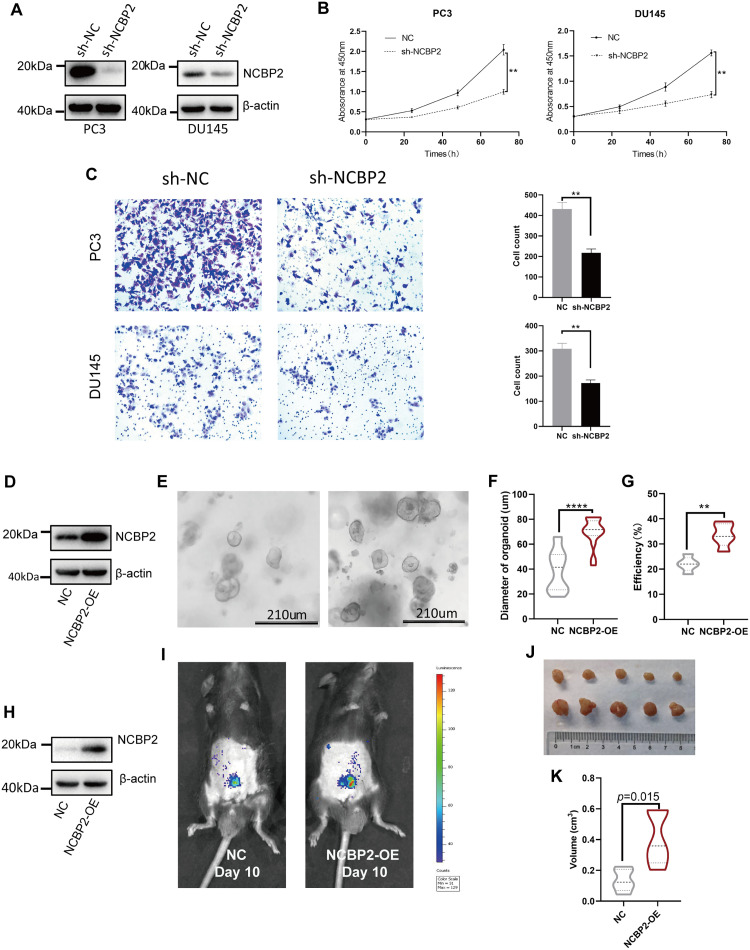
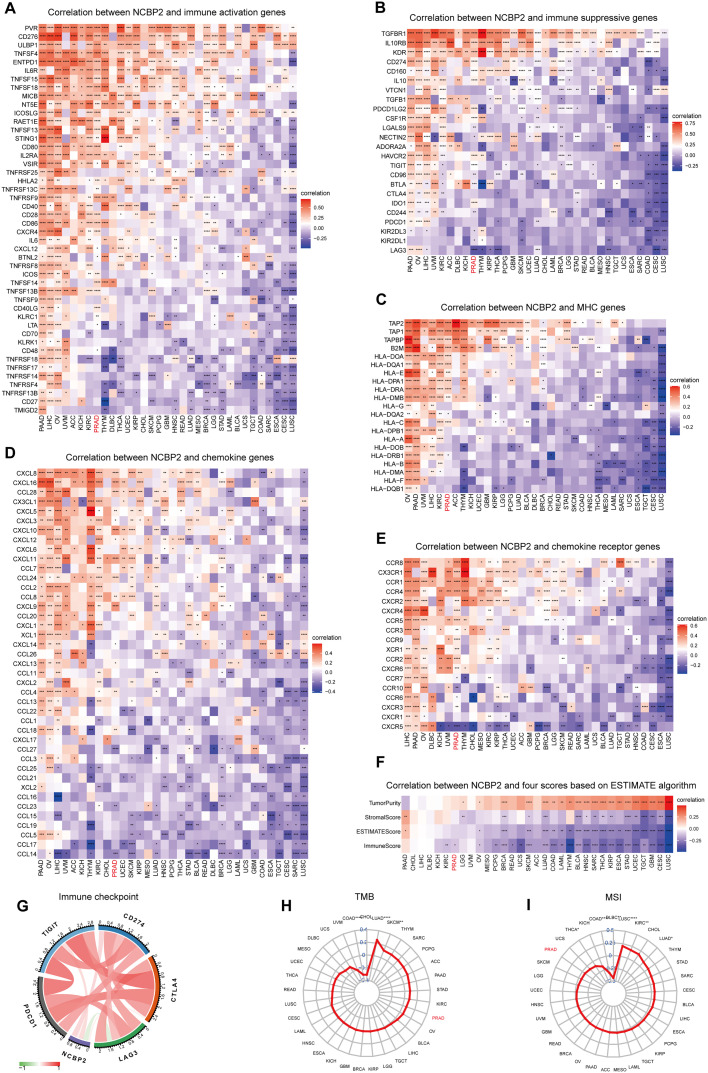
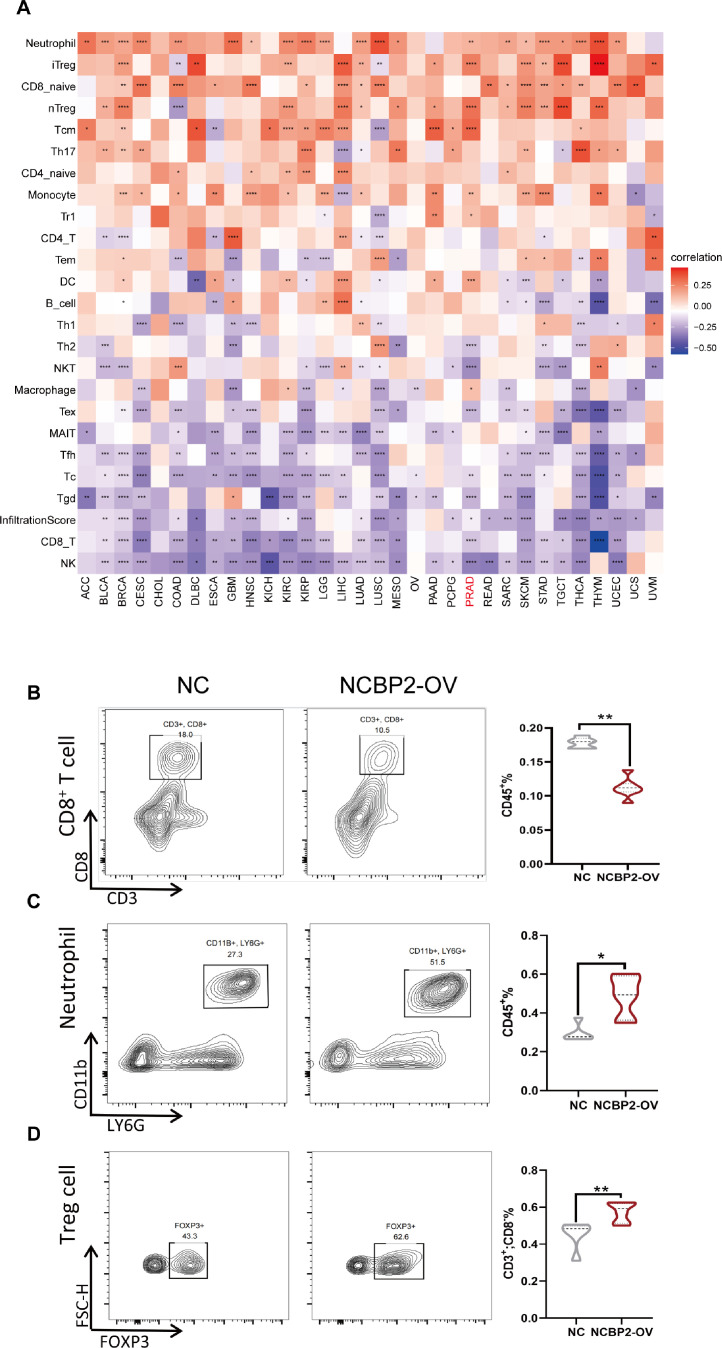
Results: Survival analyses including the Cox proportional-hazards model and log-rank test revealed the poor prognostic role of NCBP2 in multiple tumors. We further validated the oncogenic ability of NCBP2 in prostate cancer cell lines, organoids and tumor-bearing mice. A negative correlation was observed between NCBP2 expression and immune score by the ESTIMATE algorithm. Simultaneously, the NCBP2-induced immunosuppressive microenvironment might be related to the decline in CD8+T cells and the increase in regulatory T cells and neutrophils, examined by flow cytometry experiments for NCBP2 overexpressed tumor-bearing mice.
Conclusion: This research offered strong proof supporting NCBP2 as the prognostic marker and the therapeutic target in the future.
Keywords: NCBP2; Pan-cancer; Prognosis; Prostate cancer; Therapeutic target; Tumor microenvironment.
Copyright © 2024. Published by Elsevier Inc.
Conflict of interest statement
Declaration of competing interest The authors declare that they have no known competing financial interests or personal relationships that could have appeared to influence the work reported in this paper.
Figures
Similar articles
-
NCBP2 predicts the prognosis and the immunotherapy response of cancers: a pan-cancer analysis.PeerJ. 2025 Mar 20;13:e19050. doi: 10.7717/peerj.19050. eCollection 2025. PeerJ. 2025. PMID: 40124611 Free PMC article.
-
Diagnostic and prognostic potential of the novel biomarker nuclear cap binding protein subunit 2 (NCBP2) in colon adenocarcinoma.J Gastrointest Oncol. 2022 Aug;13(4):1782-1792. doi: 10.21037/jgo-22-665. J Gastrointest Oncol. 2022. PMID: 36092349 Free PMC article.
-
The m7G Reader NCBP2 Promotes Pancreatic Cancer Progression by Upregulating MAPK/ERK Signaling.Cancers (Basel). 2023 Nov 17;15(22):5454. doi: 10.3390/cancers15225454. Cancers (Basel). 2023. PMID: 38001714 Free PMC article.
-
NCBP2 and TFRC are novel prognostic biomarkers in oral squamous cell carcinoma.Cancer Gene Ther. 2023 May;30(5):752-765. doi: 10.1038/s41417-022-00578-8. Epub 2023 Jan 12. Cancer Gene Ther. 2023. PMID: 36635327 Free PMC article.
-
Oncogenic and immunological values of RBM34 in osteosarcoma and its pan-cancer analysis.Am J Cancer Res. 2023 Nov 15;13(11):5094-5121. eCollection 2023. Am J Cancer Res. 2023. PMID: 38058813 Free PMC article.
Cited by
-
CLEC3B as a Prognostic and Immunological Biomarker in Pan-Cancer: Multi-Omics Profiling and Validation in Pancreatic Cancer and Exosomes.J Inflamm Res. 2025 May 19;18:6381-6396. doi: 10.2147/JIR.S517595. eCollection 2025. J Inflamm Res. 2025. PMID: 40416711 Free PMC article.
-
Bolstering CD8+ T Cells' Antitumor Immunity: A Promising Strategy to Improve the Response to Advanced Prostate Cancer Treatment.Biology (Basel). 2025 May 14;14(5):544. doi: 10.3390/biology14050544. Biology (Basel). 2025. PMID: 40427733 Free PMC article. Review.
References
-
- Hanahan D. Hallmarks of cancer: new dimensions. Cancer Discov. 2022;12(1):31–46. - PubMed
-
- Siegel R.L., Miller K.D., Fuchs H.E., Jemal A. Cancer statistics, 2022. CA Cancer J. Clin. 2022;72(1):7–33. - PubMed
-
- Sung H., Ferlay J., Siegel R.L., Laversanne M., Soerjomataram I., Jemal A., Bray F. Global Cancer Statistics 2020: GLOBOCAN estimates of incidence and mortality worldwide for 36 cancers in 185 countries. CA Cancer J. Clin. 2021;71(3):209–249. - PubMed
-
- Santucci C., Carioli G., Bertuccio P., Malvezzi M., Pastorino U., Boffetta P., Negri E., Bosetti C., La Vecchia C. Progress in cancer mortality, incidence, and survival: a global overview. Eur. J. Cancer Prev. 2020;29(5):367–381. - PubMed
LinkOut - more resources
Full Text Sources
Research Materials
Miscellaneous
