. 2024 Aug 28:598:217089.
doi: 10.1016/j.canlet.2024.217089. Epub 2024 Jul 2.

A genome-wide CRISPR screen reveals that antagonism of glutamine metabolism sensitizes head and neck squamous cell carcinoma to ferroptotic cell death

Affiliations

A genome-wide CRISPR screen reveals that antagonism of glutamine metabolism sensitizes head and neck squamous cell carcinoma to ferroptotic cell death

Michael M Allevato et al. Cancer Lett. .

Abstract

Glutamine is a conditionally essential amino acid for the growth and survival of rapidly proliferating cancer cells. Many cancers are addicted to glutamine, and as a result, targeting glutamine metabolism has been explored clinically as a therapeutic approach. Glutamine-catalyzing enzymes are highly expressed in primary and metastatic head and neck squamous cell carcinoma (HNSCC). However, the nature of the glutamine-associated pathways in this aggressive cancer type has not been elucidated. Here, we explored the therapeutic potential of a broad glutamine antagonist, DRP-104 (sirpiglenastat), in HNSCC tumors and aimed at shedding light on glutamine-dependent pathways in this disease. We observed a potent antitumoral effect of sirpiglenastat in HPV- and HPV + HNSCC xenografts. We conducted a whole-genome CRISPR screen and metabolomics analyses to identify mechanisms of sensitivity and resistance to glutamine metabolism blockade. These approaches revealed that glutamine metabolism blockade results in the rapid buildup of polyunsaturated fatty acids (PUFAs) via autophagy nutrient-sensing pathways. Finally, our analysis demonstrated that GPX4 mediates the protection of HNSCC cells from accumulating toxic lipid peroxides; hence, glutamine blockade sensitizes HNSCC cells to ferroptosis cell death upon GPX4 inhibition. These findings demonstrate the therapeutic potential of sirpiglenastat in HNSCC and establish a novel link between glutamine metabolism and ferroptosis, which may be uniquely translated into targeted glutamine-ferroptosis combination therapies.

Keywords: Autophagy; Ferroptosis; Glutamine; Head and neck squamous cell carcinoma; Poly-unsaturated fatty acids; Precision medicine; Targeted therapy.


Conflict of interest statement

Declaration of competing interest The authors declare the following financial interests/personal relationships which may be considered as potential competing interests: Robert Wild and Yumi Yokoyama are stockholders of Dracen Pharmaceuticals. Robert Wild reports consulting fees from Dracen Pharmaceuticals. J. Silvio Gutkind reports consulting fees from Domain Pharmaceuticals, Pangea Therapeutics, and io9 and is the founder of Kadima Pharmaceuticals, all unrelated to the current study. Daniela Nachmanson is an employee of TwinStrand Biosciences. Olivier Harismendy is a current employee and shareholder of Zentalis Pharmaceuticals. All other authors declare no potential conflicts of interest.

Figures

Figure 1.
Figure 1.. Effects of glutamine metabolism antagonism on HNSCC tumorigenesis.
A. Representative HNSCC cells (CAL33, CAL27, UDSCC2, and UMSCC47) were treated with the indicated concentrations of DON or DRP104 for 72 hours. Live cell number was normalized with the corresponding vehicle control (0.1% DMSO)-treated cells. Driver gene alterations are highlighted in red. B. HNSCC cells were treated with vehicle control (0.1% DMSO) or DON (3 and 10 μM). Wells were imaged, and the size/number of spheres was quantified via QuPath. Representative spheres obtained are displayed on the right. C. Corresponding cell lines were transplanted into NSG mice and treated subcutaneously with vehicle control diluent or DRP-104 (3 mg/kg) once daily 5 days-ON + 2days OFF x indicated cycles. Treatment was continued for four weeks. D. Lesions from corresponding xenograft studies were collected and weighed on day 35 (n=6 mice per group). Representative H&E images of the tumors are displayed on the right. E. Mice weight throughout each preclinical study. All data represent averages ± SEM, except where indicated. *P<0.05, ***P<0.001, ****P < 0.0001.
Figure 2.
Figure 2.. Glutamine metabolism blockade induces autophagocytotic accumulation of polyunsaturated fatty acids.
A. CAL33 HNSCC cells were treated with 3μM DON for 24 hours and analyzed by HILIC LC-MS. Volcano plot depicting polar molecule, eicosanoids, and other bioactive lipid species alterations in CAL33 cells; n = 4 samples per treatment group. B. Metabolite set enrichment analysis depicted sets of metabolites accumulated or depleted after glutamine metabolism blockade treatment with DON. C. CAL33 cells were treated for 24 hours with DON (3μM). Cells were fixed and stained with Hoechst (Blue), Wheat Germ Albumin (Red), and LipidTOX™ (Yellow). Intracellular accumulation of neutral lipid droplets was quantified per cell in 4 regions of interest per replicate (n=3). D. A model illustrates that in the presence of sufficient amino acids, active mTOR inhibits the initiation of autophagy and the degradation of membranous organelles that release fatty acids. E. Lysates of CAL27 and CAL33 cells treated with DON (1 and 3μM) were analyzed for indicated proteins by western blotting. F. CAL33 HNSCC cells were treated with non-targeting or ATG13-siRNA and subsequentially treated with DON (3μM) for 24 hours. Neutral lipid droplets were quantified. Cell lysates of siRNA-treated cells were analyzed for indicated proteins via western blot analysis. All data represent averages ± SD, except where indicated. ***P < 0.001.
Figure 3.
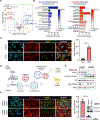
Figure 3.. A genome-wide CRISPR/Cas9 screen reveals synthetic lethal and resistance interactors of glutamine metabolism antagonism.
A. CAL33 HNSCC cells expressing Cas9 were infected with the Brunello Human CRISPR sgRNA KO library at an MOI of 0.5. After selection, cells were treated with vehicle or 0.25μM of DON until cells doubled roughly 18 times, as displayed on the right. B. Beta scores for all tested genes are shown ordered by score. Genes found to be significantly enriched or depleted are colored in shades of red based on their p-value. C. Normalized enrichment scores of top 10 enriched, and all depleted KEGG pathways in MsigDB as measured by single-sample GSEA. D. Left, top genes of interacting KEGG pathways. Beta scores represent either essential (blue) or resistant (red) genes under DON treatment. Asterisks indicate significance; ∗p < 0.05, ∗∗p < 0.01, and ∗∗∗p< 0.001. E. Graphical model depicting the interaction of peroxisome, linolenic and alpha-linoleic metabolism, and ferroptosis. PLA2 catalyzes the release of polyunsaturated fatty acids, which are metabolized by CYP2E1 into substrates for lipid peroxidation. Hydrogen peroxide produced by SOD1 can be converted into highly reactive hydroxyl radicals, enhancing lipid peroxidation and ferroptosis. This process is delicately regulated by GPX4, which uses glutathione, derived from cysteine, glycine, and glutamate, to neutralize lipid peroxides. Any imbalance in these interconnected processes can tip the scale towards ferroptosis. Essential (blue) or resistant (red) genes are highlighted by color.
Figure 4.
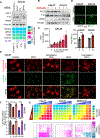
Figure 4.. Antagonism of glutamine metabolism sensitizes cells to ferroptosis.
CAL33 cells were treated with siRNAs targeting ACLY, FTL, or GPX4 and subsequently with 3μM DON for 24 hours, followed by measurement of live cell number and determination of combination indices using ΔBLISS (score < 0 indicates synergism, score = 0 indicates additivity, score > 0 indicates antagonism, scale from −1 to +1) (A). CAL27 and CAL33 cells were treated with increasing concentrations of DON (0, 1, 3 μM) and analyzed by western blot for levels of ACLY, FTL, and GPX4 (B). ROS levels in CAL33 cells were measured using H2O2 substrate dilution buffer, and luminescence was recorded after 6 hours of treatment, showing significant increases in ROS levels with higher concentrations of DON (C). ROS levels were also measured using DCFH-DA in CAL27 and CAL33 cells treated with vehicle or 3μM DON, demonstrating increased ROS levels in DON-treated cells (D). Lipid peroxidation was analyzed in CAL27 cells treated with 3μM DON, ferrostatin-1 (1μM), and RSL3 (2μM), with cells stained for oxidized (510nm) and non-oxidized (590nm) lipids (E). Quantification of the lipid peroxidation ratio (590/510nm) in CAL27 and CAL33 cells treated with vehicle (V), 3μM DON (D), DON and ferrostatin-1 (D/F), or RSL3 and ferrostatin-1 (R/F) showed significant increases in lipid peroxidation with DON and RSL3 treatments (F). The viability of CAL27, CAL33, and UMSCC47 cells treated with various combinations of DON and RSL3 was assessed, with heatmap representation of live cell number and determination of combination indices using ΔBLISS (scale from −2 to +2) (G). All data represent averages ± SD, except where indicated. *P<0.05, *P<0.01, ***P<0.001, ****P < 0.0001. Source data are provided as a Source Data file.
Figure 5.
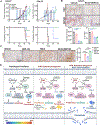
Figure 5.. Glutamine metabolism blockade and ferroptosis activation reduce HNSCC tumor growth.
A. CAL27 and CAL33 HNSCC cells were transplanted into NSG mice and treated subcutaneously with vehicle control diluent or DRP-104 (3mg/kg) five times per week for four weeks. Mice were also treated intratumorally with four doses of RSL3 or vehicle diluent. Bottom, Kaplan-Meier survival curve representing the survival of the mice in each treatment group, with a cut-off at 250mm (n=5 mice per group). B. Top, Representative immunohistochemical analysis of proliferation marker Ki67. Middle, Ki67 positive or negative nuclei identified by QuPath cell detection Bottom, quantification of total nuclei and percentage of Ki67 is displayed below. C. Immunohistochemical analysis of 4-HNE in CAL27 xenografts treated with vehicle, RSL3, DRP104, or the combination of RSL3 and DRP104, with quantification of 4-HNE positive cells presented. *P<0.05, *P<0.01, ***P<0.001, ****P < 0.0001. D. Model depicting proliferative and physiological conditions (left), glutamine-inhibition (center), and enhanced ferroptosis induction of HNSCC cells (right). Highly proliferative cells in glutamine-rich environments engage regulator pathways to inhibit autophagy and prevent the formation of toxic lipid reactive oxygen species (ROS). Disruption of glutamine metabolism in HNSCC cells leads to the inhibition of mTOR and, subsequentially, the accumulation of intracellular fatty acids through autophagy-mediated degradation of organelles. Augmented levels of polyunsaturated fatty acids and reductions of the anti-oxidant glutathione due to glutamine blockade sensitize HNSCC cells for ferroptosis-induction via RSL3.

References

    1. Siegel RL, Miller KD, Wagle NS, Jemal A, Cancer statistics, 2023, CA Cancer J Clin, 73 (2023) 17–48. - PubMed
    1. Pulte D, Brenner H, Changes in survival in head and neck cancers in the late 20th and early 21st century: a period analysis, Oncologist, 15 (2010) 994–1001. - PMC - PubMed
    1. Iglesias-Bartolome R, Martin D, Gutkind JS, Exploiting the head and neck cancer oncogenome: widespread PI3K-mTOR pathway alterations and novel molecular targets, Cancer Discov, 3 (2013) 722–725. - PMC - PubMed
    1. Lui VW, Hedberg ML, Li H, Vangara BS, Pendleton K, Zeng Y, Lu Y, Zhang Q, Du Y, Gilbert BR, Freilino M, Sauerwein S, Peyser ND, Xiao D, Diergaarde B, Wang L, Chiosea S, Seethala R, Johnson JT, Kim S, Duvvuri U, Ferris RL, Romkes M, Nukui T, Kwok-Shing Ng P, Garraway LA, Hammerman PS, Mills GB, Grandis JR, Frequent mutation of the PI3K pathway in head and neck cancer defines predictive biomarkers, Cancer Discov, 3 (2013) 761–769. - PMC - PubMed
    1. Cancer Genome Atlas N, Comprehensive genomic characterization of head and neck squamous cell carcinomas, Nature, 517 (2015) 576–582. - PMC - PubMed

MeSH terms