. 2024 Jul 4;15(1):5609.
doi: 10.1038/s41467-024-49941-3.

A pH-sensitive closed-loop nanomachine to control hyperexcitability at the single neuron level

Affiliations

A pH-sensitive closed-loop nanomachine to control hyperexcitability at the single neuron level

Assunta Merolla et al. Nat Commun. .

Abstract

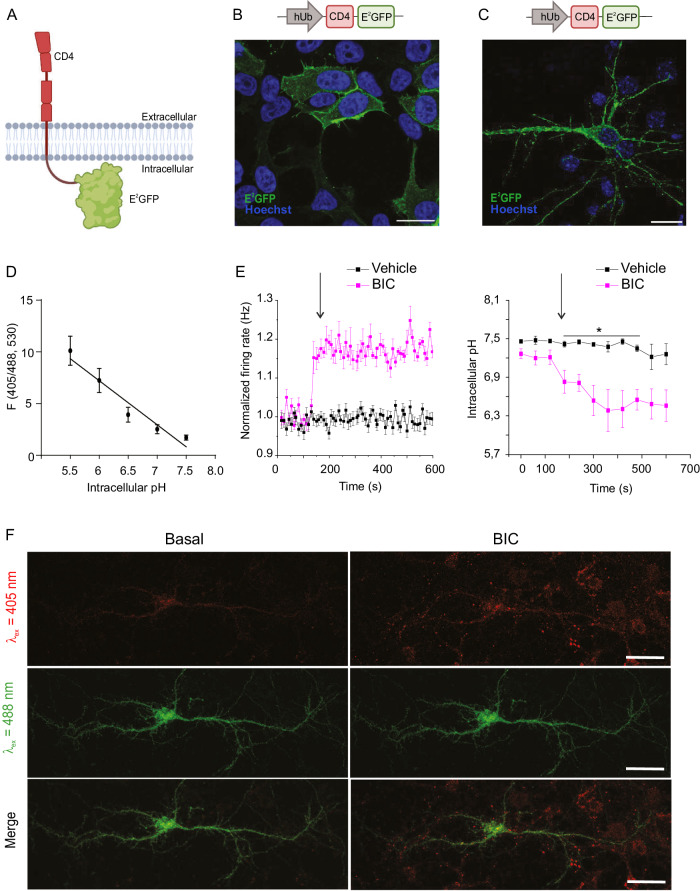
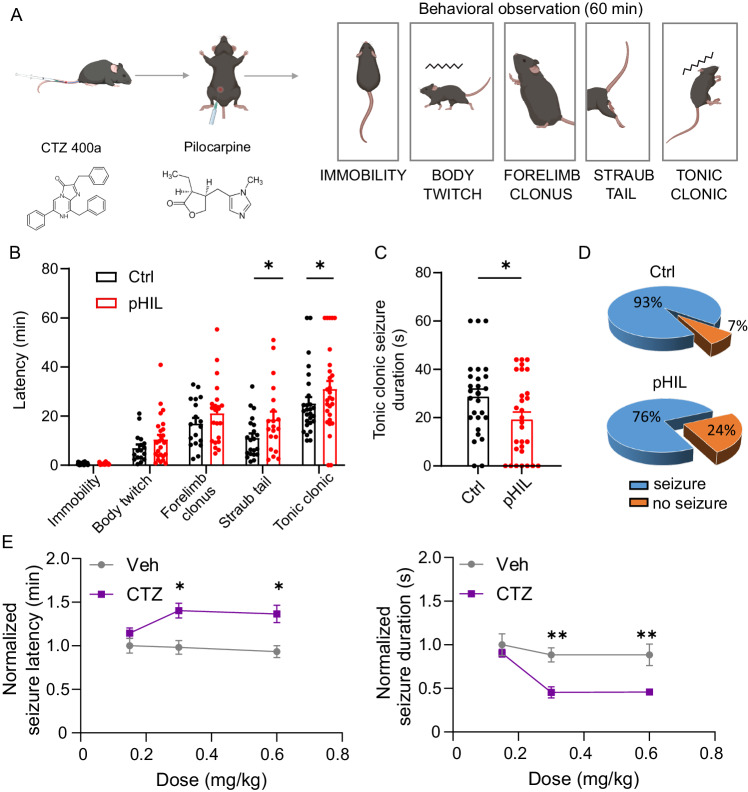
Epilepsy affects 1% of the general population and 30% of patients are resistant to antiepileptic drugs. Although optogenetics is an efficient antiepileptic strategy, the difficulty of illuminating deep brain areas poses translational challenges. Thus, the search of alternative light sources is strongly needed. Here, we develop pH-sensitive inhibitory luminopsin (pHIL), a closed-loop chemo-optogenetic nanomachine composed of a luciferase-based light generator, a fluorescent sensor of intracellular pH (E2GFP), and an optogenetic actuator (halorhodopsin) for silencing neuronal activity. Stimulated by coelenterazine, pHIL experiences bioluminescence resonance energy transfer between luciferase and E2GFP which, under conditions of acidic pH, activates halorhodopsin. In primary neurons, pHIL senses the intracellular pH drop associated with hyperactivity and optogenetically aborts paroxysmal activity elicited by the administration of convulsants. The expression of pHIL in hippocampal pyramidal neurons is effective in decreasing duration and increasing latency of pilocarpine-induced tonic-clonic seizures upon in vivo coelenterazine administration, without affecting higher brain functions. The same treatment is effective in markedly decreasing seizure manifestations in a murine model of genetic epilepsy. The results indicate that pHIL represents a potentially promising closed-loop chemo-optogenetic strategy to treat drug-refractory epilepsy.


Conflict of interest statement

The authors declare no competing interests.

Figures

Fig. 1
Fig. 1. Intracellularly expressed E2GFP sensor reveals the buildup of intracellular acidosis upon sustained hyperactivity in primary hippocampal neurons.
A Schematic illustration of the structure and membrane topology of the CD4-E2GFP intracellular pH sensor (Created with BioRender.com released under a Creative Commons Attribution-NonCommercial-NoDerivs 4.0 International license (https://creativecommons.org/licenses/by-nc-nd/4.0/deed.en)). B, C Representative confocal images of the membrane localization of CD4-E2GFP in transfected HEK293 cells (B) and primary hippocampal neurons (C) showing E2GFP fluorescence (green) and Hoechst nuclear staining (blue). In neurons, CD4-E2GFP decorates the membranes of the soma and neurites. Scale bars, 20 μm. D Calibration curve of the ratiometric probe obtained in primary hippocampal neurons as a function of intracellular pH. Data are represented by means ± SEM (n = 6 neurons from 3 independent preparations). E Normalized firing rates of CD4-E2GFP transfected neurons cultured on MEAs in the presence (red traces) or absence (black traces) of BIC (30 μM; left) and the corresponding changes in intracellular pH (right). The intracellular pH progressively decreases in discrete spots along cell extensions as neuronal excitability increases. Data are represented by means ± SEM (n = 7 and 3 neurons for Vehicle and BIC, respectively from 2 independent preparations, two-sided Mann–Whitney U-tests, *p < 0.05). F Representative fluorescence images of neurons transfected with CD4-E2GFP obtained by E2GFP excitation (λex) at 405 nm (upper row, red), 488 nm (middle row, green), and the resulting merge images (lower row). Images were taken under basal conditions (t = 0 min, left column) and upon addition of BIC (30 μM, t = 10 min, right column). E2GFP fluorescence increases after BIC treatment upon excitation at 405 nm (upper row), but not upon excitation at 488 nm, demonstrating the proper sensitivity of the pH probe to the pharmacologically induced intracellular acidification. Scale bars, 20 μm.
Fig. 2
Fig. 2. Engineering, expression and BRET/FRET activity of the pHIL chimera.
A Schematic representation of the pHIL structure and cell membrane topology (Created with BioRender.com released under a Creative Commons Attribution-NonCommercial-NoDerivs 4.0 International license (https://creativecommons.org/licenses/by-nc-nd/4.0/deed.en)). B Representative live confocal images of membrane staining (red) and the fluorescence of E2GFP (green) showing cytoplasmic localization of Ctrl lacking NpHR (left) and the specific membrane localization of pHIL (right) in transfected HEK293 cells Scale bars, 20 μm. C Left: Representative Western blot showing Ctrl, pHIL, and RLuc8 expression in HEK293 cells using an anti-RLuc antibody. Actin immunoreactivity was used as a control of equal loading. Molecular mass markers are reported on the left. The 93, 62, and 34 kDa bands (arrowheads) correspond to pHIL, Ctrl, and RLuc8, respectively. Right: The expression of the three constructs in HEK293 cells was assessed as RLuc8/α-actin immunoreactivity ratios (n = 7 independent cell preparations, one-way ANOVA F(2,18) = 9.955 p = 0.0012, Tukey’s adjusted p values *p = 0.0161, **p = 0.011). D Left: Schematic representation of the resonant and radiative energy transfer of the BRET/FRET mechanisms in Ctrl (top) and pHIL (bottom) chimeras. Right: Representative live luminescence images of HEK293 cells transfected with either Ctrl (top) or pHIL (bottom) and brought to pH 6.0 upon administration of CTZ 400a. The images show both RLuc8 bioluminescence and the resulting E2GFP fluorescence activation (2-min integration time). Scale bar, 50 μm. E Luminescence emission spectra at pH 6 of HEK293 expressing Ctrl, pHIL, and RLuc8, peaking at 405 nm (luciferase) and 510 nm (E2GFP). Spectra were normalized to the RLuc8 emission peak. F The ratiometric emission of E2GFP was calculated at 510 nm upon excitation at 405 and 488 nm and normalized to neutral pH ratio. (n = 8 and 4 for Ctrl and pHIL, respectively from 2 cell preparations, one-way ANOVA F(3,20) = 7.199 p = 0.0018, Tukey’s adjusted p value **p = 0.0014). G The ratio between the E2GFP emissions at pH 6.0 and 7.4 shows a statistically significant decrease in pHIL-transfected HEK293 cells with respect to the controls, demonstrating how the FRET mechanism reduces radiative energy in favor of direct activation of NpHR (n = 6 independent cell preparations, unpaired two-sided Student-t test, **p = 0.0071). Bar plots depict means ± SEM with superimposed individual experimental points.
Fig. 3
Fig. 3. pHIL activation by CTZ 400a hyperpolarizes HEK293 cells.
A Left and middle: Representative image (scalebar, 20 μm) and current clamp traces from HEK293 cells expressing Ctrl and pHIL chimeras upon illumination at 530 nm. Right: Mean ± SEM hyperpolarization (ΔV) induced by excitation at 530 nm of Ctrl- and pHIL-expressing cells. The significant hyperpolarization of cells expressing pHIL demonstrates the correct activity and photoactivation of NpHR (n = 5 and 7 cells for Ctrl and pHIL respectively from 3 preparations, two-sided Mann-Whitney U-test, **p = 0.0025). B, C Current-clamp experiments on HEK293 cells transfected with pHIL upon administration of CTZ 400a (10 μM) show the marked hyperpolarization at intracellular pH 6.0. (B). Comparison of the pH-dependent hyperpolarization (means ± SEM) in HEK293 cells transfected with either Ctrl (C, left) or pHIL (C, right). A statistically significant hyperpolarization is apparent only in pHIL-expressing cells at acidic pH (n = 6, 8, 8 cells for Ctrl and n = 8, 8, 12 cells for pHIL at pH 8, 7.4 and 6, respectively from 3 preparations, Kruskal-Wallis test p < 0.0001, Kruskal-Wallis statistic=18.86, **p = 0.0017, ***p < 0.0004). D, E Current-clamp experiments on HEK293 cells transfected with pHIL upon administration of CTZh (20 μM) show no response to acidification (D). Comparison of the pH-dependent hyperpolarization (means ± SEM) in HEK293 cells transfected with either Ctrl (E, left) or pHIL (E, right), the lack of effect when E2GFP is excited at a pH-insensitive wavelength (n = 4, 4, 4 cells for Ctrl and n = 5, 6, 5 cells for pHIL at pH 8, 7.4 and 6, respectively from 3 independent preparations). Panel B and D (Created with BioRender.com released under a Creative Commons Attribution-NonCommercial-NoDerivs 4.0 International license (https://creativecommons.org/licenses/by-nc-nd/4.0/deed.en)).
Fig. 4
Fig. 4. pHIL prevents primary hippocampal neurons from hyperactivity induced by increased intrinsic excitability.
A Schematic illustration of the AAV2/1 vectors encoding pHIL and Ctrl under the CaMKIIα promoter (Created with BioRender.com released under a Creative Commons Attribution-NonCommercial-NoDerivs 4.0 International license (https://creativecommons.org/licenses/by-nc-nd/4.0/deed.en)). Transduced primary hippocampal neurons expressed both fusion proteins, as shown by Western blotting analysis using anti-GFP antibodies and anti-GAPDH antibodies as loading control. B Representative confocal images showing the cytoplasmic localization of the Ctrl probe (left) and the membrane targeting of pHIL (right) in primary neurons (E2GFP, green and Hoechst, blue). Inset: a higher magnification of the soma of the neurons highlighted with the dotted square. Scale bar, 20 μm (inset, 10 µm). C. Cell-attached voltage-clamp traces from neurons transduced with either Ctrl or pHIL in Tyrode solution (basal) and after the sequential additions of the K+-channel blocker 4AP (100 μM) and either CTZ 400a (CTZ; 40 μM) or vehicle (Veh). D, F The mean (± SEM) firing rate (D) and bursting frequency (F) of pHIL-transduced neurons treated with 4AP show the hyperexcitability induced by the convulsant, which is rescued upon infusion of CTZ (firing rate: n = 12, Friedman’s tests p = 0.0001, Friedman statistic=18.17, Dunn’s multiple comparisons test **p = 0.0016, ***p = 0.0003 and n = 14, p < 0.0001, Friedman statistic=24.17, Dunn’s multiple comparisons test **p = 0.0075, ****p < 0.0001; burst frequency: n = 11, one-way ANOVA F (2,30) = 6.804, p = 0.0037; Tuckey’s adjusted p values *p = 0.0183, **p = 0.005 and n = 13, one-way ANOVA F (2,36) = 18.77, p < 0.0001; Tuckey’s adjusted p values ***p = 0.0003, ****p < 0.0001; for 4AP+Veh and 4Ap + CTZ, respectively). E, G Box plots showing the changes in firing rate (E) and bursting frequency (G) in neurons expressing either Ctrl or pHIL upon Veh/CTZ administration, normalized to the activity in the presence of 4AP. The plot shows a reduction of hyperactivity induced by the activation of the pHIL sensor-actuator. Box plots are characterized by median (centre line), mean (cross symbol), 25th and 75th percentiles (box bounds), and min-max values (whisker length) (firing rate: n = 11, 12, 11, 14, Kruskal–Wallis test p = 0.0002, Kruskal-Wallis statistic=19.38; Dunn’s multiple comparisons test **p = 0.0012 (CTZ Ctrl vs CTZ pHIL), **p = 0.0018 (Veh pHIL vs CTZ pHIL); burst frequency: n = 10, 11, 11, 13, Kruskal–Wallis test p = 0.0064, Kruskal-Wallis statistic=12.31; Dunn’s multiple comparisons test *p = 0.0311 (CTZ Ctrl vs CTZ pHIL), **p = 0.0238 (Veh pHIL vs CTZ pHIL); for Veh/Ctrl, Veh/pHIL, CTZ/Ctrl and CTZ/pHIL groups, respectively). Unless specified otherwise, n indicates the number of patched neurons from 3 independent preparations.
Fig. 5
Fig. 5. pHIL prevents primary hippocampal neurons from hyperactivity induced by blockade of fast inhibitory transmission.
A Cell-attached voltage-clamp traces from primary neurons transduced with either Ctrl or pHIL in Tyrode solution (basal) and after the additions of BIC (30 μM) and either CTZ 400a (CTZ; 40 μM) or vehicle (Veh). B, D The mean (± SEM) firing rate (B) and bursting frequency (D) of pHIL-transduced neurons treated with BIC show the paroxysmal hyperactivity after administration of the convulsant, rescued upon CTZ (firing rate: n = 8, Friedman’s tests p = 0.0003, Friedman statistic=13, Dunn’s adjusted p values *p = 0.0373, **p = 0.0014 and n = 9, p < 0.0001, Friedman statistic=15.94, Dunn’s adjusted p values *p = 0.04, ***p = 0.0003; burst frequency: n = 7 one-way repeated measures ANOVA F(2,12) = 6.434 p = 0.0126, Tukey’s adjusted p values *p = 0.0213 (Basal vs BIC), *p = 0.0247 (Basal vs Veh) and n = 8 one-way repeated measures ANOVA F(2,12) = 9.948 p = 0.0028, Tukey’s adjusted p values **p = 0.0048 (Basal vs BIC), **p = 0.0074 (Basal vs CTZ); for BIC+Veh and BIC + CTZ, respectively). C, E Box plots showing the changes in firing rate (C) and bursting frequency (E) in neurons expressing either Ctrl or pHIL upon Veh or CTZ administration, normalized to the activity in the presence of BIC. The plot shows a reduction of hyperactivity induced by the BRET/FRET cascade mechanism. The plot shows a reduction of hyperactivity induced by the activation of the pHIL sensor-actuator (firing rate: n = 5, 8, 6, 9 Kruskal–Wallis test p = 0.0014, Kruskal-Wallis statistic = 15.56; Dunn’s multiple comparisons test *p = 0.0256, **p = 0.0045; burst frequency: n = 4, 7, 5, 8 Kruskal-Wallis test p = 0.0031, Kruskal–Wallis statistic = 13.89; Dunn’s multiple comparisons test *p = 0.0493 (Veh pHIL vs CTZ pHIL), *p = 0.0261 (CTZ Ctrl vs CTZ pHIL); for Veh/Ctrl, Veh/pHIL, CTZ/Ctrl and CTZ/pHIL groups, respectively). F Raw firing traces from a representative 16-electrodes MEA well and sample heat maps of the firing activity under basal conditions, in the presence of BIC or BIC + CTZ for primary hippocampal neurons transduced with either Ctrl or pHIL. G Box plots showing the changes in mean firing rate (MFR) normalized to the basal condition show a 2-fold increase induced by BIC and the significant decrease occurring in pHIL-expressing neurons upon CTZ administration. The plot shows a reduction of hyperactivity induced by the activation of the pHIL sensor-actuator(n = 31, 23, 27, 21 electrodes one-way repeated measures ANOVA F(3,84) = 5.979 p = 0.0010, Tukey’s adjusted p values *p = 0.0124 (BIC+Veh vs BIC + CTZ), **p = 0.0022 (BIC’ vs BIC + CTZ), **p = 0.0038 (BIC vs BIC + CTZ) for Veh/Ctrl, Veh/pHIL, CTZ/Ctrl and CTZ/pHIL groups, respectively). Box plots are characterized by median (centre line), mean (cross symbol), 25th and 75th percentiles (box bounds), and min-max values (whisker length). Unless specified otherwise, n indicates the number of patched neurons from 3 independent preparations.
Fig. 6
Fig. 6. Systemic administration of CTZ 400a in pHIL transduced mice triggers endogenous light emission in the hippocampus without affecting hippocampus-dependent behavior.
A Schematics of the bilateral stereotaxic injection of AAV2/1, encoding either Ctrl or pHIL under the CaMKIIα promoter, in the dorsal hippocampus of 2-month-old wild type C57BL/6 mice followed, one month later, by whole-body bioluminescence imaging and behavioral tests after vehicle or CTZ 400a (CTZ) administration (Created with BioRender.com released under a Creative Commons Attribution-NonCommercial-NoDerivs 4.0 International license (https://creativecommons.org/licenses/by-nc-nd/4.0/deed.en)). B Left: Representative whole-body bioluminescence images (merged emission of both RLuc8 and E2GFP) of Ctrl (top row) and pHIL (bottom row) transduced mice acquired every 5 min after the intravenous injection of CTZ (0.3 mg/kg). Radiance intensity is shown in pseudocolors. Right: The quantitative evaluation of the mean (± SEM) RLuc8/E2GFP live average radiance values (means ± SEM) in Ctrl (black bars) and pHIL (red bars) transduced mice displays an early emission peak 5 min after CTZ administration, followed by a progressive decrease (n = 11 mice for both Ctrl and pHIL). C Left: Representative whole-body bioluminescence images acquired 5 min after the administration of increasing doses (0.15, 0.3 and 0.6 mg/kg) of CTZ to pHIL-transduced mice. Right: Corresponding RLuc8/E2GFP live average radiance values (means ± SEM) for the three doses as a function of time after CTZ administration. For further details see panel B (n = 6, 10, 5 mice for 0.15, 0.3 and 0.6 mg/kg). DF The locomotor activity and hippocampus-dependent behavior were investigated in pHIL-transduced mice upon administration of either CTZ (0.3 and 0.6 mg/kg) or the respective vehicle. The control condition (dose = 0 mg/kg) refers to untreated pHIL-transduced mice. D Open field test. The total distance covered by the mice (top) and the time spent in the center or along the border (bottom) were comparable under all tested conditions, proving no interference of the pharmaceutical treatment with locomotor activity (means ± SEM of n = 7, 7, 10 for 0, 0.3 and 0.6 mg/kg respectively in both Veh and CTZ groups). E Novel object recognition. No effects of CTZ were observed both in the familiarization phase (top) and in the recognition phase (bottom) when mice were exposed to one object previously explored and a novel unfamiliar object (means ± SEM of n = 7, 7, 7 for 0, 0.3 and 0.6 mg/kg respectively in both Veh and CTZ groups). F Contextual fear conditioning. No significant differences in freezing times were observed both during the fear conditioning phase (top) and in control exposure to a new context (bottom) (means ± SEM of n = 7, 7, 7 for 0, 0.3, and 0.6 mg/kg respectively in both Veh and CTZ groups). In E and F, either CTZ or vehicle was administered before the novel recognition phase and the conditioning session, respectively. p > 0.05, two-way repeated measures ANOVA (D-F).
Fig. 7
Fig. 7. pHIL activation in-vivo by CTZ 400a counteracts pilocarpine-induced seizures.
A Experimental timeline of in vivo experiments to evaluate seizure susceptibility. Both Ctrl- and pHIL-transduced mice were subjected first to CTZ 400a (CTZ) injection to activate the constructs and, immediately after, to the intraperitoneal administration of pilocarpine (300 mg/kg) to induce seizure activity. Mice were videorecorded for 1 h and the seizure phenotype classified according to a modified Racine scale (right) (Created with BioRender.com released under a Creative Commons Attribution-NonCommercial-NoDerivs 4.0 International license (https://creativecommons.org/licenses/by-nc-nd/4.0/deed.en)). B The latency of most ictal behaviors shows a trend toward mitigation of the epileptic phenotype in pHIL-treated animals, becoming statistically significant for the most severe manifestations including tail dorsiflexion (Straub tail; two-sided unpaired Student’s t-test *p = 0.0418) and generalized tonic-clonic seizures (two-sided unpaired Student’s t-test *p = 0.0159). Bar plots depict means ± SEM with superimposed individual experimental points (Ctrl: n = 27, 17, 18, 21, 27; pHIL: n = 28, 26, 21, 20, 29 for immobility, body twitch, forelimb clonus, Straub tail and tonic-clonic behaviors, respectively). C The mean ( ± SEM) duration of the tonic-clonic seizures is significantly decreased in pHIL-expressing mice treated with CTZ (n = 27, 29 for Ctrl and pHIL, respectively, two-sided unpaired Student’s t-test *p = 0.03). D The analysis of the occurrence of tonic-clonic seizures (expressed as percentage of mice reaching the last stage of the Racine scale) shows an over 3-fold increase in the percentage of seizure-free animals in the pHIL-expressing group with respect to the Ctrl-expressing mice. E Dependence of the pHIL anti-seizure effects on the CTZ dose. Increasing doses (0.15, 0.3, and 0.6 mg/kg) of CTZ or the corresponding vehicle volume were administered to pHIL-transduced mice before pilocarpine. The latency (left) and duration (right) of tonic-clonic seizures normalized to the performance of the lowest vehicle volume are shown as a function of the dose (means ± SEM of n = 5, 5, 4 and 5, 5, 5 for Ctrl and pHIL at 0.15, 0.3 and 0.6 mg/kg, respectively; two-way repeated measures ANOVA; latency: treatment effect F(1,23) = 24.48 p < 0.0001, Šídák’s multiple comparisons tests *p = 0.0209 and *p = 0.0295 for 0.3 and 0.6 mg/kg, respectively; duration: treatment effect F(1,22) = 21.19 p = 0.0001; concentration effect F(2.22) = 7.690 p = 0.0029, Šídák’s multiple comparisons tests **p = 0.0055 and **p = 0.0062 for 0.3 and 0.6 mg/kg, respectively). (Created with BioRender.com).
Fig. 8
Fig. 8. pHIL activation by CTZ 400a counteracts audiogenic seizures in PRRT2 KO mice.
A, B Schematics of the startle setup for triggering and monitoring audiogenic seizures in pHIL-transduced PRRT2 KO mice (A) and representative video-tracking of the sound-evoked paroxysmal behavior of the same PRRT2 KO mouse before and after CTZ 400a (CTZ) administration (Created with BioRender.com released under a Creative Commons Attribution-NonCommercial-NoDerivs 4.0 International license (https://creativecommons.org/licenses/by-nc-nd/4.0/deed.en)) (B). C PRRT2 audiogenic seizures range from wild running to convulsive attacks and jumping, followed by post-ictal immobility. The behavioral analysis, performed before and after CTZ administration (0.3 mg/kg; n = 5 mice) shows, from left to right, the latency to paroxysmal attacks (two-sided paired Student’s t-test **p = 0.0044), and the duration of wild running (two-sided paired Student’s t-test **p = 0.0092), convulsive attacks (two-sided paired Student’s t-test *p = 0.0356), jumps and post-ictal immobility (two-sided paired Student’s t-test *p = 0.0326). (Created with BioRender.com).

References

    1. French JA. Refractory epilepsy: one size does not fit all. Epilepsy Curr. 2006;6:177. doi: 10.1111/j.1535-7511.2006.00137.x. - DOI - PMC - PubMed
    1. Kullmann DM, Schorge S, Walker MC, Wykes RC. Gene therapy in epilepsy-is it time for clinical trials? Nat. Rev. Neurol. 2014;10:300–304. doi: 10.1038/nrneurol.2014.43. - DOI - PubMed
    1. Guerrini R, et al. Developmental and epileptic encephalopathies: from genetic heterogeneity to phenotypic continuum. Physiol. Rev. 2023;103:433–513. doi: 10.1152/physrev.00063.2021. - DOI - PMC - PubMed
    1. Zhang L, Wang Y. Gene therapy in epilepsy. Biomed. Pharmacother. 2021;143:112075. doi: 10.1016/j.biopha.2021.112075. - DOI - PubMed
    1. Wykes RC, et al. Optogenetic and potassium channel gene therapy in a rodent model of focal neocortical epilepsy. Sci. Transl. Med. 2012;4:161ra152. doi: 10.1126/scitranslmed.3004190. - DOI - PMC - PubMed

MeSH terms