

Fake views removal and popularity on YouTube
- PMID: 38965242
- PMCID: PMC11224302
- DOI: 10.1038/s41598-024-63649-w
Fake views removal and popularity on YouTube
Abstract
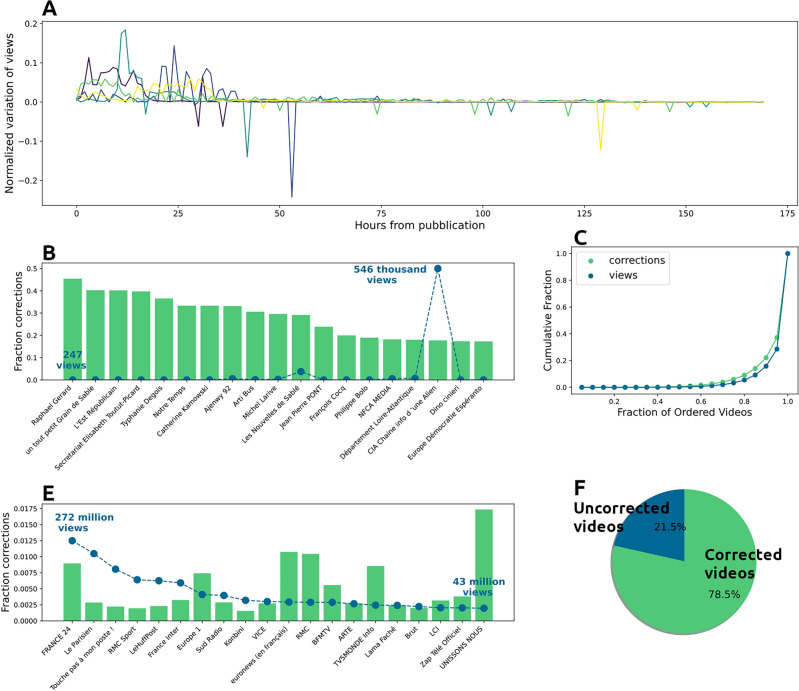
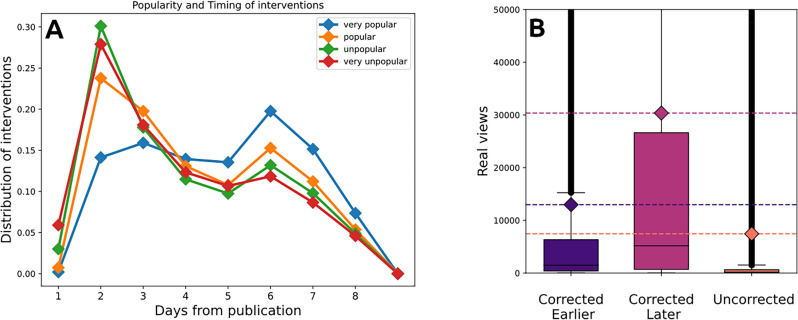
This paper analyses how YouTube authenticates engagement metrics and, more specifically, how the platform corrects view counts by removing "fake views" (i.e., views considered artificial or illegitimate by the platform). Working with one and a half years of data extracted from a thousand French YouTube channels, we show the massive extent of the corrections done by YouTube, which concern the large majority of the channels and over 78% of the videos in our corpus. Our analysis shows that corrections are not done continuously as videos collect new views, but instead occur in batches, generally around 5 p.m. every day. More significantly, most corrections occur relatively late in the life of the videos, after they have reached most of their audience, and the delay in correction is not independent of the final popularity of videos: videos corrected later in their life are more popular on average than those corrected earlier. We discuss the probable causes of this phenomenon and its possible negative consequences on content diffusion. By inflating view counts, fake views could make videos appear more popular than they are and unwarrantedly encourage their recommendation, thus potentially altering the public debate on the platform. This could have implications on the spread of online misinformation, but their in-depth exploration requires first-hand information on view corrections, which YouTube does not provide through its API. This paper presents a series of experimental techniques to work around this limitation, offering a practical contribution to the study of online attention cycles (as described in the "Data and methods" section). At the same time, this paper is also a call for greater transparency by YouTube and other online platforms about information with crucial implications for the quality of online debate.
© 2024. The Author(s).
Conflict of interest statement
The authors declare no competing interests.
Figures


References
-
- Google - YouTube Terms of Service. How engagement metrics are counted (2022). https://support.google.com/YouTube/answer/2991785?hl=en%E2%80%8B. Accessed 12 July 2022.
-
- Gayle, D. YouTube cancels billions of music industry video views after finding they were fake or ’dead’. Daily Mail (2012). https://www.dailymail.co.uk/sciencetech/article-2254181/YouTube-wipes-bi.... Accessed 12 July 2022.
-
- Hoffberger, C. YouTube strips universal and sony of 2 billion fake views (2012). https://www.dailydot.com/unclick/YouTube-universal-sony-fake-views-black.... Accessed 12 July 2022.
-
- Fake YouTube views cut by 2 billion as google audits record companies’ video channels (2012). https://www.huffpost.com/entry/fake-youtube-views-cut-google-audit_n_238.... Accessed 16 June 2022.
-
- Dredge, S. Google goes to war on ’fraudulent’ YouTube video views. The Guardian (2014). http://www.theguardian.com/technology/2014/feb/05/YouTube-fake-views-cou.... 12 Accessed July 2022.
Grants and funding
LinkOut - more resources
Full Text Sources
Miscellaneous
