. 2024 Jul 5;15(1):5638.
doi: 10.1038/s41467-024-50071-z.

TWEAK/Fn14 signalling driven super-enhancer reprogramming promotes pro-metastatic metabolic rewiring in triple-negative breast cancer

Affiliations

TWEAK/Fn14 signalling driven super-enhancer reprogramming promotes pro-metastatic metabolic rewiring in triple-negative breast cancer

Nicholas Sim et al. Nat Commun. .

Abstract

Triple Negative Breast Cancer (TNBC) is the most aggressive breast cancer subtype suffering from limited targeted treatment options. Following recent reports correlating Fibroblast growth factor-inducible 14 (Fn14) receptor overexpression in Estrogen Receptor (ER)-negative breast cancers with metastatic events, we show that Fn14 is specifically overexpressed in TNBC patients and associated with poor survival. We demonstrate that constitutive Fn14 signalling rewires the transcriptomic and epigenomic landscape of TNBC, leading to enhanced tumour growth and metastasis. We further illustrate that such mechanisms activate TNBC-specific super enhancers (SE) to drive the transcriptional activation of cancer dependency genes via chromatin looping. In particular, we uncover the SE-driven upregulation of Nicotinamide phosphoribosyltransferase (NAMPT), which promotes NAD+ and ATP metabolic reprogramming critical for filopodia formation and metastasis. Collectively, our study details the complex mechanistic link between TWEAK/Fn14 signalling and TNBC metastasis, which reveals several vulnerabilities which could be pursued for the targeted treatment of TNBC patients.


Conflict of interest statement

The authors declare no competing interests.

Figures
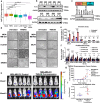
Fig. 1
Fig. 1. Constitutive Fn14 expression correlates with poor survival in TNBC patients and drives TNBC progression.
a Relative Fn14 gene expression levels in Basal-like (n = 229), HER2 (n = 158), Luminal A (n = 300), Luminal B (n = 304), Normal-like (n = 106) and non-cancer (n = 113) patient samples from the TCGA BRCA RNA-seq dataset. Box plot depicts the first quartile, median and third quartile of values. Fn14 protein expression analysed by western blotting in (b) TNBC patient tumours (T) and their matched normal samples (N), and in (c) TNBC, HER2 and ER-positive breast cancer cell lines. d Transwell invasion assay was performed in MDA-MB-231, Hs578T, BT549, SKBR3, MDA-MB-453, MCF7, T47D and CAMA1 cells with and without TWEAK treatment. Representative images from n = 3 biological replicates are shown. Scale bars: 400 µm. e Plot depicts the average number of invaded cells/frame (mean ± s.d) from n = 3 biological replicates, across four fields per replicate. f Proliferation assay plot depicts the average number of cells counted relative to 0 h (mean ± s.d) in MDA-MB-231, Hs578T, BT549, SKBR3, MDA-MB-453, MCF7, T47D and CAMA1 cells, treated with and without TWEAK from n = 3 biological replicates. g Tumour growth plot depicts the weekly average tumour volume (mean ± s.d) from mice injected with MDA-MB-231 cells overexpressing luciferase and overexpression control or TWEAK. Performed in n = 5 biological replicates. h IVIS tracking of mice injected with MDA-MB-231 cells overexpressing luciferase and overexpression control or TWEAK. Representative bioluminescent images of the animals were taken at 1 and 8 weeks after orthotopic xenograft. i Plot depicts total flux (mean ± s.d) at the metastatic sites of each animal after 8 weeks in n = 5 biological replicates. Western blot samples were derived from the same experiment and on the same gels for Fn14 and GAPDH. Experiments involving cell lines were performed 3 times independently, each time on different days. Two-sided Wilcoxon signed-rank test was used for differential gene expression. Two-sided two-way ANOVA was used for in vitro proliferation and invasion assay. Two-sided t test was used for in vivo assays. *P < 0.05; **P < 0.01; ***P < 0.001. Source data are provided as a Source Data file.
Fig. 2
Fig. 2. TWEAK/Fn14 signalling drives a distinct transcriptomic signature which is associated with oncogenic processes in TNBC tumours.
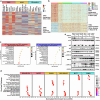
a Heatmap depicting the average expression of TWEAK/Fn14 differentially regulated TNBC genes in MDA-MB-231, Hs578T, SKBR3, MDA-MB-453, MCF7 and CAMA1 cell lines, treated with and without TWEAK. Data shown represent n = 3 biological replicates. b Heatmap depicting the expression of TWEAK/Fn14 upregulated and downregulated genes in TNBC cell lines that were respectively enriched and depleted in TCGA BRCA basal-like patient samples. c Dot plot depicting the enriched GO terms associated with the TWEAK/Fn14 differentially regulated genes in TNBC cell lines and TCGA BRCA basal-like patient samples. d Dot plot depicting enriched signalling pathways specific to and common between TNBC, HER2 and ER-positive breast cancer cell lines following TWEAK treatment. e NF-κB and MAPK pathway signalling regulators analysed by western blotting in MDA-MB-231, Hs578T, BT549, MCF7, T47D and CAMA1 cells, treated with and without TWEAK. The western blot samples derive from the same experiment but different gels for Fn14, another for NFKB2, p65 and GAPDH, another for p-JNK1/2 and JNK1/2 and another for p-ERK1/2 and ERK1/2 were processed in parallel. Fisher’s exact test was used for statistical analysis of GO terms. Kolmogorov-Smirnov test was used for statistical analysis of enriched pathways. Source data are provided as a Source Data file.
Fig. 3
Fig. 3. TWEAK/Fn14 signalling rewires the SE landscape of TNBCs.
a ATAC-seq signals of MDA-MB-231, Hs578T, SKBR3 and MCF7 cells, treated with and without TWEAK, as well as the merged signals of Fn14 high TNBC patient tumours and their matched normal samples (2086, 8370, 2963, 6122, 8850 and 5929) at differentially regulated chromatin accessible sites in TNBC cell lines following TWEAK treatment. b Genomic distribution of the TWEAK/Fn14 differentially regulated TNBC ATAC-seq peaks. c Correlation plot between TWEAK/Fn14 differentially regulated TNBC ATAC-seq peaks and the H3K27ac ChIP-seq peaks that overlap. d H3K27ac ChIP-seq signals of MDA-MB-231, Hs578T, SKBR3, MDA-MB-453, MCF7 and CAMA1 cells, treated with and without TWEAK, as well as the merged signals of Fn14 high TNBC patient tumours and their matched normal samples at differentially regulated enhancer sites in TNBC cell lines. e GREAT terms associated with TNBC TWEAK/Fn14-upregulated and downregulated enhancers. f Bar plot depicting the number of shared TWEAK/Fn14 regulated TNBC SEs found in cell lines and tumours. g Merged H3K27ac normalised binding score of the Fn14 high TNBC patient tumours and their matched normal samples at TWEAK/Fn14 differentially regulated SEs found in TNBC cell lines and tumour samples. h Average gene expression in TCGA BRCA patient samples of the nearest genes to TWEAK/Fn14 upregulated SEs detected in TNBC cell lines and tumour samples. Basal-like (n = 229), HER2 (n = 158), Luminal A (n = 300), Luminal B (n = 304), Normal-like (n = 106) and non-cancer (n = 113). Box within violin plot depicts the first quartile, median and third quartile of values. Binomial test was used for statistical analysis of GREAT GO terms. Two-sided Wilcoxon signed-rank test was used for statistical analysis of differential gene expression. *P < 0.05; **P < 0.01; ***P < 0.001.
Fig. 4
Fig. 4. TWEAK/Fn14 signalling alters the binding dynamics of key transcription factors from the AP-1 and NF-κB families.
a Global TF binding dynamics in TWEAK stimulated MDA-MB-231, Hs578T and Fn14 high TNBC patient tumours (2086, 8370, 2963, 6122, 8850 and 5929). MDA-MB-231 and Hs578T log2 fold changes for footprints and gene expression are averaged. Average global FDR for each TF footprint across cell lines and tumours indicated. TF binding changes exhibiting p values in the upper half of the distribution are selected and filtered for consistent global footprint and gene expression dynamics across cell lines and tumours. Motifs are clustered based on similarity via TOBIAS. b Aggregate plots for footprints called as bound in tumour samples and unbound in normal samples. Aggregated signal is normalised for coverage, centred on the TFBS flanked by 60 bp. c AP-1 family transcription factor binding sites at SEs showing increased binding under TWEAK stimulation and in TNBC tumours. Average transcription factor binding site (TFBS) score is calculated across all sites showing increased binding. Average log2 fold change is the average across MDA-MB-231, Hs578T under TWEAK stimulation and TNBC versus normal samples. d GO biological processes enriched for genes in proximity to binding sites showing increased footprint depth across enhancers under TWEAK stimulation and in TNBC versus normal samples. False discovery rate test was used for statistical analysis of GO terms.
Fig. 5
Fig. 5. TWEAK/Fn14 signalling remodels the TNBC chromatin interactome associated with key oncogenes.
a Aggregated peak analysis matrices depicting H3K27ac HiChIP loop signals in MDA-MB-231 cells, treated with and without TWEAK. b Venn diagram depicting the common and differential H3K27ac HiChIP loops between untreated and TWEAK-activated MDA-MB-231 cells. c Annotation of H3K27ac HiChIP loops detected in MDA-MB-231 cells, treated with and without TWEAK treatment. E-P: Enhancer-Promoter; P-P: Promoter-Promoter; E-E: Enhancer-Enhancer. d Plot depicting the TWEAK/Fn14 differentially regulated HiChIP loops between enhancers and gene promoters. Squares indicate loops where the interacting enhancer overlaps a TNBC-specific SE. Diamonds indicate loops where the interacting gene promoter belongs to a DepMap TNBC dependency gene. Triangles indicate loops between a TNBC-specific SE and DepMap TNBC dependency gene. The upper right quadrant of the plot containing loops between upregulated enhancers and DEGs is enlarged, and the top 20 DepMap TNBC dependency genes are labelled.
Fig. 6
Fig. 6. TWEAK/Fn14-activated TNBC SE drives NAMPT expression and TNBC progression.
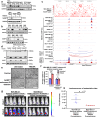
Western blot analysis of NAMPT expression in (a) untreated and TWEAK-treated TNBC, HER2 and ER-positive breast cancer cell lines, and (b) TNBC patient tumours (T) and their matched normal samples (N). c NAMPT locus. Top: H3K27ac HiChIP heatmap of TWEAK-treated MDA-MB-231 cells. Middle: H3K27ac ChIP-seq of untreated and TWEAK-treated MDA-MB-231, Hs578T, SKBR3, MDA-MB-453, MCF7 and CAMA1 cells. Bottom: chromatin interactions in untreated and TWEAK-treated MDA-MB-231 cells, and merged H3K27ac ChIP-seq of Fn14 high TNBC tumours and their matched normal samples (2086, 8370, 2963, 6122, 8850 and 5929). d Western blot analysis of NAMPT and NFκB2 expression in Control and NAMPT enhancer #1, #2 and #3 deleted MDA-MB-231 cells, with and without TWEAK. e Transwell invasion assay performed in Control and NAMPT enhancer #3 deleted MDA-MB-231, cells with and without TWEAK. Scale bars: 400 µm. f Plot depicts the average number of invaded cells/frame (mean ± s.d), across four fields per replicate. g IVIS imaging of mice injected with control and NAMPT enhancer #3 deleted MDA-MB-231 cells overexpressing TWEAK and luciferase. Representative bioluminescent images were taken 1 and 8 weeks after injection (luminescent signal of Control mouse #2 at week 1 was detectable but very low). h Plot depicting the total flux (mean ± s.d) at the metastatic sites of each animal at week 8. (Representative image of Control Mouse #3 was taken at week 7 as the mouse died before week 8). The western blot samples derive from the same experiment and same gel for NAMPT and GAPDH in (a) and (b). The western blot samples derive from the same experiment but different gels for NFKB2 and GAPDH and another for NAMPT were processed in parallel in (d). In vivo assays represent n = 5 biological replicates, other assays represent n = 3 biological replicates. Experiments involving cell lines were performed 3 times independently, each time on different days. Two-sided t test was used for in vivo assay, two-sided two-way ANOVA was used for the other assays where *P < 0.05; **P < 0.01; ***P < 0.001. Source data are provided as a Source Data file.
Fig. 7
Fig. 7. TWEAK/Fn14-driven NAMPT regulates NAD + /NADH and ATP production to stimulate filopodia and promote invasion in TNBC cells.
a Plot depicting the relative NAD + /NADH levels in control and NAMPT enhancer #3 deleted MDA-MB-231 cells, with and without TWEAK treatment. b Plot depicting the relative intracellular ATP levels in control and NAMPT enhancer #3 deleted MDA-MB-231 cells, following TWEAK and NAD+ treatment. c Representative images of control and NAMPT enhancer #3 deleted MDA-MB-231 cells stained for actin and DAPI, following TWEAK, NAD+ and LatA treatment, using a Zeiss Live Cell Observer microscope (63x magnification). White arrows point to filopodia protrusions. Scale bars: 50 µm. (n = 3 biological replicates) (d) Plot depicting the average filopodia density (mean ± s.d) from n = 3 biological replicates. e Representative images of transwell invasion assay performed in Control and NAMPT enhancer #3 deleted MDA-MB-231 cells following TWEAK, NAD+ and LatA treatment (n = 3 biological replicates). Scale bars: 400 µm. f Plot depicts the average number of invaded cells/frame (mean ± s.d) from n = 3 biological replicates, across four fields per replicate. Experiments involving cell lines were performed 3 times independently, each time on different days. Two-sided one-way ANOVA was used for statistical analysis all assays. *P < 0.05; **P < 0.01; ***P < 0.001. Source data are provided as a Source Data file.
Fig. 8
Fig. 8. Proposed mechanism of TWEAK/Fn14 signalling in the activation of oncogenic TNBC SEs to induce pro-metastatic metabolic reprogramming.
Aberrant TWEAK/Fn14 signalling in TNBCs trigger NAMPT SE activation to augment NAMPT expression via chromatin looping. MAFG binds to the TWEAK-driven SE to regulate its activity which in turn leads to NAD+ and ATP metabolic rewiring, resulting in enhanced TNBC proliferation, filopodia formation and metastasis. Created with BioRender.com.

References

    1. Sung H, et al. Global cancer statistics 2020: GLOBOCAN estimates of incidence and mortality worldwide for 36 cancers in 185 countries. CA: Cancer J. Clin. 2021;71:209–249. - PubMed
    1. Wu H-J, Chu P-Y. Recent discoveries of macromolecule-and cell-based biomarkers and therapeutic implications in breast cancer. Int. J. Mol. Sci. 2021;22:636. doi: 10.3390/ijms22020636. - DOI - PMC - PubMed
    1. Siegel RL, Miller KD, Fuchs HE, Jemal A. Cancer statistics, 2022. CA: Cancer J. Clin. 2022;72:7–33. - PubMed
    1. Yi M, et al. Epidemiological trends of women’s cancers from 1990 to 2019 at the global, regional, and national levels: a population-based study. Biomark. Res. 2021;9:55. doi: 10.1186/s40364-021-00310-y. - DOI - PMC - PubMed
    1. Lüönd F, Tiede S, Christofori G. Breast cancer as an example of tumour heterogeneity and tumour cell plasticity during malignant progression. Br. J. cancer. 2021;125:164–175. doi: 10.1038/s41416-021-01328-7. - DOI - PMC - PubMed

MeSH terms