. 2024 Jul 4;14(1):15461.
doi: 10.1038/s41598-024-66498-9.

A solid state electrolyte based enzymatic acetone sensor

Affiliations

A solid state electrolyte based enzymatic acetone sensor

Yusra M Obeidat et al. Sci Rep. .

Abstract

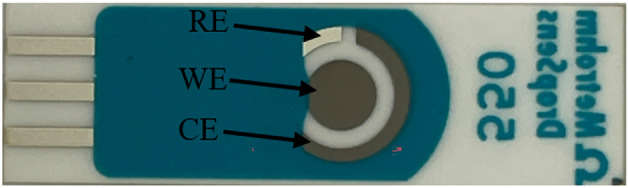
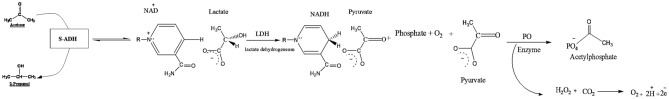
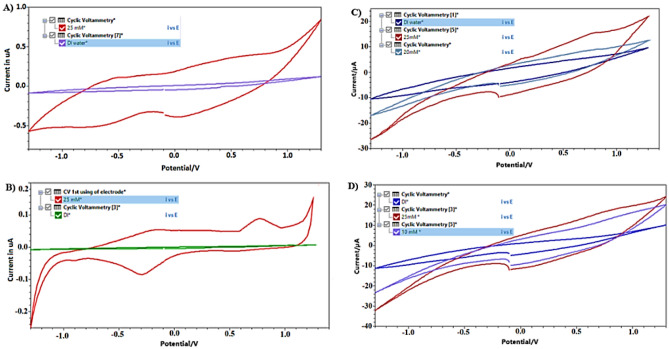
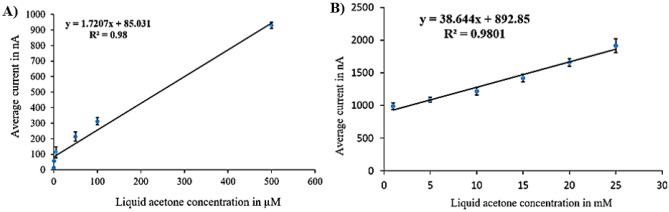
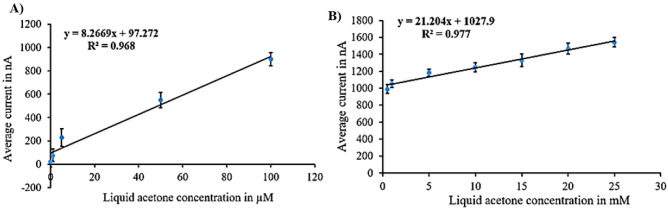
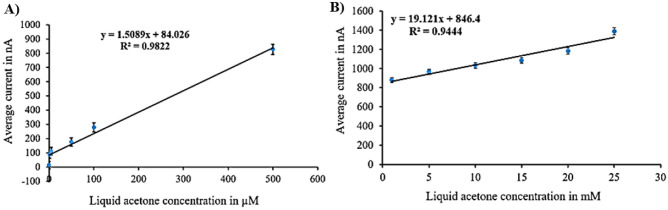
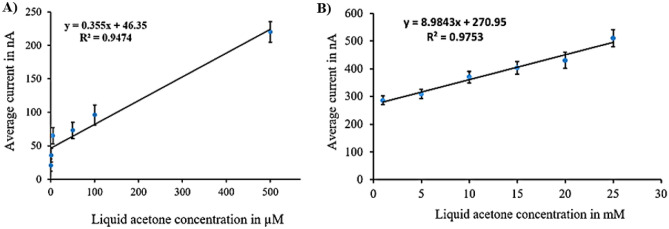
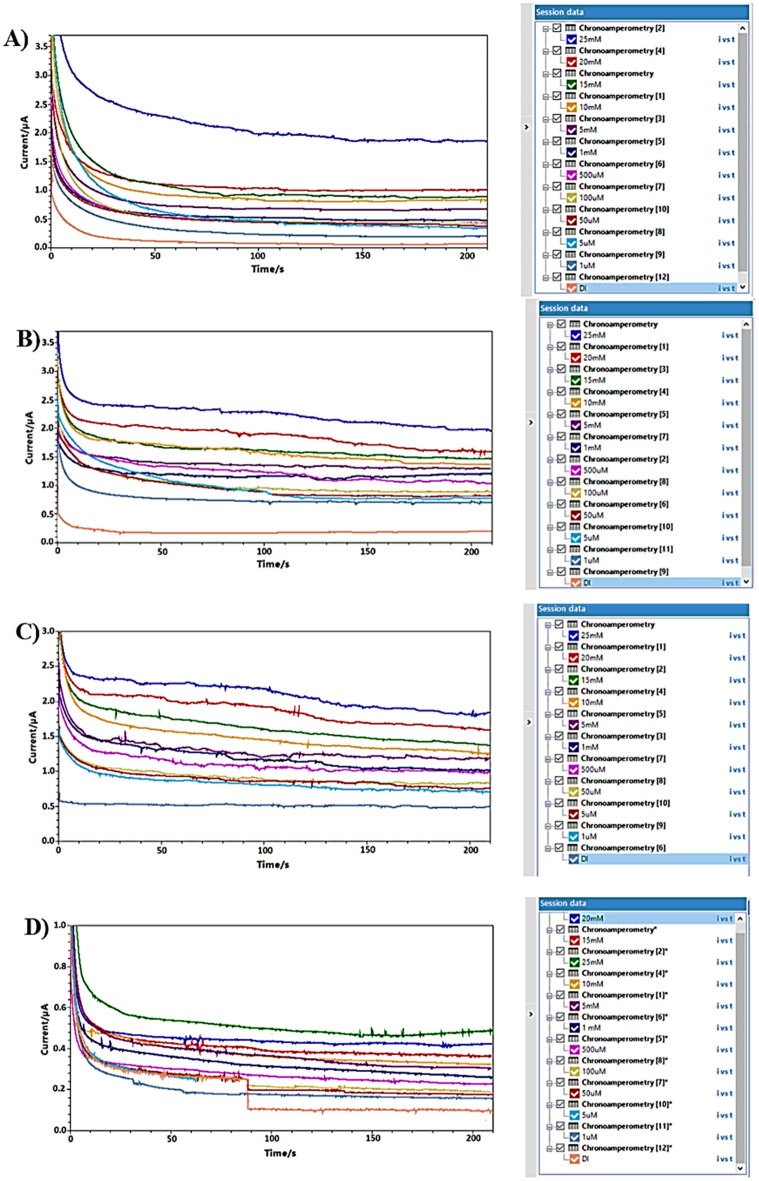
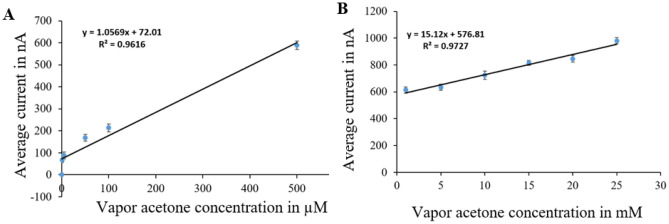
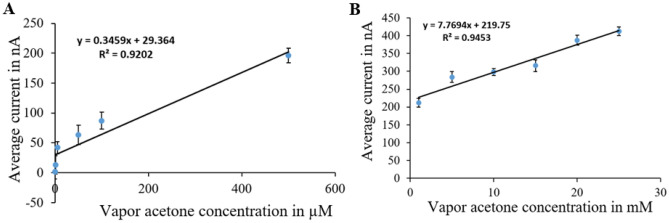
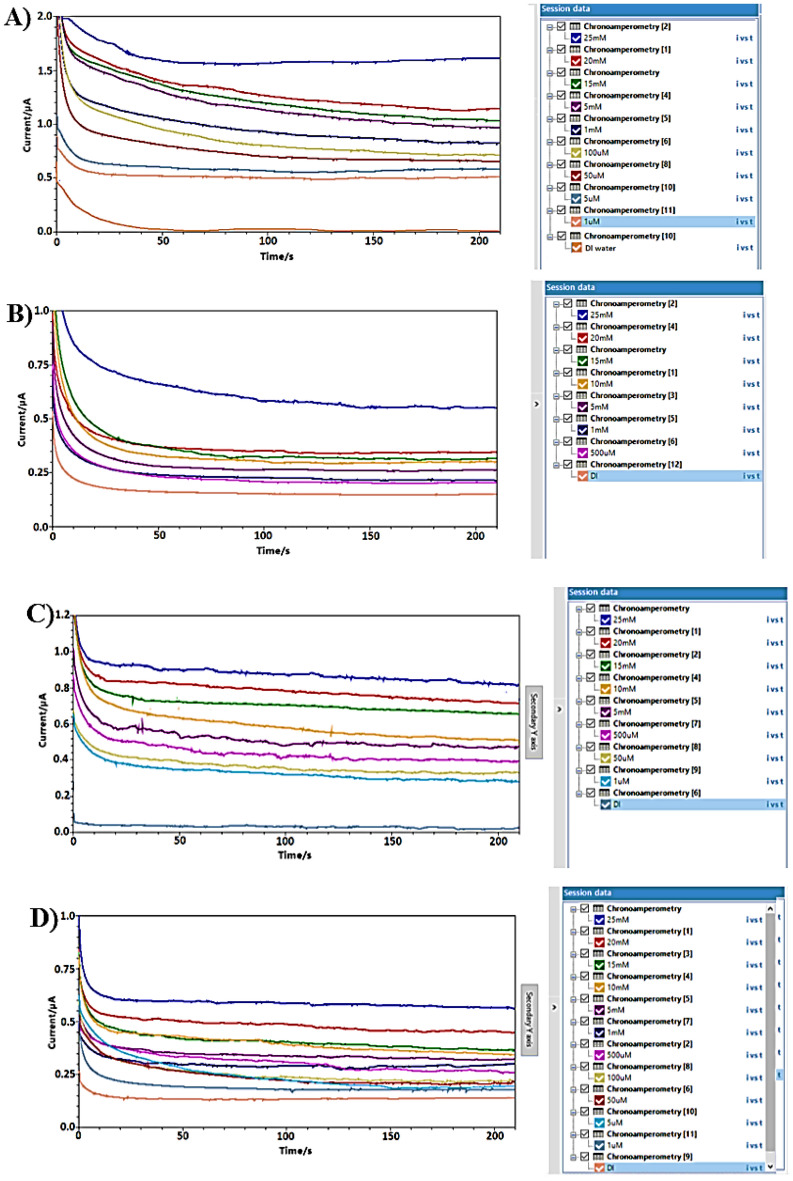
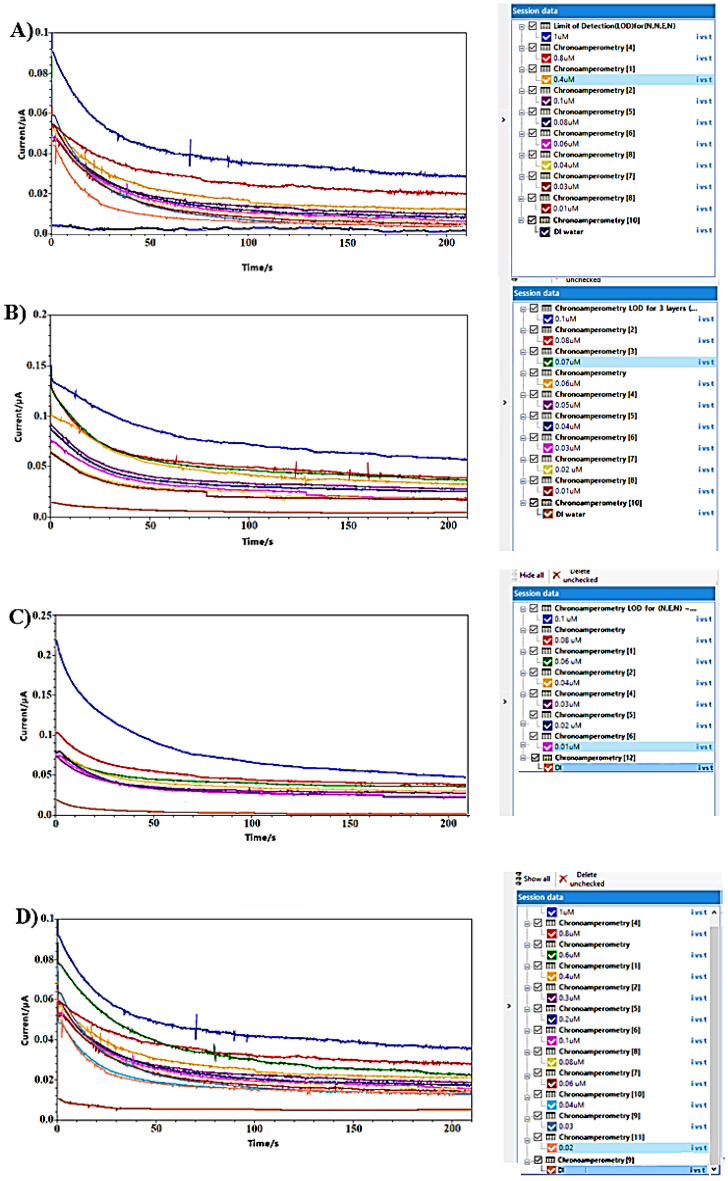
This paper introduces a novel solid-state electrolyte-based enzymatic sensor designed for the detection of acetone, along with an examination of its performance under various surface modifications aimed at optimizing its sensing capabilities. To measure acetone concentrations in both liquid and vapor states, cyclic voltammetry and amperometry techniques were employed, utilizing disposable screen-printed electrodes consisting of a platinum working electrode, a platinum counter electrode, and a silver reference electrode. Four different surface modifications, involving different combinations of Nafion (N) and enzyme (E) layers (N + E; N + E + N; N + N + E; N + N + E + N), were tested to identify the most effective configuration for a sensor that can be used for breath acetone detection. The sensor's essential characteristics, including linearity, sensitivity, reproducibility, and limit of detection, were thoroughly evaluated through a range of experiments spanning concentrations from 1 µM to 25 mM. Changes in acetone concentration were monitored by comparing currents readings at different acetone concentrations. The sensor exhibited high sensitivity, and a linear response to acetone concentration in both liquid and gas phases within the specified concentration range, with correlation coefficients ranging from 0.92 to 0.98. Furthermore, the sensor achieved a rapid response time of 30-50 s and an impressive detection limit as low as 0.03 µM. The results indicated that the sensor exhibited the best linearity, sensitivity, and limit of detection when four layers were employed (N + N + E + N).

Keywords: Acetone; Amperometry; Cyclic voltammetry; Electrochemistry; Enzymatic; Nafion; Sensor.


Conflict of interest statement

The authors declare no competing interests.

Figures

Figure 1
Figure 1
DropSens screen printed electrodes.
Figure 2
Figure 2
The mechanism of enzymatic breath acetone detection.
Figure 3
Figure 3
CV results for different surface modifications: (A) N + E. (B) N + N + E + N. (C) N + N + E. (D) N + E + N.
Figure 4
Figure 4
Calibration curves for liquid acetone in case of N + N + E + N: (A) low concentration. (B) high concentration.
Figure 5
Figure 5
Calibration curves for liquid acetone in case of N + N + E: (A) low concentration. (B) high concentration.
Figure 6
Figure 6
Calibration curves for liquid acetone in case of N + E + N: (A) low concentration. (B) high concentration.
Figure 7
Figure 7
Calibration curves for liquid acetone in case of N + E: (A) low concentration. (B) high concentration.
Figure 8
Figure 8
Example of amperometry results of liquid samples across concentration range of (1 µM to 25 mM) at different surface modifications of: (A) N + N + E + N. (B) N + N + E. (C) N + E + N. (D) N + E.
Figure 9
Figure 9
Calibration curves for vapor acetone in case of N + N + E + N: (A) low concentration. (B) high concentration.
Figure 10
Figure 10
Calibration curves for vapor acetone in case of N + N + E: (A) low concentration. (B) high concentration.
Figure 11
Figure 11
Calibration curves for vapor acetone in case of N + E + N: (A) low concentration. (B) high concentration.
Figure 12
Figure 12
Calibration curves for vapor acetone in case of N + E: (A) low concentration. (B) high concentration.
Figure 13
Figure 13
Example of amperometry results of vapor samples across concentration range of (1 µM to 25 mM) at different surface modifications of: (A) N + N + E + N. (B) N + N + E. (C) N + E + N, (D) N + E.
Figure 14
Figure 14
Example of amperometry results for measuring the LOD at different surface modifications of: (A) N + N + E + N. (B) N + N + E. (C) N + E + N. (D) N + E.

References

    1. Koeslag JH. Post-exercise ketosis and the hormone response to exercise: A review. Med. Sci. Sports Exerc. 1982;14(5):327–334. doi: 10.1249/00005768-198205000-00003. - DOI - PubMed
    1. Janssen PH, Schnik B. Catabolic and anabolic enzyme activities and energetics of acetone metabolism of the sulfate-reducing bacterium Desulfococcus biacutus. J. Bacteriol. 1995;177(2):277–282. doi: 10.1128/jb.177.2.277-282.1995. - DOI - PMC - PubMed
    1. Weber I, Derron N, Koenigstein K, Gerber P, Güntner A, Pratsinis S. Monitoring lipolysis by sensing breath acetone down to ppb. Small Sci. 2021 doi: 10.1002/smsc.202100004. - DOI
    1. Ruzsányi V, Péter KM. Breath acetone as a potential marker in clinical practice. J. Breath Res. 2017;11(2):024002. doi: 10.1088/1752-7163/aa66d3. - DOI - PubMed
    1. Königstein K, Abegg S, Schorn AN, et al. Breath acetone change during aerobic exercise is moderated by cardiorespiratory fitness. J. Breath Res. 2020 doi: 10.1088/1752-7163/abba6c. - DOI - PubMed

LinkOut - more resources