. 2024 Jul 4;7(1):811.
doi: 10.1038/s42003-024-06486-x.

Asymptomatic herpes simplex virus brain infection elicits cellular senescence phenotypes in the central nervous system of mice suffering multiple sclerosis-like disease

Affiliations

Asymptomatic herpes simplex virus brain infection elicits cellular senescence phenotypes in the central nervous system of mice suffering multiple sclerosis-like disease

Luisa F Duarte et al. Commun Biol. .

Abstract

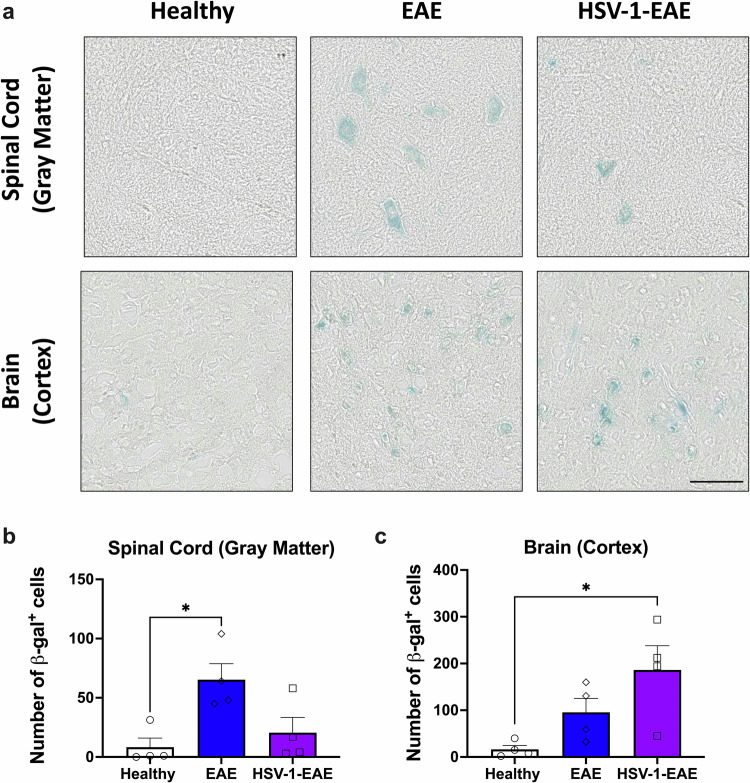
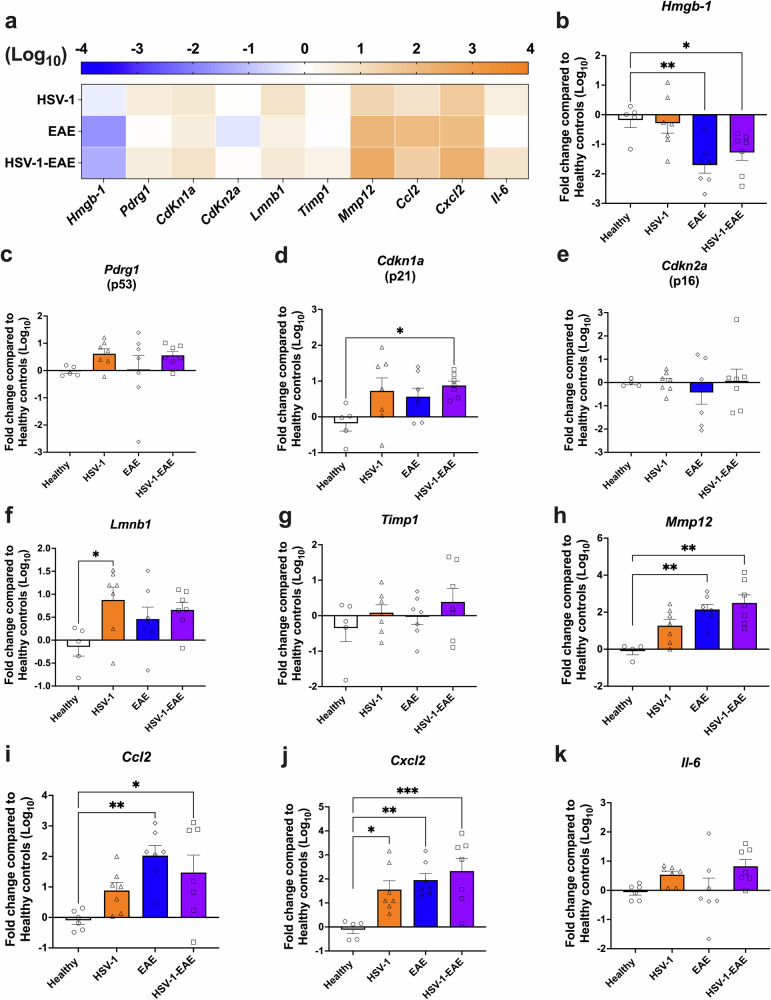
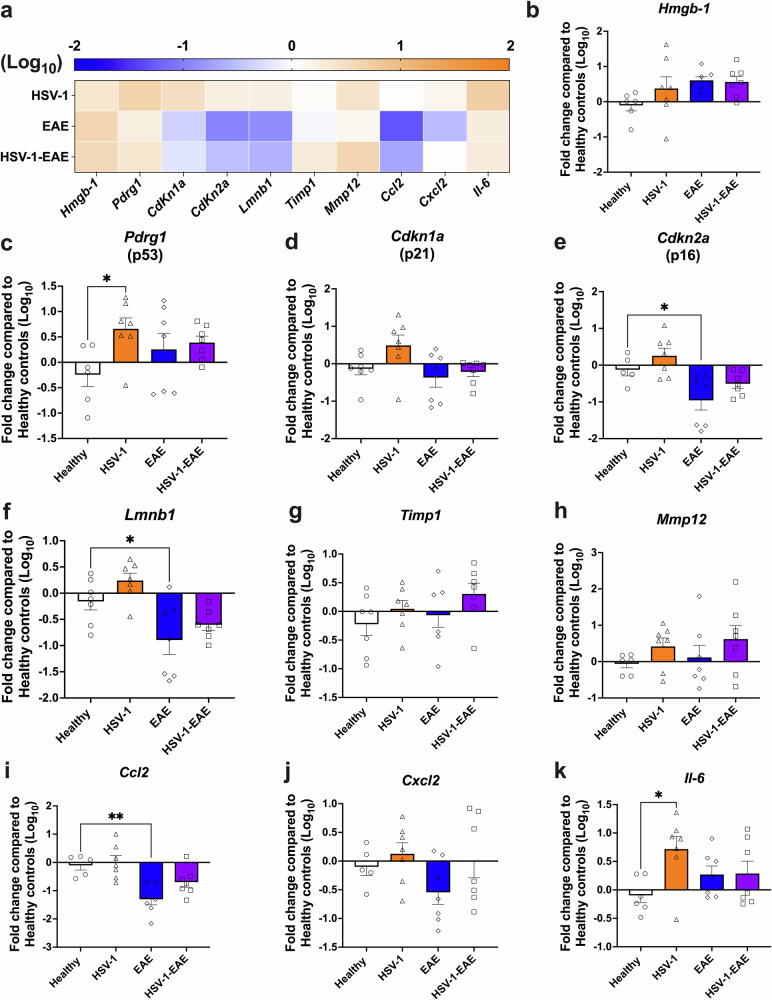
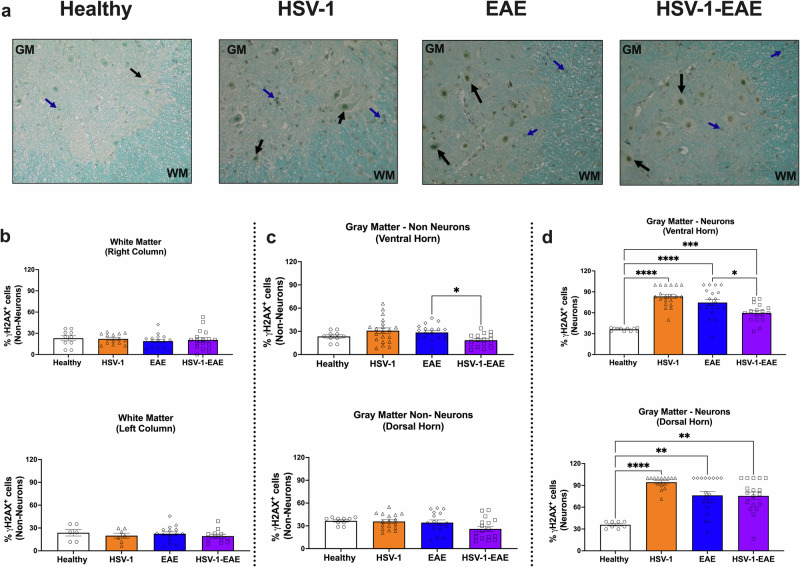
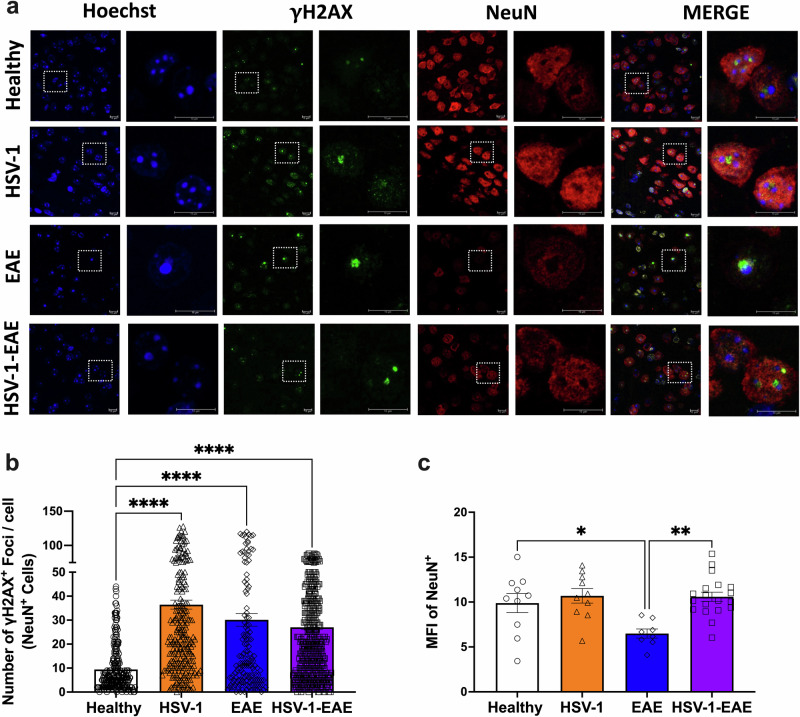
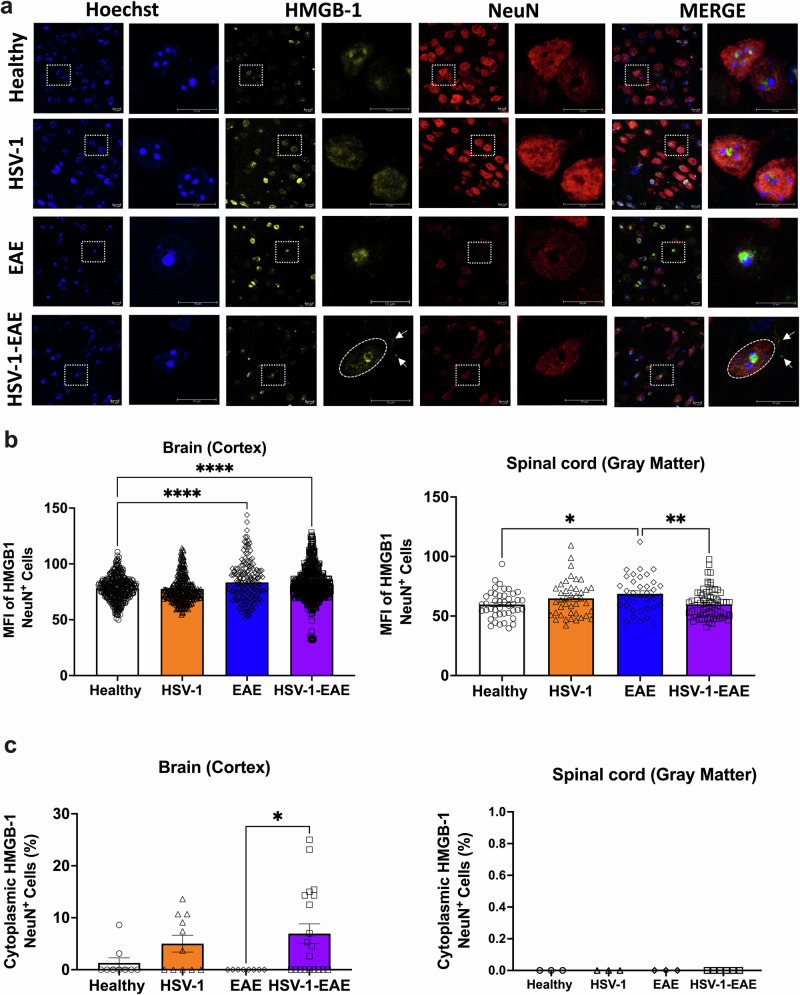
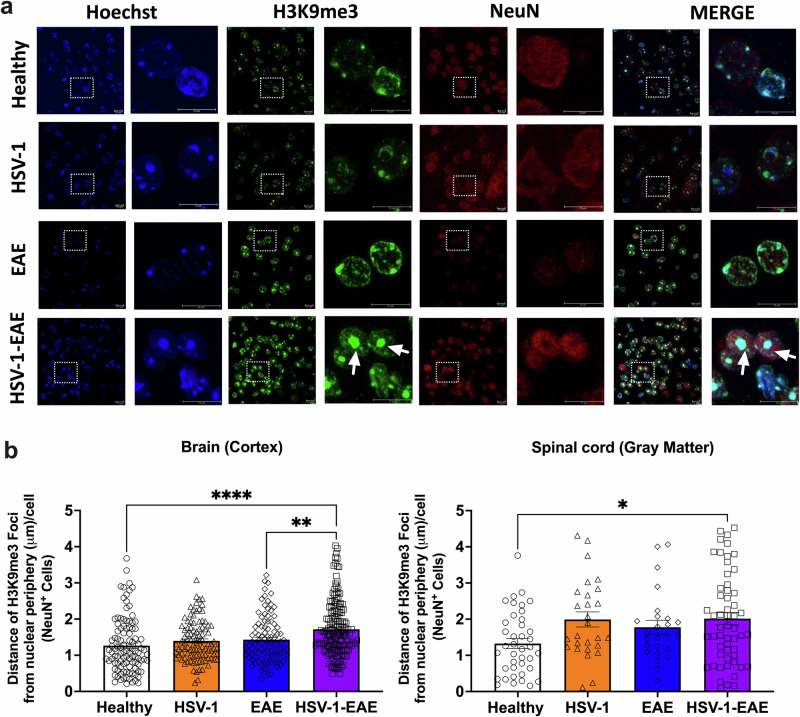
Experimental autoimmune encephalomyelitis (EAE) is a demyelinating disease affecting the central nervous system (CNS) in animals that parallels several clinical and molecular traits of multiple sclerosis in humans. Herpes simplex virus type 1 (HSV-1) infection mainly causes cold sores and eye diseases, yet eventually, it can also reach the CNS, leading to acute encephalitis. Notably, a significant proportion of healthy individuals are likely to have asymptomatic HSV-1 brain infection with chronic brain inflammation due to persistent latent infection in neurons. Because cellular senescence is suggested as a potential factor contributing to the development of various neurodegenerative disorders, including multiple sclerosis, and viral infections may induce a premature senescence state in the CNS, potentially increasing susceptibility to such disorders, here we examine the presence of senescence-related markers in the brains and spinal cords of mice with asymptomatic HSV-1 brain infection, EAE, and both conditions. Across all scenarios, we find a significant increases of senescence biomarkers in the CNS with some differences depending on the analyzed group. Notably, some senescence biomarkers are exclusively observed in mice with the combined conditions. These results indicate that asymptomatic HSV-1 brain infection and EAE associate with a significant expression of senescence biomarkers in the CNS.


Conflict of interest statement

The authors declare no competing interests.

Figures

Fig. 1
Fig. 1. Brain and spinal cord tissues of mice with EAE show increased SA-β-Gal activity, regardless of previous HSV-1 infection.
a Representative images for SA-β-Gal activity detection (blue staining) in the gray matter of spinal cord and brain cortex tissues of healthy mice and mice with EAE, with or without previous HSV-1 infection. Measurement of SA-β-Gal activity was carried out in tissues fourteen days after EAE induction. Images correspond to 20X magnifications and the scale bar to 100 μm. b Quantification of SA-β-Gal-positive cells in the gray matter of spinal cord tissue. c Quantification of SA-β-Gal-positive cells in the brain cortex tissue. White bars with circles represent data from healthy mice, blue bars with diamonds represent data from mice with EAE and purple bars with squares represent data from mice with EAE and HSV-1 infection. Values represent means ± SEM of four animals per group. Data were analyzed using the Kruskal–Wallis test followed by Dunn’s post-hoc test; *p < 0.05.
Fig. 2
Fig. 2. Asymptomatic HSV-1 brain infection and EAE, individually or combined, increase the mRNA levels of senescence-associated genes in the spinal cord.
Mice were mock-treated (healthy group, white bars with circles) or asymptomatically infected with HSV-1 strain 17syn+ in the brain (HSV-1 group, orange bars with triangles). EAE was induced 4 weeks after mock treatment (EAE group, blue bars with diamonds), or infection (HSV-1-EAE group, purple bars with squares). Spinal cord homogenates were recovered 14 days after EAE induction, or 45–50 days after HSV-1 infection, or mock treatment alone. The expression of senescence-associated genes was evaluated at the mRNA level by RT-qPCR using the 2−ΔΔCTmethod with β-actin as a reference gene. a Heatmap comparing mRNA levels of senescence-associated genes in the spinal cord of HSV-1, EAE, and HSV-1-EAE groups. The orange color indicates upregulation while the blue color indicates downregulation. Darker colors indicate stronger effects. Relative mRNA expression of the gene products b Hmgb-1, c Pdrg1, d Cdkn1a, e Cdkn2a, f Lmnb1, g Timp1, h Mmp12, i Ccl2, j Cxcl2, and k Il6 in the different mouse groups compared to healthy controls. Values represent means ± SEM of two independent experiments (n = 7 animals/group). Log-transformed data were analyzed using one-way ANOVA followed by Dunnett’s post-hoc test; ***p < 0.001, **p < 0.01, and *p < 0.05.
Fig. 3
Fig. 3. Asymptomatic HSV-1 brain infection and EAE, individually or combined, increase the mRNA levels of senescence-associated genes in the brain.
Mice were mock-treated (healthy group, white bars with circles) or asymptomatically infected with HSV-1 in the brain (HSV-1 group, orange bars with triangles). EAE was induced four weeks after mock treatment (EAE group, blue bars with diamonds) or infection (HSV-1-EAE group, purple bars with squares). Brain homogenates were recovered fourteen days after EAE induction, 45–50 days after HSV-1 infection, or mock treatment alone. The expression of senescence-associated genes was evaluated at the mRNA level by RT-qPCR using the 2−ΔΔCTmethod with β-actin as a reference gene. a Heatmap comparing the mRNA levels of senescence-associated genes in the brain among HSV-1, EAE, and HSV-1-EAE groups. The orange color indicates upregulation while the blue color indicates downregulation. Darker colors indicate stronger effects. Relative mRNA expression of the gene products b Hmgb-1, c Pdrg1, d Cdkn1a, e Cdkn2a, f Lmnb1, g Timp1, h Mmp12, i Ccl2, j Cxcl2, and k Il6 in the different mouse groups compared to the healthy controls. Values represent means ± SEM of two independent experiments (n = 7 animals/group). Log-transformed data were analyzed using one-way ANOVA followed by Dunnett’s post-hoc test; **p < 0.01 and *p < 0.05.
Fig. 4
Fig. 4. Asymptomatic HSV-1 brain infection and EAE, individually or combined, induce DNA damage-related foci in spinal cord neurons.
Spinal cord tissue was harvested 14 days after EAE induction, 45–50 days after HSV-1 infection, or mock-treatment alone for detecting the phosphorylation of histone H2AX (γH2AX) by immunohistochemistry. a Representative images showing DNA damage-related γH2AX foci in neurons (black arrows) and non-neuron cells (blue arrows). GM: gray matter; WM: white matter. b Quantification of γH2AX foci in the nucleus of non-neuron cells in the white matter (analysis separated in right and left columns, upper and lower panels, respectively). c Quantification of γH2AX foci in the nucleus of non-neuron cells in the gray matter (analysis separated in ventral and dorsal horns, upper and lower panels, respectively). d Quantification of γH2AX foci in the nucleus of neuron cells in the gray matter (analysis separated in ventral and dorsal horns upper and lower panels, respectively). White bars with circles represent data from healthy mice, orange bars with triangles represent data from mice with HSV-1 infection, blue bars with diamonds represent data from mice with EAE and purple bars with squares represent data from mice with EAE and HSV-1 infection. Values represent means ± SEM of the percentage of γH2AX-positive cells of four mice per group. Data were analyzed using One-way ANOVA followed by Bonferroni’s post-hoc test for multiple comparisons with healthy control mice (n = 2); ****p < 0.001, **p < 0.01, *p < 0.05.
Fig. 5
Fig. 5. Asymptomatic HSV-1 brain infection and EAE, individually or combined, induce DNA damage-related foci in brain neurons.
Brain tissues from four animals per group were harvested fourteen days after EAE induction or 45–50 days after asymptomatic HSV-1 brain infection or mock treatment alone for detecting the phosphorylation of histone H2AX (γH2AX) by immunofluorescence. a Representative images showing Hoechst nuclei staining (blue), γH2AX straining (green), NeuN staining (red), and image merges. Left: images for each fluorescence channel correspond to 100X magnifications and right: images are shown at a 5X optic zoom of the area outlined in squares with white dashed lines. Scale bars = 10 μm. b Quantification of γH2AX foci in the nucleus of NeuN-positive cells. Values represent means ± SEM of the measurements carried out in at least ten fields per sample. Data were analyzed using one-way ANOVA followed by Bonferroni’s post-hoc test; ****p < 0.0001. c Quantification of the mean fluorescence intensity (MFI) of the NeuN staining. Data were analyzed using Kruskal–Wallis followed by Dunn’s post-hoc test; **p < 0.01, *p < 0.05. White bars with circles represent data from healthy mice, orange bars with triangles represent data from mice with HSV-1 infection, blue bars with diamonds represent data from mice with EAE and purple bars with squares represent data from mice with EAE and HSV-1 infection.
Fig. 6
Fig. 6. Asymptomatic HSV-1 brain infection and following EAE produce HMGB-1 release from the nucleus to the cytoplasm in brain neurons.
Brain and spinal cord tissues from four animals per group were harvested 14 days after EAE induction, 45–50 days after HSV-1 infection, or mock-treatment alone for detecting the expression and release of HMGB-1 by immunofluorescence. a Representative images showing Hoechst nuclei staining (blue), HMGB-1 staining (yellow), NeuN staining (red), and image merges. Left: images in each fluorescence channel correspond to 100X magnifications, and right: images are shown at a 5X optic zoom of the area outlined in squares with white dashed lines. Scale bars = 10 μm. White arrows show the translocation of HMGB-1 from the nucleus to the cytoplasm. b Quantification of the mean fluorescence intensity (MFI) of HMGB-1 in the nucleus of NeuN+ cells in the brain cortex (left), and in the gray matter of the spinal cord (right). c Percentage of NeuN+ cells with HMBG-1 release from the nucleus toward cytoplasm in the brain cortex (left) and in the gray matter of the spinal cord (right). Values represent means ± SEM of the measurements carried out in at least ten fields in the brain tissues and three fields in the spinal cord tissues per sample. Data of MFI were analyzed using one-way ANOVA followed by Bonferroni’s post-test, and data of cytoplasmic HMGB-1 were analyzed using Kruskal–Wallis followed by Dunn’s post-hoc test; ****p < 0.0001, **p < 0.01, *p < 0.05. White bars with circles represent data from healthy mice, orange bars with triangles represent data from mice with HSV-1 infection, blue bars with diamonds represent data from mice with EAE and purple bars with squares represent data from mice with EAE and HSV-1 infection.
Fig. 7
Fig. 7. H3K9me3-associated SAHF formation in brain and spinal cord neurons of mice with asymptomatic HSV-1 brain infection and EAE.
Brain and spinal cord tissues from four animals per group were harvested 14 days after EAE induction, 45–50 days after HSV-1 infection, or mock-treatment alone for detecting the expression of H3K9me3 foci by immunofluorescence. a Representative images showing Hoechst nuclei staining (blue), H3K9me3 staining (green), NeuN marker (red), and image merges. Left: images in each fluorescence channel correspond to 100X magnifications, and right: Images are shown at a 5X optic zoom of the area outlined in squares with white dashed lines. Scale bars = 10 μm. White arrows show senescence-associated heterochromatin foci (SAHF). b Quantification of the distance of each H3K9me3 foci from the nuclear periphery in NeuN+ cells. Values represent means ± SEM of the measurements carried out in at least ten fields in the brain tissues and three fields in the spinal cord tissues per sample. Data were analyzed using One-way ANOVA followed by Bonferroni’s post-hoc test for analysis from brain tissues and Kruskal–Wallis followed by Dunn’s post-hoc test for analysis from spinal cord tissues; ****p < 0.0001, **p < 0.01, *p < 0.05. White bars with circles represent data from healthy mice, orange bars with triangles represent data from mice with HSV-1 infection, blue bars with diamonds represent data from mice with EAE and purple bars with squares represent data from mice with EAE and HSV-1 infection.

References

    1. Dobson R, Giovannoni G. Multiple sclerosis – a review. Eur. J. Neurol. 2019;26:27–40. doi: 10.1111/ene.13819. - DOI - PubMed
    1. Thomas, F. P. in Pathy’s Principles and Practice of Geriatric Medicine. (Sinclair, A. J., Vellas, B. & Morley, J. E. eds) Ch. 70 (Wiley, 2012).
    1. Dimitrov LG. What ’ s new in multiple sclerosis. Br. J. Gen. Pr. 2014;64:612–613. doi: 10.3399/bjgp14X682609. - DOI - PMC - PubMed
    1. Duarte LF, et al. Is there a role for herpes simplex virus type 1 in multiple sclerosis? Microbes Infect. 2023;25:105084. doi: 10.1016/j.micinf.2022.105084. - DOI - PubMed
    1. Leibovitch EC, et al. Herpesvirus trigger accelerates neuroinflammation in a nonhuman primate model of multiple sclerosis. Proc. Nat. Acad. Sci. USA. 2018;115:11292–11297. doi: 10.1073/pnas.1811974115. - DOI - PMC - PubMed

Publication types

MeSH terms

LinkOut - more resources