. 2024 Dec;20(12):1608-1616.
doi: 10.1038/s41589-024-01655-9. Epub 2024 Jul 4.

A CRISPR activation screen identifies FBXO22 supporting targeted protein degradation

Affiliations

A CRISPR activation screen identifies FBXO22 supporting targeted protein degradation

Ananya A Basu et al. Nat Chem Biol. 2024 Dec.

Abstract

Targeted protein degradation (TPD) represents a potent chemical biology paradigm that leverages the cellular degradation machinery to pharmacologically eliminate specific proteins of interest. Although multiple E3 ligases have been discovered to facilitate TPD, there exists a compelling requirement to diversify the pool of E3 ligases available for such applications. Here we describe a clustered regularly interspaced short palindromic repeats (CRISPR)-based transcriptional activation screen focused on human E3 ligases, with the goal of identifying E3 ligases that can facilitate heterobifunctional compound-mediated target degradation. Through this approach, we identified a candidate proteolysis-targeting chimera (PROTAC), 22-SLF, that induces the degradation of FK506-binding protein 12 when the transcription of FBXO22 gene is activated. Subsequent mechanistic investigations revealed that 22-SLF interacts with C227 and/or C228 in F-box protein 22 (FBXO22) to achieve target degradation. Lastly, we demonstrated the versatility of FBXO22-based PROTACs by effectively degrading additional endogenous proteins, including bromodomain-containing protein 4 and the echinoderm microtubule-associated protein-like 4-anaplastic lymphoma kinase fusion protein.


Conflict of interest statement

Competing interests: A.A.B. and X.Z. are named on a patent application related to TPD, held by Northwestern University (US provisional patent application number 63/538,637). The other authors declare no competing interests.

Figures

Extended Data Fig. 1.
Extended Data Fig. 1.. Generation of CRISPR-Cas9 transcriptional activation cells for the discovery of E3 ligases supporting targeted protein degradation.
a, The construct of FKBP12-EGFP and a schematic representation of the generation of FKBP12-EGFP expressing HEK293T cells. b, Structures of Len-SLF and SLF. c, Fluorescence quantification of FKBP12-EGFP levels in HEK293T cells treated with 2 μM of Len-SLF or 20 μM of SLF for 24 hours. Data are presented as mean values +/− SEM (n = 3 biological independent samples). The statistical significance was evaluated through unpaired two-tailed Student’s t-tests, comparing cells treated with Len-SLF or SLF to DMSO. Statistical significance denoted as ***P < 0.001 and ns: not significant. P value is 0.00026. d, The constructs used for the CRISPR-Cas9 transcriptional activation screen. e, Quantitative PCR analysis of IL1B mRNA levels subsequent to the transduction of sgRNAs targeting the promoter regions of the IL1B gene in HEK293T CRISPR-Cas9 transcriptional activation cells. The bar graph (n = 4 technical replicates) is representative of two independent experiments.
Extended Data Fig. 2.
Extended Data Fig. 2.. Gating strategy and procedure of fluorescence-activated cell sorting for the CRISPR-Cas9 transcriptional activation screen.
Cells were gated for singlets using forward and side scatter. GFP+ cells were gated for the subsequent sorting. Cells from the bottom 15% of the GFP population were sorted and harvested.
Extended Data Fig. 3.
Extended Data Fig. 3.. Compound screening to identify candidates for the CRIPSR activation screen.
a, HEK293T cell viability after treatment of FKBP12-directed bifunctional compounds (10 μM, 24 hours). Data are presented as mean values +/− SEM (n = 3 biological independent samples). b, Structures of five FKBP12-directed bifunction compounds that show no significant cytotoxicity (cell viability > 50%) at 10 μM. c, The constructs of FKBP12-EGFP with SFFV and hPGK promoters. d, Fluorescence quantification of FKBP12-EGFP and mCherry levels in HEK293T cells stably expressing FKBP12-EGFP with SFFV or hPGK promoter. The bar graph (n = 8 technical replicates) is representative of two independent experiments with similar results. e, Fluorescence quantification of FKBP12-EGFP/mCherry levels in HEK293T cells stably expressing FKBP12-EGFP with SFFV or hPGK promoter, treated with 2 or 5 μM of candidate bifunctional compounds for 24 hours. Data are presented as mean values +/− SEM (n = 3 biological independent samples for compound treatment, n = 8 biological independent samples for DMSO treatment). The statistical significance was evaluated through unpaired two-tailed Student’s t-tests, comparing cells treated with 22-SLF or Len-SLF to DMSO. Statistical significance denoted as *P < 0.05, ***P < 0.001 and ns: not significant. P values are 0.000011 (2 μM Len-SLF in SFFV), 0.000051 (5 μM Len-SLF in SFFV), 0.039 (2 μM 22-SLF in hPGK), 0.031 (5 μM 22-SLF in hPGK), 0.00011 (2 μM Len-SLF in hPGK) and 0.000014 (5 μM Len-SLF in hPGK). f. Flow cytometry analysis of DMSO-treated cells revealed a silenced GFP population. The gating strategy was the same as described in Extended Data Fig. 2. The result is representative of two independent experiments with similar results.
Extended Data Fig. 4.
Extended Data Fig. 4.. An E3 ligase focused CRISPR-Cas9 transcriptional activation screen identifies DCAF16 supporting KB02-SLF-induced degradation of FKBP12-EGFP_NLS.
a, The construct of FKBP12-EGFP_NLS and a schematic representation of the steps in the CRISPR-Cas9 transcriptional activation screen. b, Volcano plot showing the E3 ligase focused CRISPR-Cas9 transcriptional activation screen for FKBP12-EGFP_NLS degradation after treatment of 2 μM KB02-SLF in HEK293T CRISPR-Cas9 transcriptional activation cells for 24 hours (n = 3 biological independent samples). P values were calculated by two-sided t test without adjustment.
Extended Data Fig. 5.
Extended Data Fig. 5.. 22-SLF promotes FBXO22-dependent proteasomal degradation of FKBP12.
a, Gene expression ratio values of FBXO22 and CRBN between tumor and normal samples. Data is obtained from GEPIA (http://gepia.cancer-pku.cn/). Full names of the abbreviations are shown in Supplementary Table 1. b, Genomic PCR confirms FBXO22 knockout in A549, MDA-MB-231 and PC3 cells. The result is representative of two independent experiments with similar results. c, Global proteomic analysis confirms FBXO22 knockout in A549, MDA-MB-231 and PC3 cells. The result is representative of two independent experiments with similar results. d, 22-SLF promoted reduction in FKBP12 levels in MDA-MB-231 and PC3 wildtype, but not FBXO22 knockout cells. The bar graph represents quantification of the FLAG-FKBP12/HSP90 protein content. Data are presented as mean values (n = 2 biological independent samples). e, Global proteomic analysis in A549 wildtype and FBXO22 knockout cells treated with 22-SLF (2 μM, 24 hours) (n = 3 biological independent samples). P values were calculated by two-sided t test and adjusted using Benjamini-Hochberg correction for multiple comparisons. f, Bar graph quantification showing the change in KDM4A and KDM4B upon 22-SLF treatment in A549 wildtype and FBXO22 knockout cells. Data are presented as mean values +/− SEM (n = 2 biological independent samples for DMSO treated samples, n = 3 biological independent samples for 22-SLF samples). The statistical significance was evaluated through unpaired two-tailed Student’s t-tests, comparing cells treated with 22-SLF to DMSO. Statistical significance denoted as *P < 0.05 and ns: not significant. P value is 0.044.
Extended Data Fig. 6.
Extended Data Fig. 6.. 22-SLF rescues Len-SLF-induced FKBP12 degradation in HEK293T FBXO22 knockout cells.
a, 22-biotin-conjugated streptavidin pull-down with lysates of HA-FBXO22-expressing HEK293T cells followed by proteomic analysis revealed FBXO22 as one of the protein targets bound by 22-biotin. Data are presented as mean values (n = 2 biological independent samples). b, HEK293T FBXO22 knockout cells pretreated with 22-SLF (0.1–25 μM, 2 hours) were treated with 0.5 μM of Len-SLF for 4 hours. The graph represents quantification of the FLAG-FKBP12/HSP90 protein content. Data are presented as mean values (n = 2 biological independent samples).
Extended Data Fig. 7.
Extended Data Fig. 7.. FBXO22 C227 and C228 are involved in 22-SLF-mediated degradation of FKBP12.
a, Interactome studies of FBXO22 wildtype and C227AC228A double mutant revealed that both FBXO22 wildtype and C227AC228A double mutant were assembled into the SKP1-CUL1-RBX1 E3 complex. Data are presented as mean values (n = 2 biological independent samples). b, Global proteomic analysis in HEK293T cells expressing HA-FBXO22 wildtype versus C227AC228A double mutant treated with 22-SLF (0.5 μM, 24 hours) (n = 2 biological independent samples for DMSO treated samples, n = 3 biological independent samples for 22-SLF samples). P values were calculated by two-sided t test and adjusted using Benjamini-Hochberg correction for multiple comparisons.
Extended Data Fig. 8.
Extended Data Fig. 8.. Evaluation of the impact of FBXO22 K125, V230, and N257 on FKBP12 degradation induced by 22-SLF.
Single mutation of K125, V230 or N257 to alanine in FBXO22 did not block 22-SLF-induced degradation of FKBP12. The bar graph represents quantification of the FLAG-FKBP12/HSP90 protein content. Data are presented as mean values (n = 2 biological independent samples).
Extended Data Fig. 9.
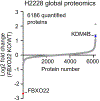
Extended Data Fig. 9.. Global proteomic analysis in H2228 wildtype and FBXO22 knockout cells.
Proteome in H2228 wildtype and FBXO22 knockout cells was extracted, digested by LysC and trypsin, labeled by TMT tags, and analyzed via MS. Data are presented as mean values (n = 2 biological independent samples).
Extended Data Fig. 10.
Extended Data Fig. 10.. The acrylamide variant of 22-SLF, 22a-SLF, induced the degradation of FKBP12.
a, Structure of 22a-SLF. b, Comparison of FKBP12 degradation by 22-SLF and 22a-SLF. HEK293T cells expressing HA-FBXO22 were treated with 0.5, 1, or 2 μM of 22-SLF or 22a-SLF for 8 hours. The graph represents quantification of the FLAG-FKBP12/HSP90 protein content. Data are presented as mean values (n = 2 biological independent samples).
Fig. 1.
Fig. 1.. An E3 ligase focused CRISPR-Cas9 transcriptional activation screen identifies FBXO22 that supports 22-SLF-induced reduction in FKBP12-EGFP expression levels.
a, Schematic representation of the steps in the CRISPR-Cas9 transcriptional activation screen. FACS, fluorescence-activated cell sorting. NGS, next-generation sequencing. b, Structure of 22-SLF. c, Volcano plot showing the E3 ligase focused CRISPR-Cas9 transcriptional activation screen for FKBP12-EGFP degradation after treatment of 2 μM of 22-SLF for 24 hours (n = 3 biological independent samples). LFC, log2 fold change. P values were calculated by two-sided t test without adjustment. d, Quantitative PCR analysis of FBXO22 mRNA levels subsequent to the transduction of sgRNAs targeting the promoter regions of FBXO22 gene. The bar graph (n = 3 technical replicates) is representative of two independent experiments. e, Fluorescence quantification of FKBP12-EGFP levels in HEK293T CRISPR-Cas9 transcriptional activation cells transduced with FBXO22-activating sgRNAs, subsequent to the treatment of 2 μM of 22-SLF for 24 hours. Data are presented as mean values +/− SEM (n = 3 biological independent samples). The statistical significance was evaluated through unpaired two-tailed Student’s t-tests, comparing cells treated with 22-SLF to DMSO. Statistical significance denoted as ***P < 0.001, ns: not significant. P values are 0.00057 (sgRNA#1) and 0.00011 (sgRNA#2).
Fig. 2.
Fig. 2.. 22-SLF promotes FBXO22-dependent proteasomal degradation of FKBP12.
a, 22-SLF-induced FKBP12 degradation is dependent on FBXO22 and blocked by MG132 (1 μM), MLN4924 (1 μM) and SLF (25 μM) (n = 3 biological independent samples). The bar graph represents quantification of the FLAG-FKBP12/HSP90 protein content. Data are presented as mean values +/− SEM. b, Dose-dependent degradation of FKBP12 by 22-SLF. HEK293T cells expressing HA-FBXO22 were treated with 0.025 – 15 μM of 22-SLF for 8 hours. The graph represents quantification of the FLAG-FKBP12/HSP90 protein content. Data are presented as mean values (n = 2 biological independent samples). c, Time-dependent degradation of FKBP12 by 22-SLF. The bar graph represents quantification of the FLAG-FKBP12/HSP90 protein content. Data are presented as mean values (n = 2 biological independent samples). d, 22-SLF (2 μM) induced FKBP12 degradation in A549 wildtype, but not FBXO22 knockout cells (n = 3 biological independent samples). The bar graph represents quantification of the FLAG-FKBP12/HSP90 protein content. Data are presented as mean values +/− SEM. e, Global proteomic analysis in A549 wildtype and FBXO22 knockout cells treated with 22-SLF (2 μM) for 24 hours (n = 2 biological independent samples for DMSO treatment, n = 3 biological independent samples for 22-SLF treatment). f, Structure of 22-biotin. g, 22-biotin-conjugated streptavidin pull-down with lysates of A549 cells pretreated with 22-SLF (2, 10 or 50 μM, 2 hours) followed by Western blot analysis of endogenous FBXO22. The result is representative of two independent experiments with similar results. WCL, whole cell lysates.
Fig. 3.
Fig. 3.. FBXO22 C227 and C228 are involved in 22-SLF-mediated degradation of FKBP12.
a, Competitive cysteine-directed ABPP measured the degree of blockade of IA-DTB-modified cysteines by 22-SLF. Data are presented as mean values (n = 2 biological independent samples). b, Quantification of four IA-DTB-modified peptides in FBXO22 treated with DMSO or 22-SLF. Data are presented as mean values (n = 2 biological independent samples). c, Single mutation of C227 or C228 to alanine in FBXO22 partially blocked 22-SLF-induced degradation of FKBP12, while mutating both C227 and C228 to alanine in FBXO22 completely abolished the degradation. The bar graph represents quantification of the FLAG-FKBP12/HSP90 protein content. Data are presented as mean values +/− SEM (n = 3 biological independent samples). d, Global proteomic analysis in HEK293T cells expressing HA-FBXO22 wildtype or C227AC228A double mutant treated with 22-SLF (0.5 μM, 24 hours). Data are presented as mean values (n = 2 biological independent samples for DMSO treatment, n = 3 biological independent samples for 22-SLF treatment). e, Modeling study reveals several hydrogen bond interactions between the electrophilic portion of 22-SLF and a pocket in FBXO22 involving C227 and C228. f, Sequence alignment of human FBXO22 (aa 219–230) and mouse FBXO22 (aa 218–229). g, Mouse FBXO22 supported 22-SLF-induced FKBP12 degradation. The bar graph represents quantification of the FLAG-FKBP12/HSP90 protein content. Data are presented as mean values (n = 2 biological independent samples). h, Mutation of both C226 and C227 in mouse FBXO22 abolished 22-SLF-induced degradation of FKBP12. The bar graph represents quantification of the FLAG-FKBP12/HSP90 protein content. Data are presented as mean values (n = 2 biological independent samples).
Fig. 4.
Fig. 4.. 22-SLF induces the formation of a ternary complex involving 22-SLF, FKBP12 and FBXO22.
a, A co-immunoprecipitation assay reveals that HA-FBXO22 wildtype, but not HA-FBXO22 C227AC228A double mutant, co-immunoprecipitated with FLAG-FKBP12 in the presence of 22-SLF and MG132. The bar graph represents quantification of the immunoprecipitated HA-FBXO22 protein content compared to HA-FBXO22 protein in WCL. Data are presented as mean values (n = 2 biological independent samples). b, c, A FKBP12-directed enrichment proteomic analysis revealed that HA-FBXO22 wildtype and its associated components in the SKP1-CUL1-RBX1 E3 complex, but not HA-FBXO22 C227AC228A double mutant, co-immunoprecipitated with FLAG-FKBP12 in the presence of 22-SLF (2 μM) and MG132 (5 μM). Data are presented as mean values (n = 2 biological independent samples).
Fig. 5.
Fig. 5.. Harnessing FBXO22 for the degradation of BRD4 and EML4-ALK.
a, Structure of 22-JQ1. b, 22-JQ1 (1 and 2 μM, 24 hours) induced BRD4 degradation in A549 wildtype, but not FBXO22 knockout cells. The bar graph represents quantification of the BRD4/β-actin protein content. Data are presented as mean values (n = 2 biological independent samples). c, Global proteomic analysis in A549 wildtype and FBXO22 knockout cells treated with 2 μM of 22-JQ1 for 24 hours. Data are presented as mean values (n = 2 biological independent samples). d, Structure of 22-TAE. e, 22-TAE (1 and 2 μM, 24 hours) induced EML4-ALK degradation in H2228 FBXO22 wildtype, but not knockout cells. The bar graph represents quantification of the EML4-ALK/β-actin protein content. Data are presented as mean values (n = 2 biological independent samples).

Update of

References

    1. Lai AC & Crews CM Induced protein degradation: an emerging drug discovery paradigm. Nat Rev Drug Discov 16, 101–114 (2017). - PMC - PubMed
    1. Nalawansha DA & Crews CM PROTACs: An Emerging Therapeutic Modality in Precision Medicine. Cell Chem Biol 27, 998–1014 (2020). - PMC - PubMed
    1. Kronke J. et al. Lenalidomide causes selective degradation of IKZF1 and IKZF3 in multiple myeloma cells. Science 343, 301–305 (2014). - PMC - PubMed
    1. Lu G. et al. The myeloma drug lenalidomide promotes the cereblon-dependent destruction of Ikaros proteins. Science 343, 305–309 (2014). - PMC - PubMed
    1. Kannt A. & Dikic I. Expanding the arsenal of E3 ubiquitin ligases for proximity-induced protein degradation. Cell Chem Biol 28, 1014–1031 (2021). - PubMed
Methods-only References
    1. Perez-Riverol Y. et al. The PRIDE database resources in 2022: a hub for mass spectrometry-based proteomics evidences. Nucleic Acids Res 50, D543–D552 (2022). - PMC - PubMed

MeSH terms

LinkOut - more resources