. 2024 Aug;26(8):1322-1335.
doi: 10.1038/s41556-024-01452-5. Epub 2024 Jul 4.

Direct observation of translational activation by a ribonucleoprotein granule

Affiliations

Direct observation of translational activation by a ribonucleoprotein granule

Ruoyu Chen et al. Nat Cell Biol. 2024 Aug.

Abstract

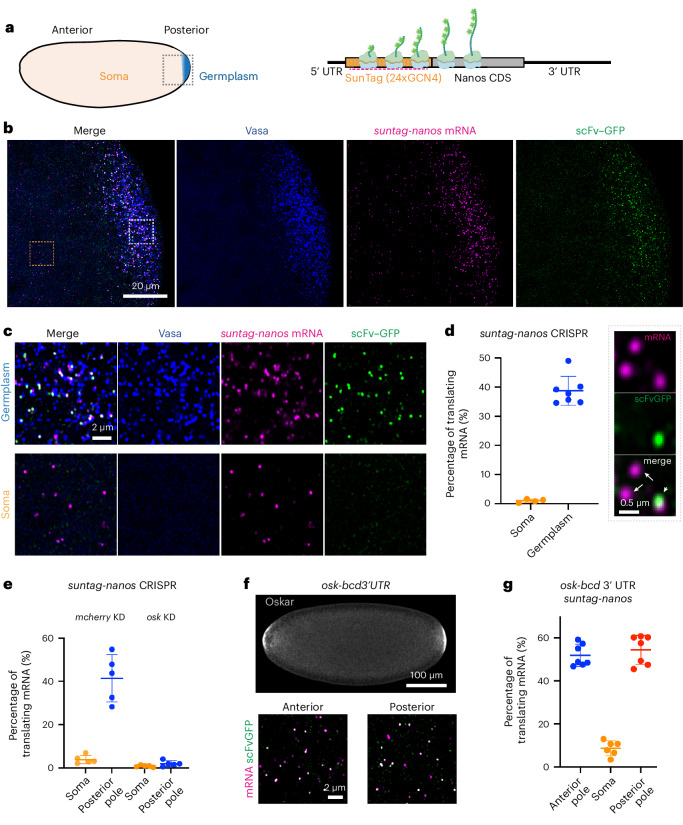
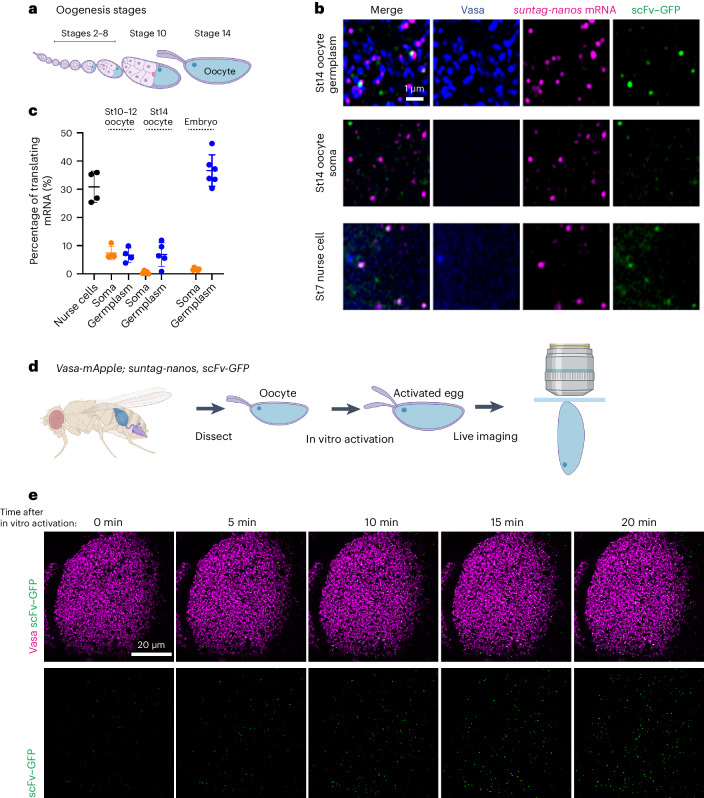
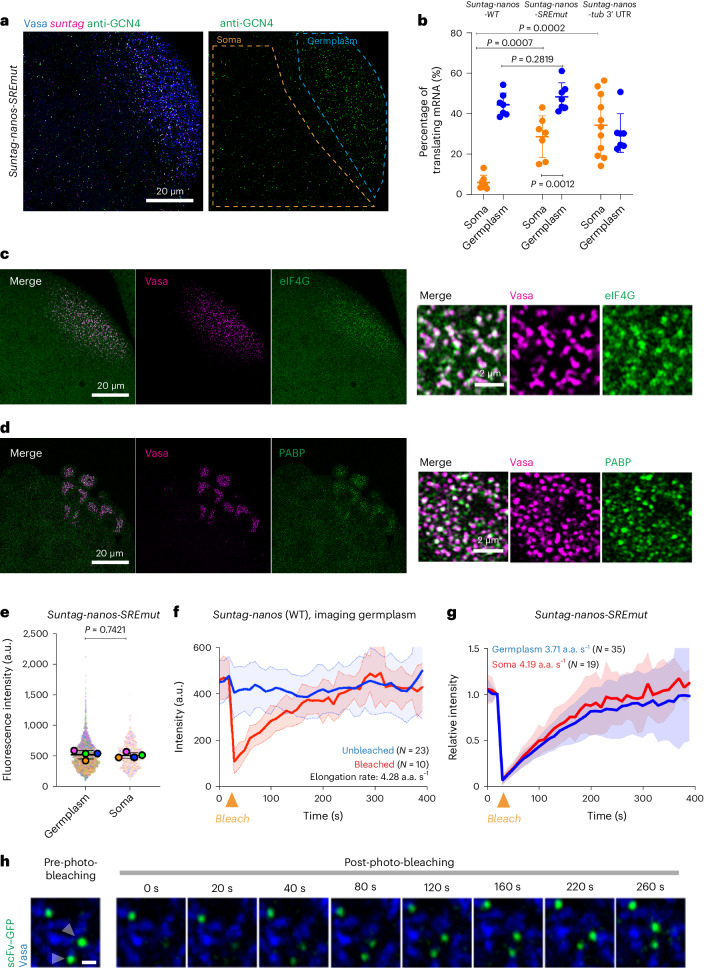
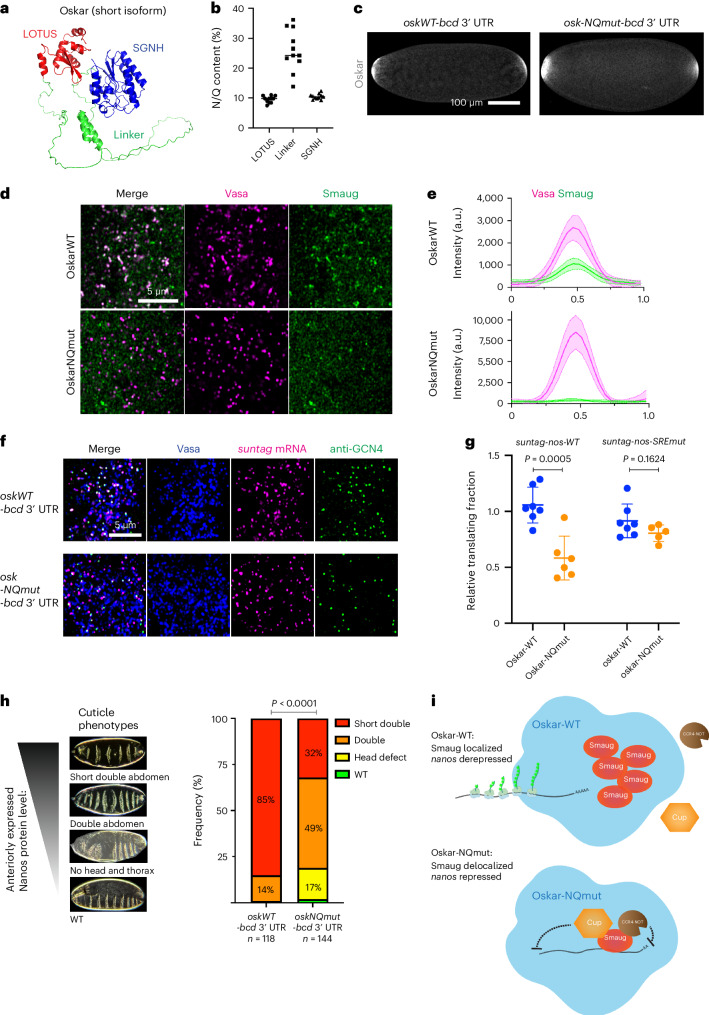
Biomolecular condensates organize biochemical processes at the subcellular level and can provide spatiotemporal regulation within a cell. Among these, ribonucleoprotein (RNP) granules are storage hubs for translationally repressed mRNA. Whether RNP granules can also activate translation and how this could be achieved remains unclear. Here, using single-molecule imaging, we demonstrate that the germ cell-determining RNP granules in Drosophila embryos are sites for active translation of nanos mRNA. Nanos translation occurs preferentially at the germ granule surface with the 3' UTR buried within the granule. Smaug, a cytosolic RNA-binding protein, represses nanos translation, which is relieved when Smaug is sequestered to the germ granule by the scaffold protein Oskar. Together, our findings uncover a molecular process by which RNP granules achieve localized protein synthesis through the compartmentalized loss of translational repression.


Conflict of interest statement

The authors declare no competing interests.

Figures

Fig. 1
Fig. 1. Imaging translation of nanos mRNA in Drosophila embryos.
a, Left: schematic of a Drosophila embryo. Germplasm (blue) is located at the posterior pole of the embryo. The dashed square represents the region imaged by confocal microscopy and presented in b. Right: schematic of a translating suntag-nanos mRNA. A repetitive array of SunTag epitopes is added to the N-terminus of the nanos CDS. Nascent SunTag peptides are detected by scFv–GFP binding and suntag mRNA is detected by smFISH probes (magenta dashed line). b, A representative confocal image of the posterior pole of an embryo expressing Vasa–mApple (blue), suntag-nanos (mRNA stained by suntag smFISH probes, magenta), and scFv–GFP (green). Outlined regions in germplasm and soma are magnified and presented in c. c, Magnified images of germplasm and soma show the different translation activities in these two parts of the embryo. d, Left: quantification of the percentage of translating mRNA in the soma (n = 4) and the germplasm (n = 7). Right: zoomed confocal images showing examples of a translating mRNA that co-localizes with scFv–GFP signal (arrowhead) and two non-translating mRNA that do not co-localize with scFv–GFP signal (arrows). e, Quantification of suntag-nanos mRNA translation in the soma and the posterior pole of embryos with mCherry knockdown (KD) or osk KD. n = 5 for all experiments. f, Osk-bcd 3′ UTR expression induces germplasm and translation of suntag-nanos mRNA at the anterior pole. Top: Oskar protein is immunostained with anti-Oskar antibody. Bottom: translation of suntag-nanos mRNA in native germplasm at the posterior and ectopic germplasm at the anterior, which are quantified in g. n = 7 (anterior), 6 (soma) and 7 (posterior). In d,e,g, the data are the mean ± s.d.; n, number of the embryos used for measurement. Source data
Fig. 2
Fig. 2. Temporal regulation of localized translation in germplasm.
a, Schematic of Drosophila oogenesis stages. b, Representative images of germplasm (top) and soma (middle) in stage (St)14 oocyte and cytoplasm of a stage 7 nurse cell (bottom) expressing suntag-nanos and scFv–GFP. Blue, Vasa; magenta, suntag smFISH; green, scFv–GFP. c, Translating fraction of suntag-nanos mRNA in stage 4–10 nurse cells (n = 4 egg chambers), soma and germplasm of stage 10–12 (developing) oocytes (n = 4 oocytes), stage 14 (mature) oocytes (n = 5 oocytes) and stage 1–2 embryos (n = 6 embryos). The data are the mean ± s.d. d, Protocol of in vitro activation of oocytes and live imaging. Mature oocytes are dissected from Vasa-mApple/+; suntag-nanos, scFv-GFP/+ flies and activated with 30% Robb’s buffer (Methods). Activated eggs are mounted onto a coverslip and imaged by confocal microscopy. e, Representative time-lapse images of the germplasm of an activated egg with an increasing number of polysome (green foci). Germplasm is marked by Vasa–mApple (magenta), and SunTag is detected by endogenous scFv–GFP (green). The top shows the merged image, and the bottom shows scFv–GFP channel only. Schematics in a and d were generated with BioRender (https://www.biorender.com/). Source data
Fig. 3
Fig. 3. Spatial distribution of the polysome and orientation of translating mRNA.
a, Left: schematic of the live imaging setup. Right: a live image of germplasm. Blue, Vasa; green, scFv–GFP. b, Spatiotemporal tracking of germ granules and attached translation foci. Two pairs of germ granules (arrowheads) and translation foci (arrows) were tracked for 400 s, and showed co-movement throughout the movie. cf, Orientation of translating mRNA. Translating suntag-nanos mRNAs in embryos from Vasa-mApple/+; suntag-nanos, scFv-GFP/Df(nanos) flies are detected with smFISH against suntag (c) and nanos 3′ UTR (e). Example germplasm images are shown in c and e. The orthogonal views of the outlined regions are shown on the right. Scale bar for the orthogonal views: 0.3 µm. Blue, Vasa; magenta, mRNA smFISH; green, scFv–GFP. The distributions of scFv–GFP and smFISH foci were mapped and plotted in relative frequency histograms overlaid with KDEs in d and f. The x axis refers to the distance of foci centroids to the border of the closest granule; zero marks the granule border; a negative value denotes being inside a granule and a positive value denotes outside. In total, 12,684 smFISH foci and 12,733 scFv–GFP foci from images of 7 embryos were mapped in d. A total of 5,663 smFISH foci and 5,649 scFv–GFP foci from images of 3 embryos are mapped in f. g, Detecting the 5′ and 3′ sequence of native nanos mRNA in wild-type (WT) embryos. The schematic shows the probes used for smFISH. 5′ probe signal (green) coats around the 3′ probe signal (magenta) and germ granule marker Oskar–GFP (blue). The orthogonal views of the outlined region are shown on the right. Scale bar, 0.3 µm. h, Averaging germ granule images showed the distribution pattern of 5′ and 3′ of nanos mRNA relative to germ granules. Using the Oskar channel as a reference, 40 images of germ granules from 3 embryos were randomly picked, made into a z-stack and averaged. i, PCC measurement showing a stronger co-localization of Oskar with nanos 3′ signal than 5′. n = 4 embryos for both conditions. The data are the mean ± s.d. Statistics: two-tailed Welch’s t-test. Source data
Fig. 4
Fig. 4. mRNA positioning correlates with translation on germ granules.
a, Example image of translating (arrows) and non-translating (arrowheads) mRNA. Blue, Vasa; magenta, suntag mRNA; green, scFv–GFP. b, Relative frequency histogram with KDE curve of translating and non-translating mRNA distribution in germplasm. A total of 12,684 translating and 19,712 non-translating foci from 7 images over 7 embryos were plotted. c, The translating fraction in each bin of the x axis from seven embryos was calculated and plotted. The data are the mean ± s.d. The average translating fraction in the entire germplasm is indicated as the dashed line. The translating fractions on the granule surface (0 ≤ x ≤ 200 nm) were compared with the ones within granules (x < 0) or ones not localized to granules (x > 400 nm) using two-tailed Welch’s t-test. d, A model of the predicted orientation and distribution of translating and non-translating mRNAs in germ granules. e, Distribution of total suntag-nanos mRNA stained by suntag probes in stage 1 embryos and stage 14 oocytes. A total of 6,468 foci from images of 4 oocytes and 32473 foci from images of 7 embryos were mapped. f, Detecting the 5′ and 3′ sequence of native nanos mRNA in wild-type oocytes. The orthogonal views of the outlined region are shown on the right. Scale bar, 0.3 µm. g, PCC analysis between nanos 3′ and 5′ signals in oocytes and embryos. n = 4 embryos and 4 oocytes. h, PCC analysis of Oskar signal with nanos 5′ or 3′ signal in oocytes. Statistics in g and h: two-tailed Welch’s t-test. n = 4 oocytes for both conditions. In g and h, the data are the mean ± s.d. i, Distribution of RPS6 (anti-RPS6, magenta) in germplasm. The germ granules are marked by VasaGFP (green). j, z-stacks of 40 images of germplasm with germ granules at the centre or without germ granules were made and z-projected by summing slices. Scale bar, 0.25 µm. k, suntag mRNA (magenta) distribution on germ granules (Vasa) in embryos treated with DMSO (control) and harringtonine. l, Relative frequency histogram with KDE of total suntag smFISH foci distribution in embryos treated with DMSO (2,618 foci from 5 embryos) or harringtonine (8,545 foci from 4 embryos). Source data
Fig. 5
Fig. 5. Kinetics of suntag-nanos translation.
a, Example image of the posterior of an embryo expressing Vasa–mApple (blue), nanos-suntag-SREmut (suntag smFISH, magenta). SunTag is detected by anti-GCN4 (green). An image of the anti-GCN4 channel is shown on the right with germplasm and soma outlined. b, Translating fractions in embryos from flies expressing transgenic suntag-nanos-WT (soma n = 6, germplasm n = 7), suntag-nanos-SREmut (soma and germplasm n = 7) or suntag-nanos-tub 3′ UTR (soma n = 11, germplasm n = 7). The data are the mean ± s.d. Pairwise statistical comparisons were conducted using two-tailed Welch’s t-test. c, Left: the posterior of an embryo expressing Vasa–-mCherry (magenta) and eIF4G–GFP (green), and zoomed images of germplasm (right), showing the enrichment of eIF4G to germ granules. d, Left: the posterior of an embryo expressing Vasa–-mCherry (magenta) and yellow fluorescent protein (YFP)-tagged PABP (green), and zoomed images of germplasm (right), showing the association of PABP puncta with germ granules. e, The intensities of polysomes (anti-GCN4 staining) in soma and germplasm of embryos from flies expressing UAS-suntag-nanos-SREmut. Quantification results from four embryos were plotted in a super-plot. Individual dots represent the intensities of individual polysomes, each colour-coded by the embryo. Each coloured circle represents the mean intensity of each embryo. The black lines and error bars are the mean ± s.d. of the four embryos. Statistical comparison was performed on the mean intensities of individual embryos using two-tailed Welch’s t-test. f, The intensities of polysomes over time during live imaging suntag-nanos mRNA translation with (red curve, mean ± s.d. of 10 curves from 3 embryos) or without (blue curve, mean ± s.d. of 23 curves from 5 embryos) photo-bleaching when time is 30 s. The elongation rate calculated from the plot is indicated. g, Polysome intensities of suntag-nanos-SREmut mRNA in germplasm (blue curve, mean ± s.d. of 35 curves from 5 embryos) and soma (red curve, mean ± s.d. of 19 curves from 6 embryos) over time with photo-bleaching when time is 30 s. The elongation rates calculated from the plot are indicated. Note that elongation rates are not notably different between wild-type and SREmut RNA. h, Representative time-lapse image of FRAP of two translation sites (arrowheads). Blue, Vasa; green, scFv–GFP. Scale bar, 500 nm. Source data
Fig. 6
Fig. 6. Oskar linker region controls Smaug localization and nanos translation.
a, AlphaFold structure model of short Oskar protein, with LOTUS domain in red, SGNH-like domain in blue and linker region in green. b, Percentage of glutamine (Q) and asparagine (N) in three regions of short Oskar proteins from 11 Drosophila species. Each dot represents the Oskar protein of a particular Drosophila species. c, Embryos expressing Oskar-WT/NQmut-bcd 3′ UTR are immunostained with anti-Oskar antibody. d, Distribution of Smaug in germplasm. Images of germplasm induced by ectopic Oskar-WT or Oskar-NQmut at the anterior pole. Germ granules are labelled by Vasa–mApple (magenta). Smaug is visualized with Smaug–GFP (green). e, Intensity profiles of Vasa–mApple (magenta) and Smaug–GFP (green) along the lines across the germ granules induced by Oskar-WT or Oskar-NQmut. The data are the mean ± s.d. of 20 germ granules from 3 embryos for each genotype. f, Representative images showing the translation of suntag-nanos mRNA in germplasm induced by Oskar-WT or Oskar-NQmut. Blue, Vasa; magenta, suntag smFISH; green, anti-GCN4. g, Fraction of suntag-nanos-WT or suntag-nanos-SREmut mRNA translated in anterior germplasm induced by Oskar-WT or Oskar-NQmut. Each dot represents the normalized measurement of an embryo where the translating fraction in the anterior germplasm is divided by the translating fraction in the native germplasm at the posterior. Statistical comparisons between Oskar-WT and NQmut were performed by two-tailed t-test. nnanosWT-OskarWT = 7, nnanosWT-OskarNQ = 6, nnanosSRE-OskarWT = 7, nnanosSRE-OskarNQ = 5. The data are the mean ± s.d. h, Cuticle phenotypes generated by Oskar-WT/NQmut-bcd 3′ UTR. The images show a range of cuticle phenotypes corresponding to different levels of anteriorly expressed Nanos protein. The bar graph shows the frequency of each cuticle phenotype caused by Oskar-WT/NQmut-bcd 3′ UTR expression. Statistical comparison was performed using chi-square test. i, Oskar mediates Smaug localization and translational derepression of nanos mRNA. With wild-type Oskar, Smaug, but not its co-factors for translational repression (Cup/CCR4-NOT), localized to germ granules. Localized Smaug is dysfunctional in translational repression, allowing the translation of nanos mRNA. In Oskar-NQmut germplasm, Smaug loses localization in germ granules but gains functionality inside germ granules, thus repressing the translation of nanos mRNA. Source data
Extended Data Fig. 1
Extended Data Fig. 1. Optimization and validation of the suntag-nanos system.
a, Schematic of CRISPR knocked-in suntag-nanos allele. b, Images of germplasm in embryos expressing suntag-nanos and (top) scFv-sfGFP (super-folder GFP) or (bottom) monomeric msGFP2 (green). Suntag mRNA is stained by suntag probes (magenta). ScFv-sfGFP showed puncta of GFP signals (arrowheads) which are not co-localized with mRNA signal and thus are not translating sites. ScFv-msGFP2, which is used throughout this study, strongly reduces the aggregation. c, The percentage of bright GFP foci co-localized with mRNA. Large aggregates of scFv-sfGFP colocalize rarely with RNA (~30%) (n = 3 embryos). With scFv-msGFP2, the majority of GFP foci are associated with RNA (80%-90%) and most likely represent polysomes (n = 7 embryos). Data are the mean ± s.d. d, Embryos expressing suntag-nanos and scFv-GFP (green) treated with 20 mM HEPES (control), 10 mg/ml puromycin, or 100 µg/ml harringtonine. Treated embryos were aged for at least 15 min before fixation and staining with suntag probes (magenta). Source data
Extended Data Fig. 2
Extended Data Fig. 2. Quantitative detection of SunTag with anti-GCN4 versus scFv-GFP.
a, Schematics of stage-1, stage-3, and stage-5 embryos. Germplasm or pole cells are labeled in blue. Outlined regions are imaged and presented in panel (B). b, Example images of stage-1, stage-3, and stage-5 embryos expressing suntag-nanos. SunTag is stained by anti-GCN4 (green); suntag mRNA is stained by smFISH (magenta); germplasm or pole cells are marked by Vasa-mApple (blue). c, Images of a stage-1 embryo expressing suntag-nanos stained by anti-GCN4 (top) and a stage-1 embryo from a w1118 female stained by anti-Nanos (bottom). d, Images of germplasm in stage-1 embryos (top) and pole cells in stage-5 embryos expressing suntag-nanos. SunTag (green) is stained by anti-GCN4 (left) or by endogenous scFv-GFP (right); suntag mRNA is stained by smFISH (magenta). e, Quantification of the percentage of mRNA foci co-localized with SunTag staining signal in stage-1 germplasm and stage-5 pole cells when SunTag is stained by scFv-GFP or anti-GCN4. nst1-scFv = 6, nst1-GCN4 = 7, nst5-scFv = 5, nst5-GCN4 = 4; n refers to the number of embryos. Data are the mean ± s.d. Source data
Extended Data Fig. 3
Extended Data Fig. 3. Suntag-nanos mRNA translation depends on germplasm.
a, Images of embryos expressing suntag-nanos with mcherry (control) knockdown (top) or osk knockdown (bottom). SunTag is stained by anti-GCN4 (green) and germplasm is marked by Vasa-mApple (magenta). b, Images of embryos expressing Vasa-mApple and osk-bcd3′UTR, forming germplasm and localizing nanos mRNA at the anterior pole. Germplasm is marked by Vasa-mApple (magenta). Endogenous nanos mRNA is stained by smFISH probes against nanos (green). Source data
Extended Data Fig. 4
Extended Data Fig. 4. Granule segmentation and distance measurement.
a, Images of germ granules are segmented with the ilastik program. The top shows the original grayscale images of Vasa-mApple at the posterior pole of an embryo (left) and zoomed image of the outline region in the germplasm (right). The bottom shows the black-and-white binary images of segmented germ granules (granules in white). b, Schematic of the distance measurement program. The granule surface is defined after segmentation by ilastik. The coordinates of mRNA smFISH or scFv-GFP/anti-GCN4 spots are determined by FISH-Quant and used to measure the distance to the closest granule surface. The schematic is drawn in 2D but the actual data and measurement are in 3D. c-f, Control and validation experiments of distance measurement. (Left) representative images of germplasm with germ granules marked by Vasa-mApple (blue). Magenta: c suntag mRNA smFISH; d is the same image as c with mRNA channel rotated by 180° to shuffle the mRNA distribution; e has the same Vasa channel image as c with one million simulated points randomly distributed within the image; f smFISH of osk mRNA, which is not a component of germ granules. The distributions of mRNA foci or simulated points are plotted in the relative frequency histograms on the right. The x-axis refers to the distance of foci centroids to the border of the closest granule; the zero marks the granule border; a negative value denotes being inside a granule and a positive value denotes outside. Numbers of foci plotted: c, 415 foci from one embryo; d, 563 foci from one embryo; e, 249672 foci from one embryo; f, 8078 foci from four embryos. g, The distributions of mRNA foci or simulated points in (c-f) are plotted together as a kernel density estimate (KDE) plot. The distributions of shuffled mRNA, random points, and osk mRNA show a shift away from the surface of germ granules when compared to suntag-nanos mRNA. The ticks on the x-axis represent the mean values of the distributions. Source data
Extended Data Fig. 5
Extended Data Fig. 5. Translation regulation of suntag-nanos is mediated by nanos 3′UTR.
a, Schematics of transgenic constructs of UAS-suntag-nanos, UAS-suntag-nanos-SREmut, and UAS-suntag-nanos-tubulin3′UTR. The red asterisks in nanos 3′UTR represent the two SREs mutated in the construct. b, Representative images of embryos expressing suntag-nanos (top), suntag-nanos-SREmut (middle), and suntag-nanos-tubulin3′UTR (bottom). Note that the translation activities in the soma of embryos expressing suntag-nanos-SREmut and suntag-nanos-tubulin3′UTR are higher than suntag-nanos. Blue, Vasa; magenta, suntag smFISH; green, anti-GCN4. Source data
Extended Data Fig. 6
Extended Data Fig. 6. Quantification of the intensity of polysomes, ribosome occupancy, and translation elongation.
a, Germplasm of an embryo expressing suntag-nanos flies with SunTag detected by anti-GCN4. The polysomes (arrows) have stronger fluorescence intensities and are co-localized with the mRNA signal (not shown). Individual fully synthesized SunTag-Nanos proteins (examples pointed out by arrowheads) have lower intensities and are not co-localized with mRNA. b, Fluorescence intensities of polysomes and single SunTag-Nanos protein, extracted from FISH-Quant analysis (see Methods). Data from five embryos, each represented by a different color, are plotted as a super-plot. Color-filled circles represent the mean values of the embryos. c, Calculated ribosome occupancy on suntag-nanos mRNA using data from b. Data are the mean ± s.d. d, Theoretical process of fluorescence recovery after photo-bleaching (FRAP). Before photo-bleaching, suntag-nanos mRNA is translated at a steady state with SunTag bound by fluorescent scFv-GFP (phase 1). Photo-bleaching diminishes the fluorescence of bound scFv-GFP (phase 2). Newly synthesized SunTag epitopes after photo-bleaching bind fluorescent scFv-GFP, causing fluorescence recovery of the polysome. Assuming a constant elongation rate, the initial phase of recovery is linear (phase 3). When the peptide that contains the first SunTag synthesized post-bleaching leaves polysome, which counteracts the increase of newly synthesized SunTag, the increase of signal starts to slow down (phase 4). When the first ribosome loaded after photo-bleaching finishes the translation, the signal reaches a plateau (phase 5) with the same intensity as before photo-bleaching because all the SunTags are bound by fluorescent scFv-GFP again. e, A hypothetical FRAP curve (top) based on the theoretical FRAP process, and the FRAP experimental data (bottom, same as Fig. 3e, Data are the mean ± s.d.), which shows a similar curve as the theoretical curve. Source data
Extended Data Fig. 7
Extended Data Fig. 7. Distribution of Smaug and ME31B.
a, Stage-2 (top) and stage-4 (bottom) embryos expressing Vasa-mApple and Smaug-GFP, showing the morphology and distribution of Smaug (green) in soma and germplasm. In the soma, Smaug forms heterogeneous puncta. In germplasm, Smaug is enriched in germ granules (magenta). b, Stage-2 (top) and stage-4 (bottom) embryos expressing Vasa-mApple and ME31B-GFP, showing the distribution of ME31B (green). At stage 2, ME31B is homogeneously distributed throughout the embryo. At stage 4 and later, ME31B forms large and heterogeneous clusters in the soma and forms small clusters associated with germ granules (magenta) in pole cells, as shown in the zoomed image of the outlined area. The averaged line scan of five granules from 2 embryos for each stage was shown. Data are the mean ± s.d. Source data
Extended Data Fig. 8
Extended Data Fig. 8. Distribution of Cup, CCR4, and NOT3.
a, Embryos expressing Cup-YFP (green) and Vasa-mCherry (magenta). b, Embryos expressing Vasa-mApple (magenta) stained with anti-CCR4 antibody (green). c, Embryos expressing Vasa-mApple (magenta) stained with anti-NOT3 antibody (green). Stage-2 embryos are shown on the top and stage-4 embryos are shown at the bottom. For each examined protein (Cup/CCR4/NOT3), the averaged line scan of five germ granules from 2 embryos for each stage was shown. Data are the mean ± s.d. Source data
Extended Data Fig. 9
Extended Data Fig. 9. Characterization of Oskar-NQmut.
a, Sequence features of short Oskar protein. (Top to bottom) The first track shows the domain structure of Oskar. The second track shows the distribution of Asparagine (N) and Glutamine (Q) residues in the Oskar protein of Drosophila melanogaster. The third track shows the sequence conservation of Oskar proteins of 11 Drosophila species. The fourth track shows disorder prediction of the Oskar sequence using IUPred2A online tool. b, Embryos expressing oskWT-bcd3′UTR (top) or osk-NQmut-bcd3′UTR (bottom). Germplasm is marked by Vasa (green) and nanos mRNA is stained by smFISH (magenta). c, FRAP of Vasa-mApple in anterior germplasm of embryos expressing oskWT-bcd3′UTR (top) or osk-NQmut-bcd3′UTR (bottom). Fluorescence intensity over time (WT: blue; NQmut: red) is plotted on the right. N refers to the number of embryos where measurements were made. Data are the mean ± s.d. Source data

References

    1. Banani, S. F., Lee, H. O., Hyman, A. A. & Rosen, M. K. Biomolecular condensates: organizers of cellular biochemistry. Nat. Rev. Mol. Cell Biol.18, 285–298 (2017). - PMC - PubMed
    1. Tauber, D., Tauber, G. & Parker, R. Mechanisms and regulation of RNA condensation in RNP granule formation. Trends Biochem. Sci45, 764–778 (2020). - PMC - PubMed
    1. Roden, C. & Gladfelter, A. S. RNA contributions to the form and function of biomolecular condensates. Nat. Rev. Mol. Cell Biol.22, 183–195 (2021). - PMC - PubMed
    1. Parker, D. M., Winkenbach, L. P. & Osborne Nishimura, E. It’s just a phase: exploring the relationship between mRNA, biomolecular condensates, and translational control. Front. Genet.13, 931220 (2022). - PMC - PubMed
    1. Protter, D. S. W. & Parker, R. Principles and properties of stress granules. Trends Cell Biol.26, 668–679 (2016). - PMC - PubMed

Publication types

MeSH terms

LinkOut - more resources