. 2024 Oct;30(10):2977-2989.
doi: 10.1038/s41591-024-03118-z. Epub 2024 Jul 4.

AI-based differential diagnosis of dementia etiologies on multimodal data

Affiliations

AI-based differential diagnosis of dementia etiologies on multimodal data

Chonghua Xue et al. Nat Med. 2024 Oct.

Abstract

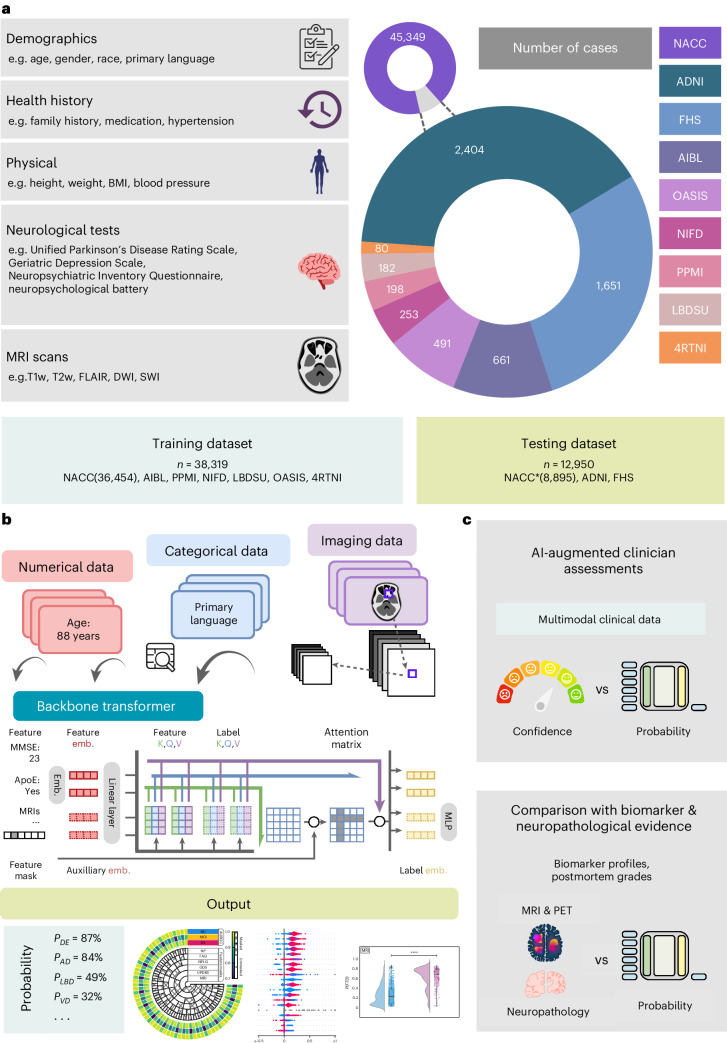
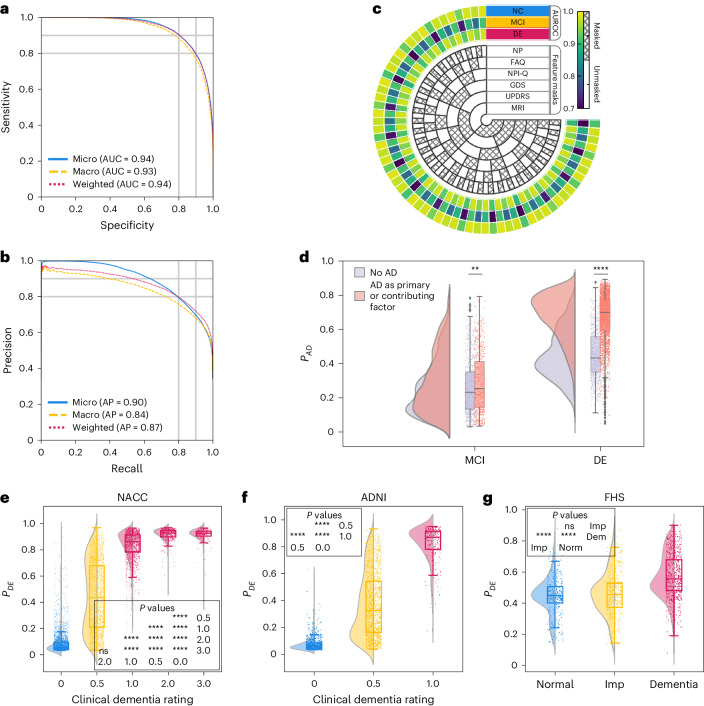
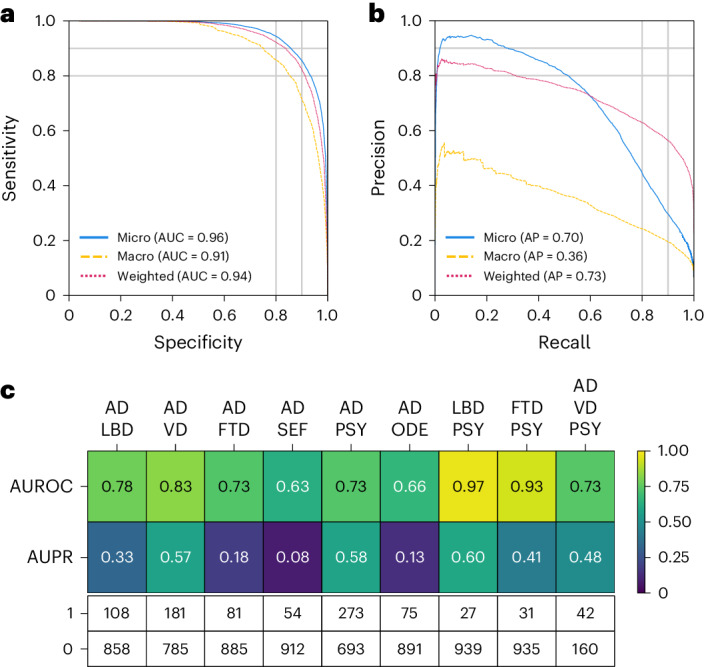
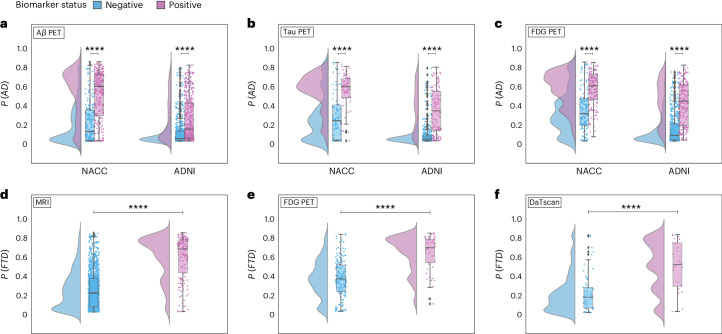
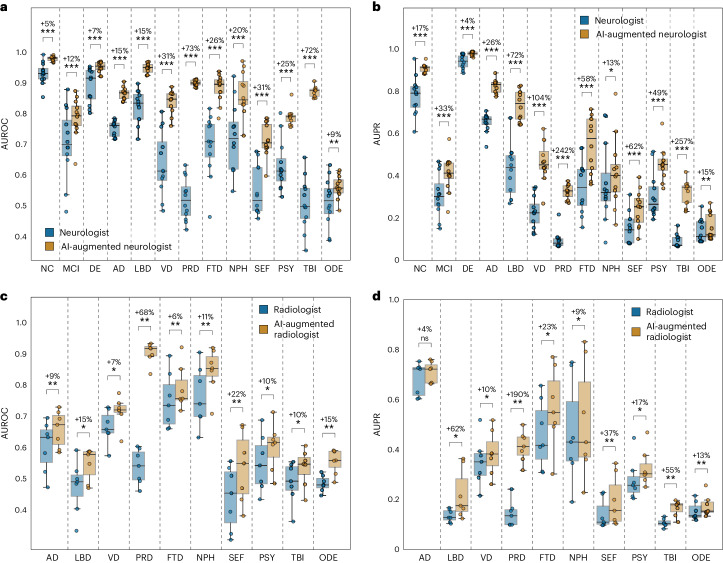
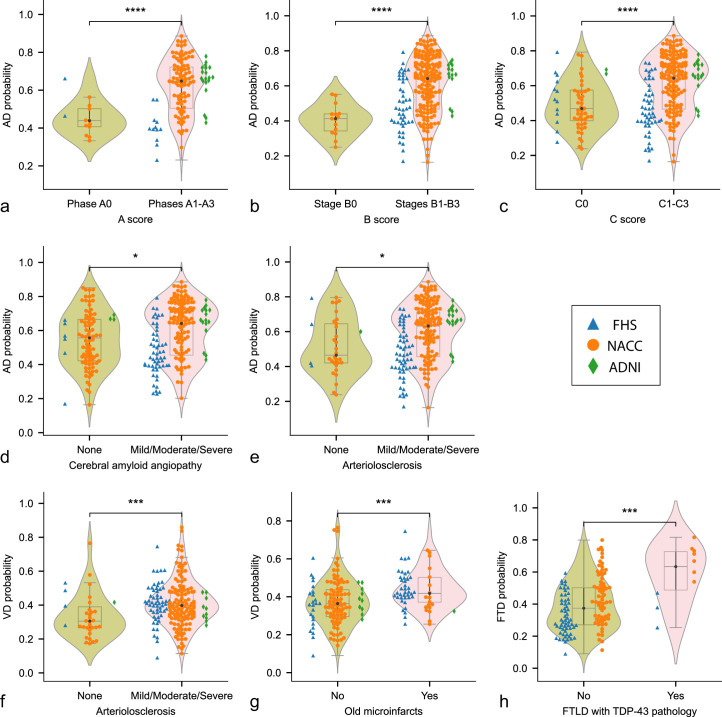
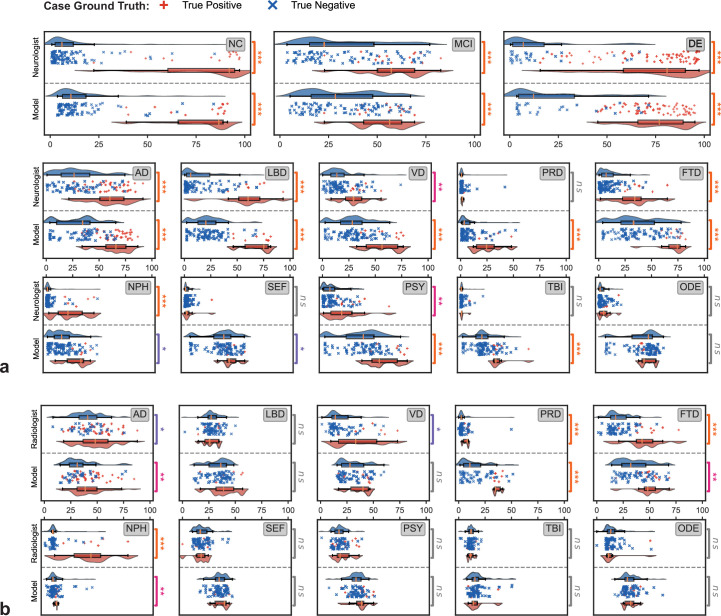
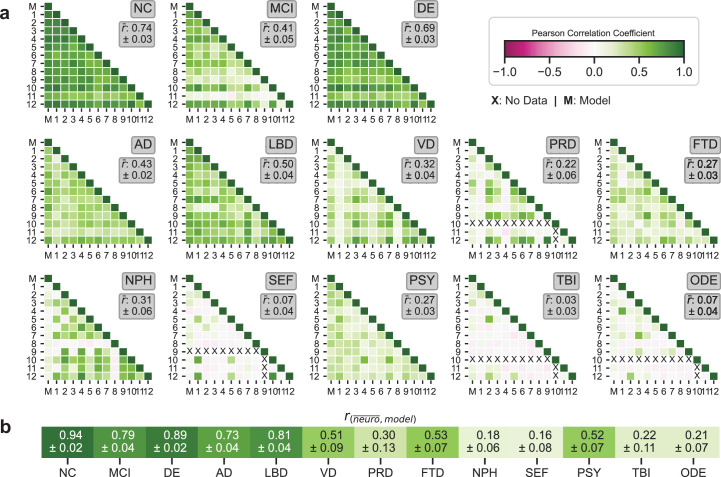
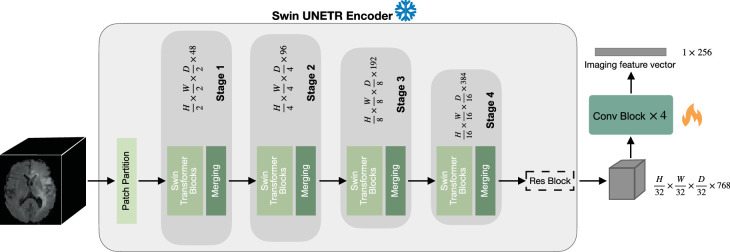
Differential diagnosis of dementia remains a challenge in neurology due to symptom overlap across etiologies, yet it is crucial for formulating early, personalized management strategies. Here, we present an artificial intelligence (AI) model that harnesses a broad array of data, including demographics, individual and family medical history, medication use, neuropsychological assessments, functional evaluations and multimodal neuroimaging, to identify the etiologies contributing to dementia in individuals. The study, drawing on 51,269 participants across 9 independent, geographically diverse datasets, facilitated the identification of 10 distinct dementia etiologies. It aligns diagnoses with similar management strategies, ensuring robust predictions even with incomplete data. Our model achieved a microaveraged area under the receiver operating characteristic curve (AUROC) of 0.94 in classifying individuals with normal cognition, mild cognitive impairment and dementia. Also, the microaveraged AUROC was 0.96 in differentiating the dementia etiologies. Our model demonstrated proficiency in addressing mixed dementia cases, with a mean AUROC of 0.78 for two co-occurring pathologies. In a randomly selected subset of 100 cases, the AUROC of neurologist assessments augmented by our AI model exceeded neurologist-only evaluations by 26.25%. Furthermore, our model predictions aligned with biomarker evidence and its associations with different proteinopathies were substantiated through postmortem findings. Our framework has the potential to be integrated as a screening tool for dementia in clinical settings and drug trials. Further prospective studies are needed to confirm its ability to improve patient care.


Conflict of interest statement

V.B.K. is on the scientific advisory board for Altoida Inc., and serves as a consultant to AstraZeneca. S.K. serves as consultant to AstraZeneca. C.W.F. is a consultant to Boston Imaging Core Lab. K.L.P. is a member of the scientific advisory boards for Curasen, Biohaven and Neuron23, receiving consulting fees and stock options, and for Amprion, receiving stock options. R.A. is a scientific advisor to Signant Health and NovoNordisk. She also serves as a consultant to Davos Alzheimer’s Collaborative. The remaining authors declare no competing interests.

Figures

Fig. 1
Fig. 1. Data, model architecture and modeling strategy.
a, Our model for differential dementia diagnosis was developed using diverse data modalities, including individual-level demographics, health history, neurological testing, physical/neurological exams and multisequence MRI scans. These data sources whenever available were aggregated from nine independent cohorts: 4RTNI, ADNI, AIBL, FHS, LBDSU, NACC, NIFD, OASIS and PPMI (Tables 1 and S1). For model training, we merged data from NACC, AIBL, PPMI, NIFD, LBDSU, OASIS and 4RTNI. We used a subset of the NACC dataset for internal testing. For external validation, we utilized the ADNI and FHS cohorts. b, A transformer served as the scaffold for the model. Each feature was processed into a fixed-length vector using a modality-specific embedding (emb.) strategy and fed into the transformer as input. A linear layer was used to connect the transformer with the output prediction layer. c, A subset of the NACC testing dataset was randomly chosen to conduct a comparative analysis between neurologists' performance augmented with the AI model and their performance without AI assistance. Similarly, we carried out comparative evaluations with practicing neuroradiologists, who were provided with a randomly selected sample of confirmed dementia cases from the NACC testing cohort, to assess the impact of AI augmentation on their diagnostic performance. For both these evaluations, the model and clinicians had access to the same set of multimodal data. Finally, we assessed the model’s predictions by comparing them with biomarker profiles and pathology grades available from the NACC, ADNI and FHS cohorts.
Fig. 2
Fig. 2. Model performance on individuals along the cognitive spectrum.
a,b, ROC and PR curves, with their respective microaverage, macroaverage and weighted-average calculations based on the labels for NC, MCI and dementia. These averaging techniques consolidated the model’s performance across the spectrum of cognitive states. Cases from the NACC testing, along with all the cases from ADNI and FHS cohorts, were used. c, Diagram indicating varied levels of model performance in the presence of missing data. The inner concentric circles represent various scenarios in which particular test information was either omitted (masked) or included (unmasked). The three outer concentric rings depict the model’s performance as measured by the AUROC for the NC, MCI and dementia labels. d, Raincloud plots are used to demonstrate the model’s predicted AD probabilities for individuals with MCI and dementia in the NACC cohort. Two-sample two-sided unadjusted Kolmogorov-Smirnov (KS) test for goodness of fit was used to compare the cases where AD was a factor in cognitive impairment to those with non-AD etiologies in MCI (n = 1,486, KS = 0.09, P = 4.29 × 10⁻³) and dementia groups (n = 4,085, KS = 0.57, P < 1 × 10−200). eg, Raincloud plots with violin and box diagrams are shown to denote the distribution of CDR scores (x axis) versus model-predicted probability of dementia (y axis), on the NACC, ADNI and FHS cohorts, respectively. We performed the Kruskal-Wallis H-test for independent samples in NACC (n = 8,895, H = 6,921.71, P < 1 × 10−200), ADNI (n = 2,400, H = 1,518.79, P < 1 × 10−200) and FHS (n = 1,651, H = 292.04, P = 3.84 × 10−64). These were followed by post-hoc Dunn’s testing with Bonferroni correction for multiple comparisons, and detailed statistical results are provided in Table S10. For dg, each boxplot includes a box presenting the median value and interquartile range (IQR), with whiskers extending from the box to the maxima and minima no further than a distance of 1.5 times the IQR. Significance levels are denoted as ns (not significant) for P ≥ 0.05; *P < 0.05, **P < 0.01, ***P < 0.001, ****P < 0.0001. In g, ‘Normal’ indicates cognitively normal individuals, ‘Imp’ indicates those with cognitive impairment and ‘Dem’ indicates persons with mild, moderate and severe dementia.
Fig. 3
Fig. 3. Model assessment on single and co-occurring dementias.
a,b, ROC and PR curves are provided, using microaverage, macroaverage and weighted-average methods across all the dementia diagnostic labels. These averages were computed to synthesize the performance metrics across all dementia etiologies. Only cases from the NACC testing were used. c, Heatmaps are used to depict the model’s performance on co-occurring dementias. We considered all combinations where two or more etiologies co-occurred from the NACC testing cohort, provided there were at least 25 positive samples. This ensured that the maximum variance of the AUROC calculation over all possible continuous distributions was upper bounded by 0.01. The first row shows the AUROC values, and the second row shows the AUPR values. The table also displays the sample sizes for each case, with 1 representing a positive case and 0 indicating a negative sample. Only cases from the NACC testing were used.
Fig. 4
Fig. 4. Biomarker-level validation.
Raincloud plots representing model probabilities for dementia etiologies across their respective biomarker-negative (blue) and positive groups (pink). a, Model-predicted probabilities for AD, P(AD), were analyzed in relation to amyloid β (Aβ) positivity status using a one-sided Mann-Whitney U test for the NACC cohort (n = 440, U = 10,303.50, P = 2.04 × 10⁻²⁵) and a one-sided t-test for ADNI (n = 1,108, t = −12.06, P = 9.74 × 10⁻³¹). b, Differences in P(AD) between tau PET negative and positive biomarker groups were analyzed using the one-sided Mann-Whitney U tests for NACC (n = 132, U = 935.50, P = 6.48 × 10⁻⁸) and ADNI (n = 475, U = 5,857.50, P = 4.10 × 10⁻²⁷). c, Similar analyses were run to differentiate P(AD) between fluorodeoxyglucose (FDG) PET biomarker groups in NACC (n = 261, U = 3,730.00, P = 3.00 × 10⁻¹⁵), and ADNI (n = 760, U = 14,924.00, P = 5.66 × 10−43). d, e, In the NACC cohort, model-predicted probabilities for frontotemporal lobar degeneration, P(FTD), were assessed across MRI (n = 1,494, 30,935.50, P = 1.52 × 10−51) and FDG PET biomarker groups (n = 233, U = 1,599.50, P = 2.08 × 10⁻¹³) using a one-sided Mann-Whitney U test. f, In NACC, LBD probabilities, P(LBD), were analyzed between DaTscan negative and positive groups using a one-sided Mann-Whitney U test (n = 91, U = 318.50, P = 6.26 × 10⁻⁶). All boxplots presented include a box presenting the median value and IQR, with whiskers extending from the box to the maxima and minima no further than a distance of 1.5 times the IQR. In all plots, ****P < 0.0001, and results were not corrected for multiple comparisons.
Fig. 5
Fig. 5. AI-augmented clinician assessments.
Comparison between the performance of the assessments provided by practicing clinicians versus model-assisted clinicians is shown. a,b, For the analysis, neurologists (n = 12) were given 100 randomly selected cases encompassing individual-level demographics, health history, neurological tests, physical as well as neurological examinations, and multisequence MRI scans. The neurologists were then tasked with assigning confidence scores for NC, MCI, dementia and the 10 dementia etiologies: AD, LBD, VD, PRD, FTD, NPH, SEF, PSY, TBI and ODE (Glossary 1). The boxplots show AUROC in a and AUPR in b for individual neurologist and model-assisted neurologist performance (defined as the mean between model and neurologist confidence scores). Pairwise statistical comparisons were conducted using the one-tailed Wilcoxon signed-rank test without corrections made for multiple comparisons, with significance levels denoted as: ns (not significant) for P ≥ 0.05; *P < 0.05, **P < 0.01, ***P < 0.001 ****P < 0.0001. Detailed statistics and P values can be found in Table S14. The percent increase in mean performance for each etiology is also presented above each statistical annotation. c,d, Similarly, in a separate analysis, radiologists (n = 7) were given 70 randomly selected cases with a confirmed dementia diagnosis encompassing individual-level demographics and multisequence MRI scans. The radiologists were tasked with assigning confidence scores for the 10 dementia etiologies, and the boxplots show AUROC in c and AUPR in d for the individual radiologist and model-assisted radiologist performance for the 10 etiologies. Statistical annotations and percent increase in mean performance with respect to each etiology are shown in a similar fashion, with significance levels corresponding to the results of unadjusted one-tailed Wilcoxon signed-rank tests denoted as *, **, *** and ****. Detailed statistics and P values can be found in Table S15. Each boxplot includes a box presenting the median value and IQR, with whiskers extending from the box to the maxima and minima no further than a distance of 1.5 times the IQR.
Extended Data Fig. 1
Extended Data Fig. 1. Shapley analysis on cases from the NACC test set comprising individuals along the cognitive spectrum.
The figure presents the top twenty contributing features for the model’s positive predictions of a, NC, b, MCI, and c, DE labels, ranked by their mean Shapley values. These values, representing the average contribution of each feature to the model’s decision, guide the ranking from the highest to the lowest impact. For each diagnostic group, a subset of n = 500 cases with the most available features were selected for analysis.
Extended Data Fig. 2
Extended Data Fig. 2. UpSet plot depicting the distribution and model-predicted probabilities of the etiological categories in NACC testing.
a, Single and co-occurring diagnostic categories are enumerated, offering a tally of each condition’s frequency within the dataset. b, A logarithmic scale is used to delineate the overlap among these categories, shedding light on their relative commonality and the extent of their coexistence. This method grants a refined perspective on the prevalence of comorbid conditions. c, Boxplots delineating the spread and central tendency of the model’s predicted probabilities for each combination of diagnostic categories. The legend in the upper right interprets the sizes within b and c, providing a reference for the logarithmic data representation. All boxplots include a box presenting the median value and interquartile range (IQR), with whiskers extending from the box to the maxima and minima no further than a distance of 1.5 times the IQR.
Extended Data Fig. 3
Extended Data Fig. 3. Neuropathological validation.
Array of violin plots with integrated boxplots, delineating the model-predicted probabilities for different neuropathological grades across AD, VD and FTD etiologies. A one-sided Mann-Whitney U test was performed on data from FHS, NACC and ADNI, each denoted by unique markers. AD probabilities, P(AD), were compared against three key AD pathological markers with progressive stages: a, Thal phases of Aβ plaques (N = 135, U = 282.5, p = 7.11e − 05), b, Braak stages of neurofibrillary degeneration (N = 249, U = 571.5, p = 6.07e − 06), and c, Consortium to Establish a Registry for Alzheimer’s Disease density scores of neocortical neuritic plaques (N = 278, U = 3916.5, p = 1.73e − 06). We further evaluated P(AD) against d, cerebral amyloid angiopathy (N = 274, U = 6938.5, p = 0.01) and e, arteriolosclerosis (N = 238, U = 2607.0, p = 0.01), both of which are common pathological findings in AD confirmed postmortem cases. Significant differences were also observed in model predicted probabilities for VD between cases with and without f, arteriolosclerosis (N = 230, U = 2085.5, p = 0.0002) and g, old microinfarcts (N = 178, U = 2289.5, p = 0.0001). h, Finally, model predicted probabilities for FTD differed significantly between cases with and without TDP-43 pathology (N = 136, U = 252.0, p = 0.0008). Table S13 also details these statistical results. No correction for multiple comparisons was performed and significance levels are illustrated as: * for p < 0.05; ** for p < 0.01; *** for p < 0.001; and **** for p < 0.0001. Each boxplot includes a box presenting the median value and interquartile range (IQR), with whiskers extending from the box to the maxima and minima no further than a distance of 1.5 times the IQR.
Extended Data Fig. 4
Extended Data Fig. 4. Head to head comparison between model and clinicians.
Comparison between model-predicted probability scores and the assessments provided by practicing clinicians is shown. a, For the analysis, neurologists (n = 12) were given 100 randomly selected cases encompassing individual-level demographics, health history, neurological tests, physical as well as neurological examinations, and multisequence MRI scans. The neurologists were then tasked with assigning confidence scores for NC, MCI, DE, and the 10 dementia etiologies: AD, LBD, VD, PRD, FTD, NPH, SEF, PSY, TBI, and ODE (see Glossary 1). Neurologists’ confidence scores were averaged to produce a single consensus confidence score for each case. In the visual representation, the boxplot in blue indicates the distribution of confidence scores for true negative cases, while the boxplot in red signifies true positive cases. The symbol ‘+’ represents true positive cases, and ‘x’ denotes true negative cases. Significance levels are denoted as: ns (not significant) for p≥0.05; * for p < 0.05; ** for p < 0.01; *** for p < 0.001; and **** for p < 0.0001. These levels were determined using pairwise comparisons via the unadjusted two-sided Brunner-Munzel test, for which detailed pvalues and statistics can be found in Table S17. b, Similarly, in a separate analysis, radiologists (n = 7) were given 70 randomly selected cases with a confirmed dementia diagnosis encompassing individual-level demographics and multisequence MRI scans. The radiologists were tasked with assigning confidence scores for the 10 dementia etiologies. Similar to that of a, the visual representation consists of boxplots and scatterplots that represent the distribution of model and radiologists’ consensus confidence scores for true negative and true positive cases. Unadjusted two-sided Brunner-Munzel statistical test results are shown as pairwise annotations of ns, *, **, ***, or ****, and more detailed statistics and pvalues can be found in Table S18. Each boxplot presented includes a box presenting the median value and interquartile range (IQR), with whiskers extending from the box to the maxima and minima no further than a distance of 1.5 times the IQR.
Extended Data Fig. 5
Extended Data Fig. 5. Neurologist and model interrater agreement.
a, The figure presents the Pearson correlation coefficient across different diagnostic categories, comparing assessments from the neurologists (n = 12) and the model, marked as ‘M’. Each diagnostic category from NC to ODE includes a matrix reflecting correlation coefficient values between individual neurologists and the model. Shades of green signify positive correlation, indicating agreement between the model and neurologists, whereas magenta shades suggest negative correlations, indicating potential discrepancies in assessments. The mean pairwise Pearson correlation coefficient for each etiology is presented along with a 95% confidence interval. The symbol ‘X’ denotes rater pairs where the Pearson correlation was not calculable, due to one or both raters giving label-specific confidence scores with no variance. b, The heatmap shows the mean Pearson correlation coefficients between model probabilities and neurologist confidence scores for each label, along with its 95% confidence interval. The correlation coefficient and its confidence interval for each etiology were estimated with a non-parametric bootstrapping approach.
Extended Data Fig. 6
Extended Data Fig. 6. Image feature extraction.
The Swin UNETR encoder, utilizing pre-trained weights, was leveraged to extract image embeddings from multi-sequence MRI scans into a latent space representation. Subsequently, these embeddings underwent a series of downsampling convolutional operations to achieve a condensed token dimension of 1 × 256. This dimensional reduction facilitated a consistent input format for both imaging and non-imaging data into the backbone transformer. Within this architecture, the Swin UNETR encoder’s weights remained static (frozen), ensuring the integrity of the pre-trained features, while the downsampling blocks were subject to optimization during the training phase, allowing for adaptive learning of the imaging feature vector.

Update of

  • AI-based differential diagnosis of dementia etiologies on multimodal data.
    Xue C, Kowshik SS, Lteif D, Puducheri S, Jasodanand VH, Zhou OT, Walia AS, Guney OB, Zhang JD, Pham ST, Kaliaev A, Andreu-Arasa VC, Dwyer BC, Farris CW, Hao H, Kedar S, Mian AZ, Murman DL, O'Shea SA, Paul AB, Rohatgi S, Saint-Hilaire MH, Sartor EA, Setty BN, Small JE, Swaminathan A, Taraschenko O, Yuan J, Zhou Y, Zhu S, Karjadi C, Ang TFA, Bargal SA, Plummer BA, Poston KL, Ahangaran M, Au R, Kolachalama VB. Xue C, et al. medRxiv [Preprint]. 2024 Mar 26:2024.02.08.24302531. doi: 10.1101/2024.02.08.24302531. medRxiv. 2024. Update in: Nat Med. 2024 Oct;30(10):2977-2989. doi: 10.1038/s41591-024-03118-z. PMID: 38585870 Free PMC article. Updated. Preprint.

References

    1. World Health Organization. Global Status Report on the Public Health Response to Dementia: Web Annex Methodology for Producing Global Dementia Cost Estimates (World Health Organization, 2021). https://www.who.int/publications/i/item/9789240033245
    1. Cahill, S. Who’s global action plan on the public health response to dementia: some challenges and opportunities. Aging Ment. Health24, 197–199 (2019). - PubMed
    1. Gauthier, S. et al. Why has therapy development for dementia failed in the last two decades? Alzheimer Dement.12, 60–64 (2016). - PubMed
    1. Schneider, J. A., Arvanitakis, Z., Bang, W. & Bennett, D. A. Mixed brain pathologies account for most dementia cases in community-dwelling older persons. Neurology69, 2197–2204 (2007). - PubMed
    1. Habes, M. et al. Disentangling heterogeneity in Alzheimer’s disease and related dementias using data-driven methods. Biol. Psychiatry88, 70–82 (2020). - PMC - PubMed

Grants and funding

LinkOut - more resources