. 2024 Nov;31(11):1439-1451.
doi: 10.1038/s41418-024-01337-y. Epub 2024 Jul 4.

TFEB controls syncytiotrophoblast formation and hormone production in placenta

Affiliations

TFEB controls syncytiotrophoblast formation and hormone production in placenta

Marcella Cesana et al. Cell Death Differ. 2024 Nov.

Abstract

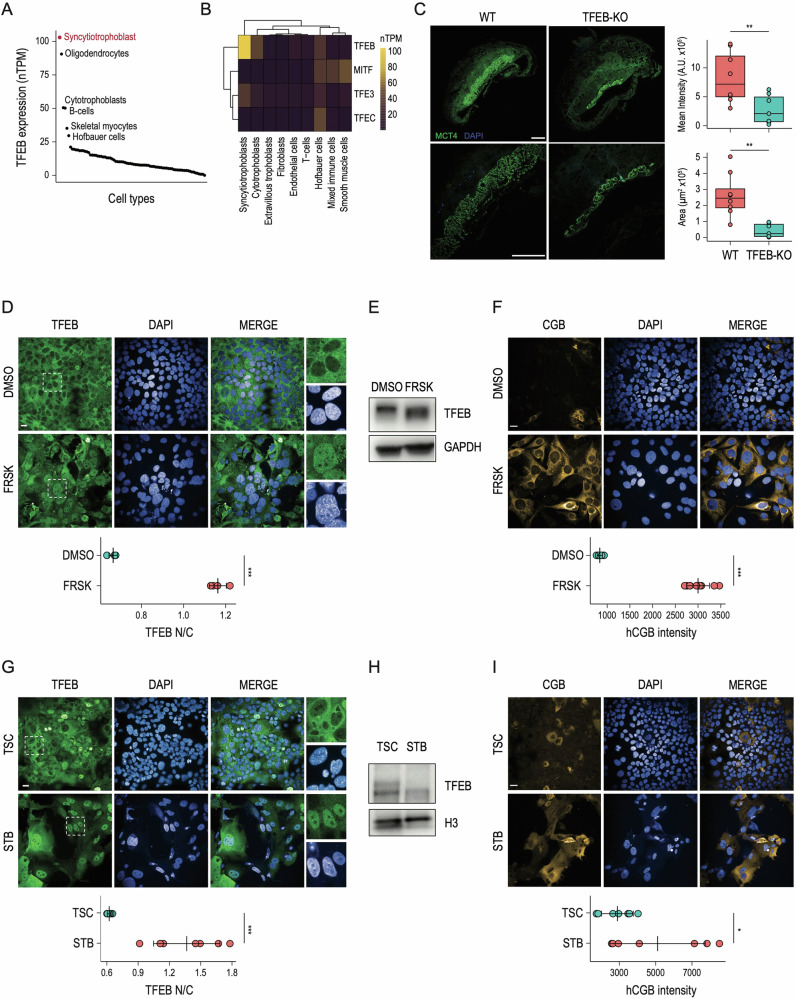
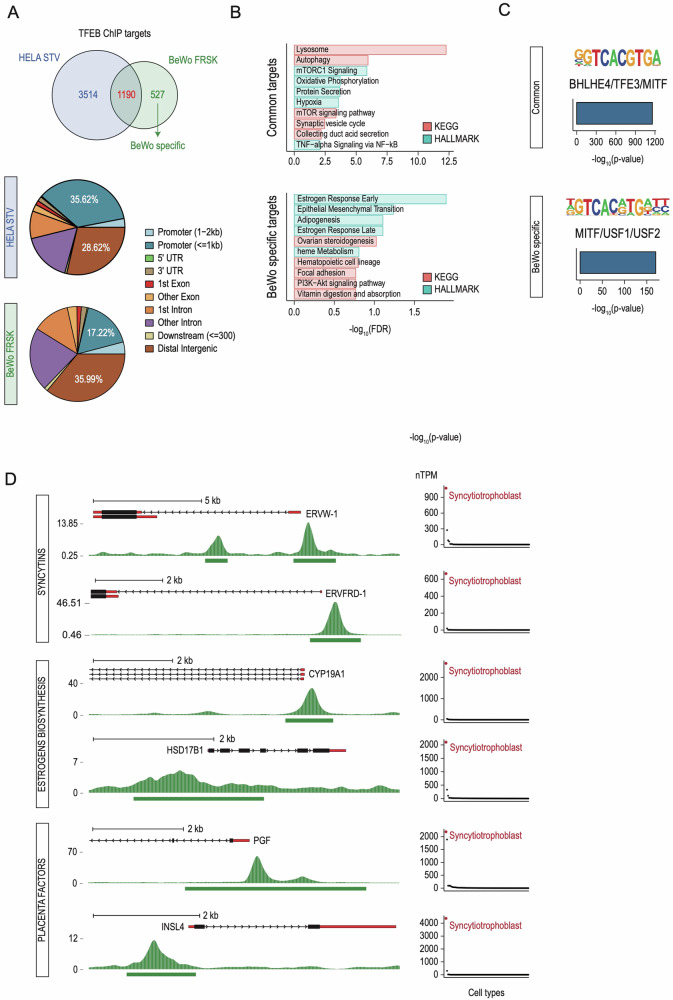
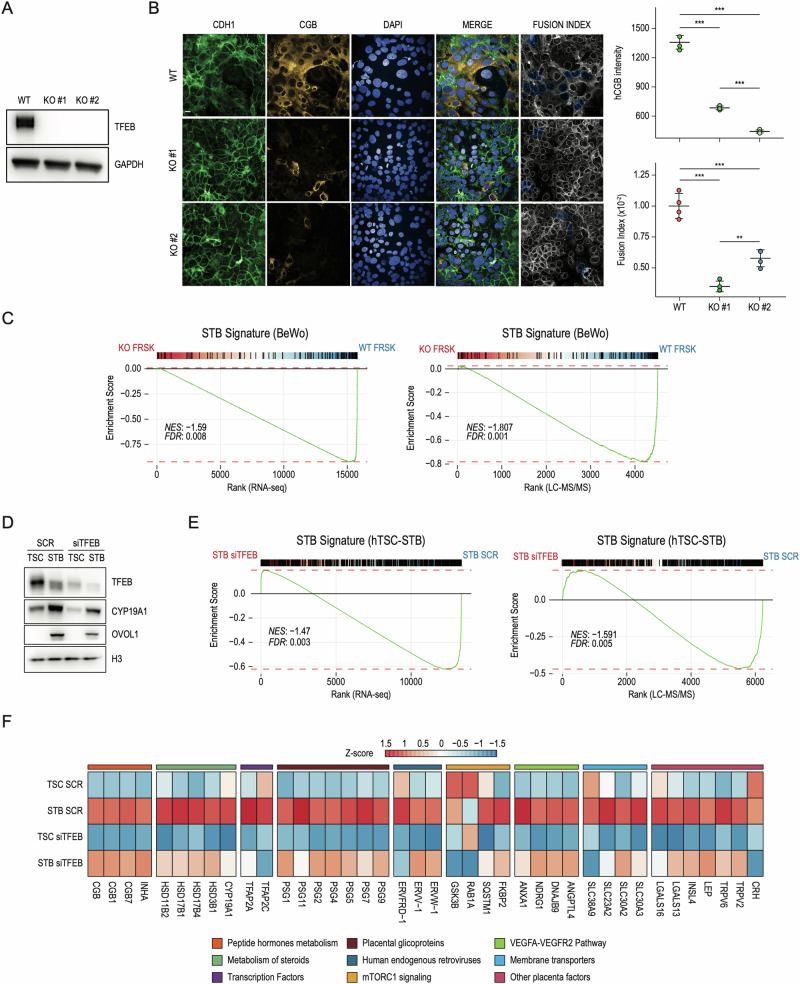
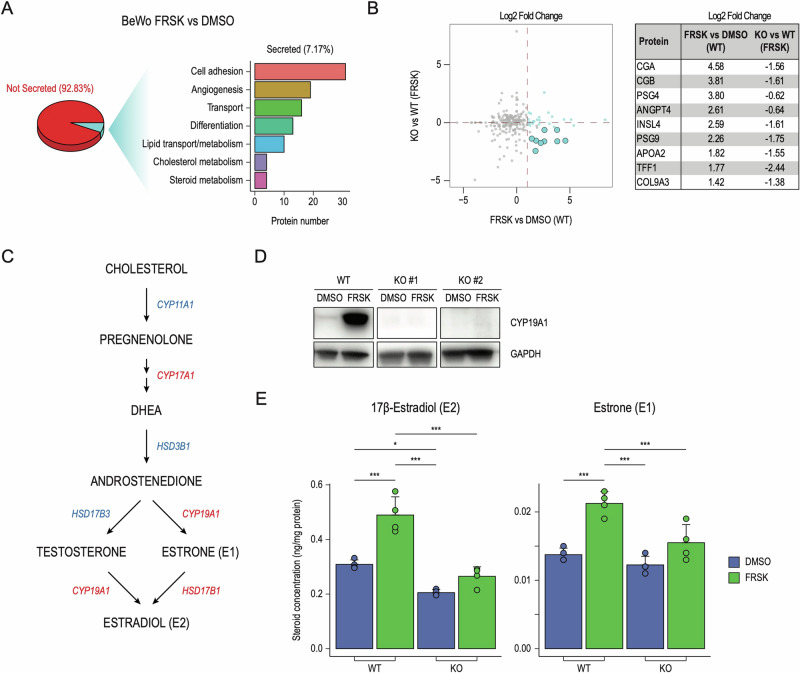
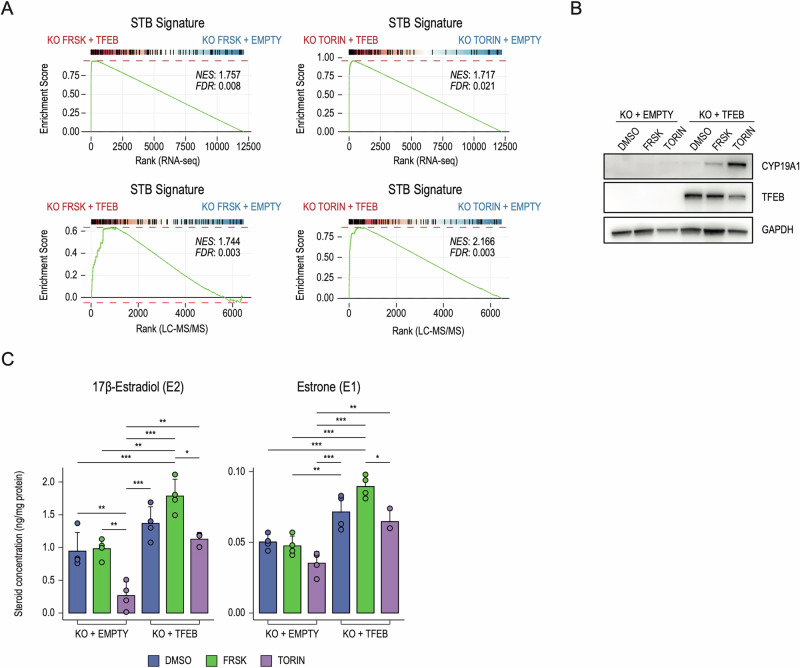
TFEB, a bHLH-leucine zipper transcription factor belonging to the MiT/TFE family, globally modulates cell metabolism by regulating autophagy and lysosomal functions. Remarkably, loss of TFEB in mice causes embryonic lethality due to severe defects in placentation associated with aberrant vascularization and resulting hypoxia. However, the molecular mechanism underlying this phenotype has remained elusive. By integrating in vivo analyses with multi-omics approaches and functional assays, we have uncovered an unprecedented function for TFEB in promoting the formation of a functional syncytiotrophoblast in the placenta. Our findings demonstrate that constitutive loss of TFEB in knock-out mice is associated with defective formation of the syncytiotrophoblast layer. Indeed, using in vitro models of syncytialization, we demonstrated that TFEB translocates into the nucleus during syncytiotrophoblast formation and binds to the promoters of crucial placental genes, including genes encoding fusogenic proteins (Syncytin-1 and Syncytin-2) and enzymes involved in steroidogenic pathways, such as CYP19A1, the rate-limiting enzyme for the synthesis of 17β-Estradiol (E2). Conversely, TFEB depletion impairs both syncytial fusion and endocrine properties of syncytiotrophoblast, as demonstrated by a significant decrease in the secretion of placental hormones and E2 production. Notably, restoration of TFEB expression resets syncytiotrophoblast identity. Our findings identify that TFEB controls placental development and function by orchestrating both the transcriptional program underlying trophoblast fusion and the acquisition of endocrine function, which are crucial for the bioenergetic requirements of embryonic development.


Conflict of interest statement

AB is cofounder and shareholder of Casma Therapeutics and an advisory board member of Avilar Therapeutics. DC is Co-Founder, shareholder and Consultant of NEGEDIA Srl.

Figures

Fig. 1
Fig. 1. TFEB is activated during in vitro syncytiotrophoblast formation.
A Dot plot displaying TFEB expression (nTPM) in different cell types according to the Human Protein Atlas single-cell datasets. The top-6 cell types that express the highest levels of TFEB are indicated in black, with the Syncytiotrophoblast representing the cell compartment with TFEB highest levels indicated in red. B Heatmap displaying TFEB, TFE3, MITF, and TFEC expression (nTPM) at the single-cell level in human placenta cell types according to Human Protein Atlas clustered single-cell datasets. C (Left) E10.5 placentas derived from wild-type (WT) and TFEB knock-out mice (TFEB-KO) were stained for MCT4 and DAPI. Images shown at different magnifications. Scale bars: 500μm (4×) an 500 μm (10×). Sections from three placentas per genotype were analyzed. (Right) Histograms displaying ImageJ-based quantification of MCT4 signal shown as “Mean Intensity” and “Area” (** one-sided p-value < 0.01 with unpaired Welch’s t-test). D (Up) Representative immunofluorescence images of BeWo cells in DMSO and Forskolin (FRSK) conditions immunostained for TFEB. Nuclei are counterstained blue using DAPI. Scale bar 20 µm. The inset displays a digital magnification of the representative immunofluorence images for a detailed observation of TFEB subcellular localization. (Down) Dot plot showing the ratio relative to the quantification of TFEB fluorescence intensity in the nucleus and the cytoplasm (TFEB N/C) upon indicated treatments (n = 4) measured by High-Content Imaging (*** one-sided p-value < 0.001 with unpaired Welch’s t-test). E Representative image of immunoblot analysis of TFEB levels in BeWo cells in DMSO and Forskolin (FRSK) conditions. A molecular weight shift of TFEB is visible in FRSK-treated cells, suggesting that TFEB is dephosphorylated in this condition. GAPDH was used as a loading control. F (Up) Representative immunofluorescence images of BeWo cells upon DMSO and Forskolin (FRSK) treatments immunostained for human chorion gonadotropin β subunit (CGB). Nuclei are counterstained blue using DAPI. Scale bar 20 µm. (Down) High-content imaging-based quantification of CGB intensity upon indicated treatments (n = 10) shown as dot plots (*** one-sided p-value < 0.001 with unpaired Welch’s t-test). G:(Up) Representative immunofluorescence images of human naive IPSC-derived trophoblast stem cells (TSC) and differentiated syncytiotrophoblast (STB) immunostained for TFEB. Nuclei are counterstained blue using DAPI. Scale bar 20 µm. The inset displays a digital magnification of the representative immunofluorence images for a detailed observation of TFEB subcellular localization. (Down) Dot plot showing the ratio relative to the quantification of TFEB fluorescence intensity in the nucleus and the cytoplasm (TFEB N/C) upon indicated treatments (n = 7) measured by High-Content Imaging (*** one-sided P value < 0.001 with unpaired Welch’s t-test). H Representative image of immunoblot analysis of TFEB levels in human naive IPSC-derived trophoblast stem cells (TSC) and differentiated syncytiotrophoblast (STB). A molecular weight shift of TFEB is visible in STB, suggesting that TFEB is dephosphorylated in this condition. H3 was used as a loading control. I (Up) Representative immunofluorescence images of human naive IPSC-derived trophoblast stem cells (TSC) and differentiated syncytiotrophoblast (STB) immunostained for human chorion gonadotropin β subunit (CGB). Nuclei are counterstained blue using DAPI. Scale bar 20 µm. (Down) High-content imaging-based quantification of CGB intensity upon indicated treatments (n = 7) shown as dot plots (*** one-sided p-value < 0.001 with unpaired Welch’s t-test).
Fig. 2
Fig. 2. TFEB targets STB-specific genes.
A (Upper) Venn diagram showing the number of TFEB targets (ChIP peaks at <2 kb from the TSS) in HeLa undergoing starvation (HELA STV) and BeWo cells treated with Forskolin (BeWo FRSK). Common targets (1190) are shown in red and BeWo-specific targets (527) in green. (Lower) Pie charts displaying TFEB binding distribution across the genome in HeLa and BeWo cells at the level of indicated cis-regulatory regions. The distribution of TFEB binding to different regions of target genes, which include promoters (< of 1Kb from the transcriptional start site) and distal intergenic regions, are indicated in the pie charts. B Bar plots of representative term enrichment analysis results using Curated Pathways (KEGG and MSigDB Hallmark collection) of TFEB target genes commonly shared between HeLa and BeWo cells (upper - Common targets) and TFEB BeWo-specific targets (lower - BeWo specific targets). Enriched terms are ranked by −log10 FDR (x-axis). C De-novo motif discovery analysis across the genomic regions displayed in A. For “Common” and “BeWo-specific” categories, the human-specific enriched motif is reported as a motif graph, the best match according to the Homer database, a bar plot displaying statistical significance and the percentage of targets across the genome. D (Left) Representative genome browser snapshots of selected promoters bound by TFEB upon Forskolin treatment in BeWo cells. Both reads distributions as density plots and peak intervals are displayed. Displayed genes are grouped into categories, indicated on the left (“Syncytins” - ERVW-1 and ERVFRD-1; “Estrogen Biosynthesis” - CYP19A1 and HSD17B1; “Placenta Factors” - INSL4 and PGF). (Right) Dot plots indicating the expression levels (nTPM) of indicated TFEB targets across different cell types according to the Human Protein Atlas single-cell datasets. Syncytiotrophoblast is indicated in red.
Fig. 3
Fig. 3. Lack of TFEB impairs STB formation.
A Representative image of immunoblot analysis of TFEB expression in wild-type (WT) and CRISPR-Cas9 TFEB knock-out (KO#1 and KO#2) cells. GAPDH was used as a loading control. B (Left) Representative immunofluorescence images of wild-type (WT) cells and TFEB knock-out (KO#1 and KO#2) cells upon Forskolin (FRSK) treatment immunostained for E-Cadherin (CDH1) and human chorion gonadotropin β subunit (CGB). Nuclei are counterstained blue using DAPI. Lack of CDH1 staining combined with DAPI fluorescence was used to denote clusters of fused cells (Fusion Index, see “Methods”). Scale bar 20 µm. (Right) High-content imaging-based quantification of CGB intensity and proportion of fused cells upon indicated treatments (n = 4) shown as dot plots. Statistical analysis was performed by One-way analysis of variance (ANOVA) followed by Tukey’s multiple comparisons test (*p ≤ 0.05; **p ≤ 0.01; ***p ≤ 0.001). C Gene-set enrichment Analysis was performed on genes ranked by their fold-change and significance (see Methods) in FRSK-treated BeWo cells upon TFEB KO against WT cells in both RNAseq (left) and LC–MS/MS (right). Upregulated genes from panel in Fig. S1A (STB signature - BeWo) were used as geneset. Normalized Enrichment Score (NES) and False Discovery Rate (FDR) are reported. D Representative image of immunoblot analysis of TFEB, CYP19A1 and OVOL1 levels in human naive IPSC-derived trophoblast stem cells (TSC) and differentiated syncytiotrophoblast (STB) treated with siRNA targeting TFEB (siTFEB) and scramble sequences (SCR). H3 was used as a loading control. E Gene-set enrichment Analysis was performed on genes ranked by their fold-change and significance (see Methods) in syncytiotrophoblast (STB) treated with siRNA targeting TFEB (siTFEB) against human IPSC-derived trophoblast stem cells (TSC) in both RNAseq (left) and LC–MS/MS (right). Upregulated genes from panel in Fig. S1D (STB signature - TSC-STB) were used as geneset. Normalized Enrichment Score (NES) and False Discovery Rate (FDR) are reported. F: Heatmap of Z-scored log2-normalized expression values of selected differentially expressed genes in human naive IPSC-derived trophoblast stem cells (TSC) and differentiated syncytiotrophoblast (STB) treated with siRNA targeting TFEB (siTFEB) and scramble sequences (SCR). Genes displayed were grouped into categories indicated on the bottom.
Fig. 4
Fig. 4. TFEB drives STB endocrine functions.
A Analysis of secreted proteins through LC–MS/MS in wild-type (WT) and TFEB knock-out (KO) cells. (Left) Pie chart showing the percentage of detected proteins classified into “not secreted” (92.83%) and “secreted” (7.17%) according to Human Protein Atlas. (Right) Bar plot showing the number of secreted proteins (x-axis) belonging to the indicated Biological Process categories (y-axis). B (Left) Volcano plot showing secreted proteins displayed as Log2 Fold Change in wild-type (WT) cells upon Forskolin (FRSK) treatment compared to DMSO conditions - FRSK vs DMSO (WT) on the x-axis - and in TFEB knock-out (KO) cells treated with FRSK with respect to WT in the same conditions - KO vs WT (FRSK) on the y-axis. Proteins upregulated upon FRSK treatment in WT cells and downregulated in KO versus WT cells in FRSK conditions are represented as light blue dots. (Right) Table displaying selected proteins and their corresponding Log2 Fold Change in indicated conditions. C Schematic representation of the estrogen biosynthetic pathways from cholesterol to 17β-Estradiol (E2). Major enzymes synthesizing indicated steroid intermediates are displayed in red (directly bound by TFEB from our ChiPseq analysis) and in blue (not directly bound by TFEB but affected by its downregulation). D Representative image of immunoblot analysis of CYP19A1 levels in cells wild-type (WT) and TFEB knock-out cells (KO#1 and #2) in DMSO e Forskolin (FRSK) conditions. GAPDH was used as a loading control. E Bar chart graph representations of the quantitative determination of 17β-Estradiol (E2) and Estrone (E1) in wild-type (WT) and TFEB knock-out (KO) cells in DMSO and Forskolin (FRSK) conditions detected by UHPLC–MS/MS-based targeted steroidomics. Steroid concentration values are expressed as ng/mg of protein. Statistical analysis was performed by One-way analysis of variance (ANOVA) followed by Tukey’s multiple comparisons test (*p ≤ 0.05; **p ≤ 0.01; ***p ≤ 0.001).
Fig. 5
Fig. 5. TFEB overexpression restores the STB phenotype in TFEB KO cells.
A Gene-set Enrichment Analysis was performed on genes ranked by their fold-change and significance (see “Methods”) in TFEB knock-out cells transduced with a TFEB overexpressing vector (KO + TFEB) against an empty control vector (KO + EMPTY), upon treatment with Forskolin (FRSK - left) or Torin-1 (TORIN - right) in RNAseq (upper panels) and LC–MS/MS (lower panels). Upregulated genes from panel S1A (STB signature - BeWo) were used as geneset. Normalized Enrichment Score (NES) and False Discovery Rate (FDR) are reported. B Representative image of immunoblot analysis of CYP19A1 and TFEB levels in TFEB knock-out cells transduced with an empty control vector (KO + EMPTY) or TFEB overexpressing vector (KO + TFEB) upon treatment with DMSO, Forskolin (FRSK) and Torin-1 (TORIN). GAPDH was used as a loading control. C Bar chart graph representations of the quantitative determination of 17β-Estradiol (E2) and Estrone (E1) in TFEB knock-out cells transduced with an empty control vector (KO + EMPTY) or TFEB overexpressing vector (KO + TFEB) upon treatment with DMSO, Forskolin (FRSK) and Torin-1 detected by UHPLC–MS/MS-based targeted steroidomics. Steroid concentration values are expressed as ng/mg of protein. Statistical analysis was performed by One-way analysis of variance (ANOVA) followed by Tukey’s multiple comparisons test (*p ≤ 0.05; **p ≤ 0.01; ***p ≤ 0.001).

References

    1. Haq R, Fisher DE. Biology and clinical relevance of the micropthalmia family of transcription factors in human cancer. J Clin Oncol. 2011;29:3474–82. - PubMed
    1. Sardiello M, Palmieri M, di Ronza A, Medina DL, Valenza M, Gennarino VA, et al. A gene network regulating lysosomal biogenesis and function. Science. 2009;325:473–7. - PubMed
    1. Settembre C, Di Malta C, Polito VA, Garcia Arencibia M, Vetrini F, Erdin S, et al. TFEB links autophagy to lysosomal biogenesis. Science. 2011;332:1429–33. - PMC - PubMed
    1. Martina JA, Chen Y, Gucek M, Puertollano R. MTORC1 functions as a transcriptional regulator of autophagy by preventing nuclear transport of TFEB. Autophagy. 2012;8:903–14. - PMC - PubMed
    1. Roczniak-Ferguson A, Petit CS, Froehlich F, Qian S, Ky J, Angarola B, et al. The transcription factor TFEB links mTORC1 signaling to transcriptional control of lysosome homeostasis. Sci Signal. 2012;5:ra42. - PMC - PubMed

Substances