

Natural variation in yeast reveals multiple paths for acquiring higher stress resistance
- PMID: 38965504
- PMCID: PMC11225312
- DOI: 10.1186/s12915-024-01945-7
Natural variation in yeast reveals multiple paths for acquiring higher stress resistance
Abstract
Background: Organisms frequently experience environmental stresses that occur in predictable patterns and combinations. For wild Saccharomyces cerevisiae yeast growing in natural environments, cells may experience high osmotic stress when they first enter broken fruit, followed by high ethanol levels during fermentation, and then finally high levels of oxidative stress resulting from respiration of ethanol. Yeast have adapted to these patterns by evolving sophisticated "cross protection" mechanisms, where mild 'primary' doses of one stress can enhance tolerance to severe doses of a different 'secondary' stress. For example, in many yeast strains, mild osmotic or mild ethanol stresses cross protect against severe oxidative stress, which likely reflects an anticipatory response important for high fitness in nature.
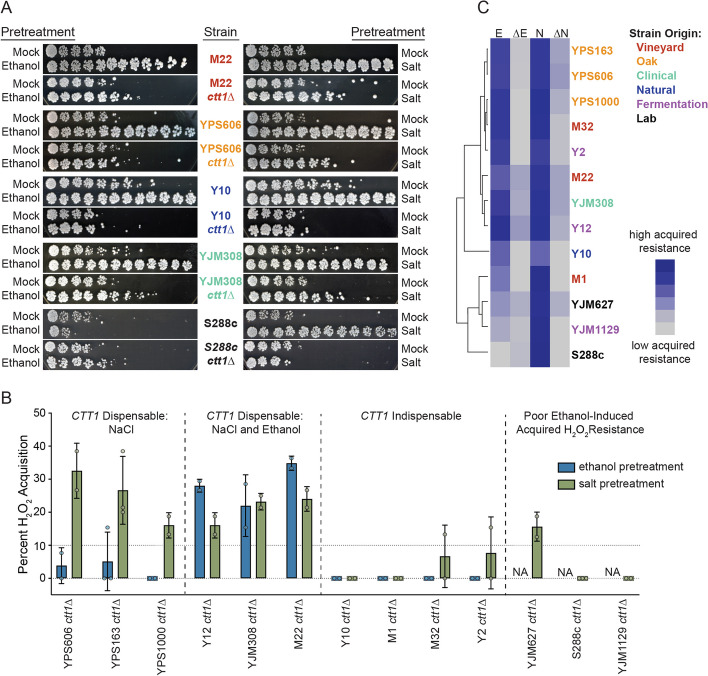
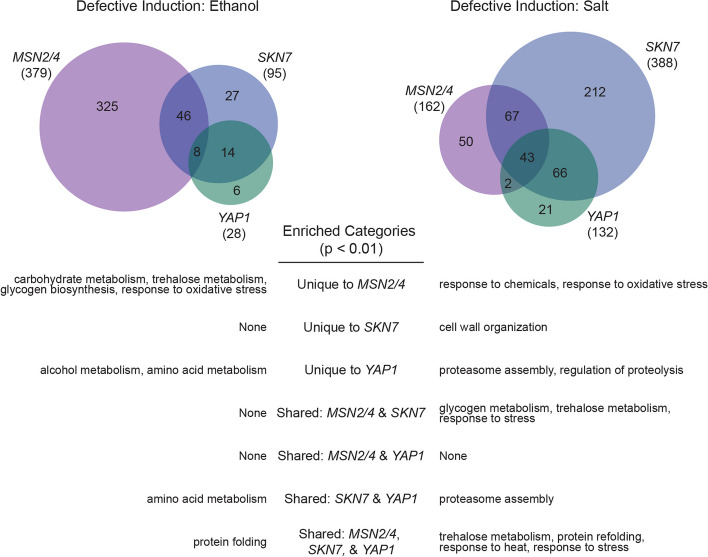
Results: During the course of genetic mapping studies aimed at understanding the mechanisms underlying natural variation in ethanol-induced cross protection against H2O2, we found that a key H2O2 scavenging enzyme, cytosolic catalase T (Ctt1p), was absolutely essential for cross protection in a wild oak strain. This suggested the absence of other compensatory mechanisms for acquiring H2O2 resistance in that strain background under those conditions. In this study, we found surprising heterogeneity across diverse yeast strains in whether CTT1 function was fully necessary for acquired H2O2 resistance. Some strains exhibited partial dispensability of CTT1 when ethanol and/or salt were used as mild stressors, suggesting that compensatory peroxidases may play a role in acquired stress resistance in certain genetic backgrounds. We leveraged global transcriptional responses to ethanol and salt stresses in strains with different levels of CTT1 dispensability, allowing us to identify possible regulators of these alternative peroxidases and acquired stress resistance in general.
Conclusions: Ultimately, this study highlights how superficially similar traits can have different underlying molecular foundations and provides a framework for understanding the diversity and regulation of stress defense mechanisms.
Keywords: Comparative genomics; Cross-stress protection; Natural variation; Regulation of gene expression; Stress biology; Yeast.
© 2024. The Author(s).
Conflict of interest statement
The authors declare that they have no competing interests.
Figures


Similar articles
-
Linkage mapping of yeast cross protection connects gene expression variation to a higher-order organismal trait.PLoS Genet. 2018 Apr 12;14(4):e1007335. doi: 10.1371/journal.pgen.1007335. eCollection 2018 Apr. PLoS Genet. 2018. PMID: 29649251 Free PMC article.
-
Independent Mechanisms for Acquired Salt Tolerance versus Growth Resumption Induced by Mild Ethanol Pretreatment in Saccharomyces cerevisiae.mSphere. 2018 Nov 28;3(6):e00574-18. doi: 10.1128/mSphere.00574-18. mSphere. 2018. PMID: 30487155 Free PMC article.
-
Catalase activity is stimulated by H(2)O(2) in rich culture medium and is required for H(2)O(2) resistance and adaptation in yeast.Redox Biol. 2014 Jan 10;2:308-13. doi: 10.1016/j.redox.2013.12.019. eCollection 2014. Redox Biol. 2014. PMID: 24563848 Free PMC article.
-
Molecular mechanisms of the yeast adaptive response and tolerance to stresses encountered during ethanol fermentation.J Biosci Bioeng. 2017 Aug;124(2):133-142. doi: 10.1016/j.jbiosc.2017.03.009. Epub 2017 Apr 17. J Biosci Bioeng. 2017. PMID: 28427825 Review.
-
Mechanisms of yeast stress tolerance and its manipulation for efficient fuel ethanol production.J Biotechnol. 2009 Oct 12;144(1):23-30. doi: 10.1016/j.jbiotec.2009.05.001. Epub 2009 May 14. J Biotechnol. 2009. PMID: 19446584 Review.
Cited by
-
Dynamic global acetylation remodeling during the yeast heat shock response.bioRxiv [Preprint]. 2025 Jan 10:2025.01.10.632339. doi: 10.1101/2025.01.10.632339. bioRxiv. 2025. PMID: 39935887 Free PMC article. Preprint.
-
Genomic analysis and potential polyhydroxybutyrate (PHB) production from Bacillus strains isolated from extreme environments in Mexico.BMC Microbiol. 2025 Jan 11;25(1):15. doi: 10.1186/s12866-024-03713-7. BMC Microbiol. 2025. PMID: 39799315 Free PMC article.
References
-
- Cloern JE, Jassby AD, Schraga TS, Nejad E, Martin C. Ecosystem variability along the estuarine salinity gradient: Examples from long-term study of San Francisco Bay. Limnol Oceanogr. 2017;62(S1):S272–S291. doi: 10.1002/lno.10537. - DOI
-
- Trenberth KE, Shea DJ. Relationships between precipitation and surface temperature. Geophys Res Lett. 2005;32:L14703.
-
- Wang X, Vignjevic M, Liu F, Jacobsen S, Jiang D, Wollenweber B. Drought priming at vegetative growth stages improves tolerance to drought and heat stresses occurring during grain filling in spring wheat. Plant Growth Regul. 2014;75(3):677–687. doi: 10.1007/s10725-014-9969-x. - DOI
-
- Yadav R, Juneja S, Kumar S. Cross priming with drought improves heat-tolerance in chickpea (Cicer arietinum L.) by stimulating small heat shock proteins and antioxidative defense. Environ Sustain. 2021;4(1):171–82. doi: 10.1007/s42398-020-00156-4. - DOI
MeSH terms
Substances
Grants and funding
LinkOut - more resources
Full Text Sources
Molecular Biology Databases
