. 2024 Jul 4;23(1):136.
doi: 10.1186/s12943-024-02031-w.

Polyamine and EIF5A hypusination downstream of c-Myc confers targeted therapy resistance in BRAF mutant melanoma

Affiliations

Polyamine and EIF5A hypusination downstream of c-Myc confers targeted therapy resistance in BRAF mutant melanoma

Byung-Sun Park et al. Mol Cancer. .

Abstract

Background: BRAF inhibitors are widely employed in the treatment of melanoma with the BRAF V600E mutation. However, the development of resistance compromises their therapeutic efficacy. Diverse genomic and transcriptomic alterations are found in BRAF inhibitor resistant melanoma, posing a pressing need for convergent, druggable target that reverse therapy resistant tumor with different resistance mechanisms.

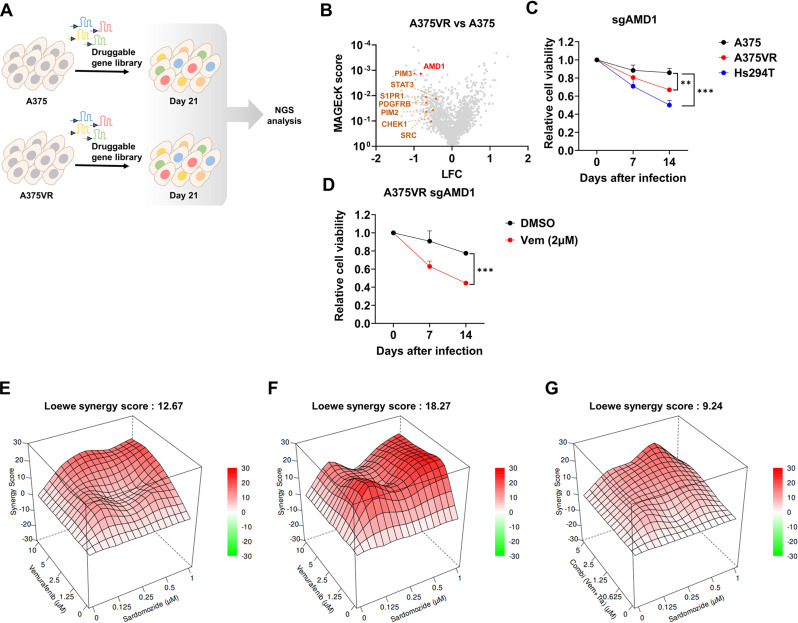
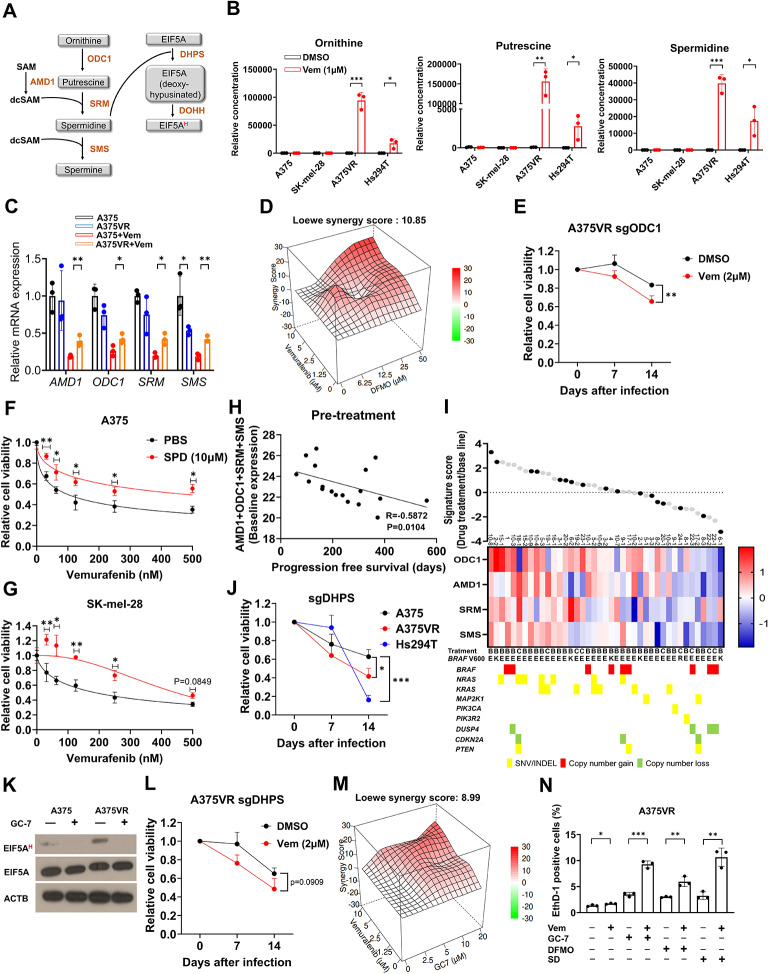
Methods: CRISPR-Cas9 screens were performed to identify novel target gene whose inhibition selectively targets A375VR, a BRAF V600E mutant cell line with acquired resistance to vemurafenib. Various in vitro and in vivo assays, including cell competition assay, water soluble tetrazolium (WST) assay, live-dead assay and xenograft assay were performed to confirm synergistic cell death. Liquid Chromatography-Mass Spectrometry analyses quantified polyamine biosynthesis and changes in proteome in vemurafenib resistant melanoma. EIF5A hypusination dependent protein translation and subsequent changes in mitochondrial biogenesis and activity were assayed by O-propargyl-puromycin labeling assay, mitotracker, mitoSOX labeling and seahorse assay. Bioinformatics analyses were used to identify the association of polyamine biosynthesis with BRAF inhibitor resistance and poor prognosis in melanoma patient cohorts.

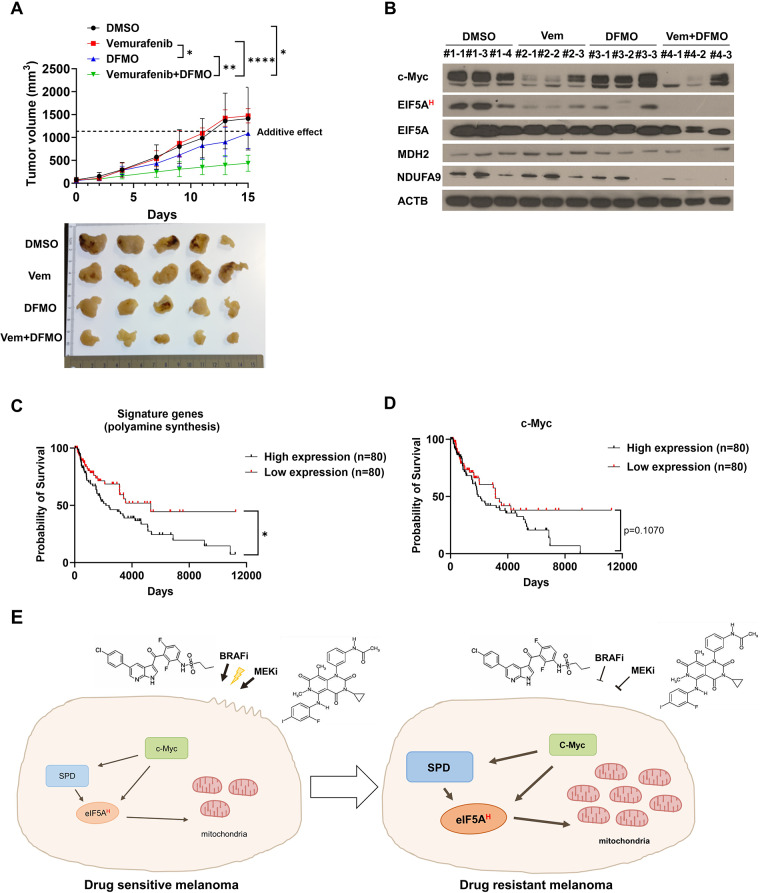
Results: We elucidate the role of polyamine biosynthesis and its regulatory mechanisms in promoting BRAF inhibitor resistance. Leveraging CRISPR-Cas9 screens, we identify AMD1 (S-adenosylmethionine decarboxylase 1), a critical enzyme for polyamine biosynthesis, as a druggable target whose inhibition reduces vemurafenib resistance. Metabolomic and proteomic analyses reveal that polyamine biosynthesis is upregulated in vemurafenib-resistant cancer, resulting in enhanced EIF5A hypusination, translation of mitochondrial proteins and oxidative phosphorylation. We also identify that sustained c-Myc levels in vemurafenib-resistant cancer are responsible for elevated polyamine biosynthesis. Inhibition of polyamine biosynthesis or c-Myc reversed vemurafenib resistance both in vitro cell line models and in vivo in a xenograft model. Polyamine biosynthesis signature is associated with poor prognosis and shorter progression free survival after BRAF/MAPK inhibitor treatment in melanoma cohorts, highlighting the clinical relevance of our findings.

Conclusions: Our findings delineate the molecular mechanisms involving polyamine-EIF5A hypusination-mitochondrial respiration pathway conferring BRAF inhibitor resistance in melanoma. These targets will serve as effective therapeutic targets that can maximize the therapeutic efficacy of existing BRAF inhibitors.

Keywords: BRAF; Drug resistance; Hypusination; Melanoma; Mitochondria; Polyamine; Vemurafenib; c-Myc.


Conflict of interest statement

The authors declare that they have no competing interests.

Figures

Fig. 1
Fig. 1
AMD1 inactivation sensitizes BRAF mutant melanoma to vemurafenib. A Schematic diagram of CRISPR-Cas9 screening used in this study. B Volcano plot analyzed by MAGeCK. C GFP competition assay using GFP-sgAMD1 expression construct in indicated cell lines (n = 3). D GFP competition assay in A375VR treated with DMSO or vemurafenib (n = 3). E-F Drug synergy score of vemurafenib and sardomozide calculated by SynergyFinder using Loewe model in E A375VR, and F Hs294T. G Drug synergy score of vemurafenib + trametinib combination and sardomozide in A375VR. Vemurafenib and Trametinib were treated as 2-fold dilution starting from 5µM and 5nM, respectively. All drugs were treated for 72 h (E-G). All plots indicate mean ± s.d. Student’s t-test was used to determine statistical significance for C and D. *, p < 0.05; **, p < 0.01; ***,p < 0.001; ****,p < 0.0001
Fig. 2
Fig. 2
Polyamine synthesis is upregulated and critical in vemurafenib resistance. A Schematic diagram of polyamine biosynthesis pathway. B quantification of ornithine, putrescine and spermidine in melanoma cell lines (n = 3). All cells were treated with vemurafenib (1µM) or DMSO for 48 h and harvested for polyamine quantification (see methods). C Relative mRNA expressions of polyamine synthesis genes in A375 and A375VR after 24 h of vemurafenib treatment (n = 3). D Drug synergy score (using Loewe model) of vemurafenib and DFMO in A375VR. E GFP competition assay using GFP-sgODC1 in A375VR treated with vemurafenib (n = 3). F-G Vemurafenib dose response curve of indicated cells with or without spermidine supplementation (n = 3). Vemurafenib and spermidine were treated for 72 h. H Correlation between progression free survival and the expression of polyamine synthesis genes before drug treatment in melanoma patient cohort described in Hugo et. al [5]. Gene expression is presented as log fragments per kilobase of transcript per million (FPKM). Correlation coefficient is calculated as non-parametric Spearman’s r. I Log fold changes (LFC) of polyamine synthesis related genes after indicated drug treatment in patient cohort described in (H). Black circles indicate patient samples of harboring no gene mutations causing MAPKi resistance). J GFP competition assay using GFP-sgDHPS in indicated cell lines (n = 3). K Immunoblots of EIF5A hypusination in A375 and A375VR treated with GC-7 for 48 h. L GFP competition assay using GFP-sgDHPS in A375VR treated with vemurafenib (n = 3). M Drug synergy score (using Loewe model) of vemurafenib and GC-7 in A375VR. N Quantification of cell death with A375VR cells treated with indicated drug combinations for 24 h using Live/dead cell staining assay. Vemurafenib: 2µM, GC-7: 5µM, DFMO: 100µM, and SD (sardomozide): 0.5µM (n = 3). All plots indicate mean ± s.d. Student’s t-test was used to determine statistical significance for B-C, E-G, J, L and N. *, p < 0.05; **, p < 0.01; ***,p < 0.001; ****,p < 0.0001
Fig. 3
Fig. 3
Hypusination and upregulation of mitochondrial respiration are critical for vemurafenib resistance. A Differential proteomic analysis between indicated groups using mass spectrometry. Mitochondrial proteins are highlighted in red. B Gene ontology analysis of proteins significantly upregulated in group 2 compared to both groups 1 and 3 in (A). C Schematic diagram of protein translation accelerated by hypusinated EIF5A. D Immunoblots of EIF5A hypusination and 2 mitochondrial proteins. E O-propargyl-puromycin (OPP)-labeled pull down assay of indicated proteins. GC-7 (10µM) was treated for 48 h for cell harvest, and PBS was treated for negative control of GC-7. F Schematic diagram of reporter gene for analyzing translation rate of protein containing mitochondrial targeting sequence (MTS). G-H Reporter assay described in (F) with indicated MTS in the presence or absence of GC-7 (10µM) in A375VR (n = 3). I Western blot analysis of EIF5A hypusination and mitochondrial proteins in A375VR cells treated with indicated drugs for 48 h. GC-7: 10µM, DFMO: 200 µM, SD (Sardomozide): 2µM. J western blot analysis of EIF5A hypusination and mitochondrial proteins in A375VR-Cas9 cells expressing indicated sgRNAs. K-L Mitotracker deep red staining (K) and MitoSOX staining (L) with A375 and A375VR cells treated with DFMO (100µM) or PBS (n = 3). M Oxygen consumption rate of A375 and A375VR cells treated with indicated drug for 48 h (n = 3). N Basal respiration and maximal respiration data from (M). O Drug synergy score (using Loewe model) of vemurafenib and IACS-010759 combination in A375VR. Vemurafenib and IACS-010759 were treated for 72 h. One way ANOVA was used for testing statistical significance unless otherwise indicated for G-H, K-L and N. All plots indicate mean ± s.d. *, p < 0.05; **, p < 0.01; ***,p < 0.001; ****,p < 0.0001
Fig. 4
Fig. 4
Persistent c-Myc activation underlies enhanced polyamine biosynthesis in vemurafenib resistant melanoma A Immunoblots of EIF5A hypusination, c-Myc, and mitochondrial proteins in A375 and A375VR cells treated with vemurafenib (1µM) for 48 h. B Immunoblots of A375VR cells treated with indicated drug combinations (Vem: 1µM, JQ-1: 1µM, SPD: 10µM) for 48 h. C Drug synergy score (using Loewe model) of vemurafenib and JQ-1 in A375VR. D Western blot analysis of A375VR cells treated with indicated shRNA and indicated materials (Vem: 1µM, SPD: 10µM) for 48 h. E Cell viability assay with A375VR expressing indicated shRNA treated with SPD (10µM) or PBS (n = 3) for 72 h. F-G Mitotracker deep red staining (F) and MitoSOX staining (G) with A375VR cells treated with JQ-1 (1µM) for 24 h (n = 3). H-I Mitotracker deep red staining (H) and MitoSOX staining (I) with A375VR cells expressing indicated shRNAs. shGFP was used as a negative control. J mRNA expressions of PPARGC1A (PGC1α) in parental and VR cells of A375 and SK-mel-28 (n = 3). K-L Fold change in PGC1α (K) and c-Myc (L) mRNA expression upon vemurafenib treatment (1µM) for 24 h (n = 3). M Immunoblots of A375VR cells treated with indicated drugs (Vem: 1 µM, GC-7: 10µM) for 48 h. N Immunoblots of A375 cells treated with indicated drugs for 48 h (Vem: 1µM, SPD: 10µM). O Immunoblots of A375VR-Cas9 cells expressing indicated sgRNA. P Cell viability assay after vemurafenib treatment for 72 h in A375VR-Cas9 cells expressing indicated sgRNAs. Numbers below blots in A and D indicate normalized densitometry values calculated by Image J. All plots indicate mean ± s.d. Student’s t-test was used to determine statistical significance for E-L. *, p < 0.05; **, p < 0.01; ***,p < 0.001; ****,p < 0.0001
Fig. 5
Fig. 5
Inhibition of polyamine biosynthesis synergizes with vemurafenib in treating BRAF mutant melanomain vivo. A Tumor volume of A375VR xenograft model (n = 5). Vemurafenib: 20 mg/kg, DFMO: (2% w/v) in drinking water. Additive effect was calculated with Bliss independence model. Student’s t-test was used to determine statistical significance. B Western blot analysis in xenograft tumors treated with indicated drug combinations for 15 days. C Kaplan-Meier curves for BRAF V600E melanoma patients in TCGA classified with polyamine synthesis signature score. D Kaplan-Meier curves for patients in (C) classified with c-Myc expression level. E Schematic diagram of c-Myc-polyamine axis promoting vemurafenib resistance. All plots indicate mean ± s.d. *, p < 0.05; **, p < 0.01; ***,p < 0.001; ****,p < 0.0001

Similar articles

Cited by

References

    1. Cheng L, Lopez-Beltran A, Massari F, MacLennan GT, Montironi R. Molecular testing for BRAF mutations to inform melanoma treatment decisions: a move toward precision medicine. Mod Pathol. 2018;31:24–38. doi: 10.1038/modpathol.2017.104. - DOI - PMC - PubMed
    1. Kakadia S, Yarlagadda N, Awad R, Kundranda M, Niu J, Naraev B, Mina L, Dragovich T, Gimbel M, Mahmoud F. Mechanisms of resistance to BRAF and MEK inhibitors and clinical update of US Food and Drug Administration-approved targeted therapy in advanced melanoma. Onco Targets Ther. 2018;11:7095–107. doi: 10.2147/OTT.S182721. - DOI - PMC - PubMed
    1. Subbiah V, Baik C, Kirkwood JM. Clinical Development of BRAF plus MEK inhibitor combinations. Trends Cancer. 2020;6:797–810. doi: 10.1016/j.trecan.2020.05.009. - DOI - PubMed
    1. Tian J, Chen JH, Chao SX, Pelka K, Giannakis M, Hess J, Burke K, Jorgji V, Sindurakar P, Braverman J, et al. Combined PD-1, BRAF and MEK inhibition in BRAF(V600E) colorectal cancer: a phase 2 trial. Nat Med. 2023;29:458–66. doi: 10.1038/s41591-022-02181-8. - DOI - PMC - PubMed
    1. Hugo W, Shi H, Sun L, Piva M, Song C, Kong X, Moriceau G, Hong A, Dahlman KB, Johnson DB, et al. Non-genomic and Immune Evolution of Melanoma acquiring MAPKi Resistance. Cell. 2015;162:1271–85. doi: 10.1016/j.cell.2015.07.061. - DOI - PMC - PubMed

MeSH terms