. 2024 Jul 5;22(1):396.
doi: 10.1186/s12951-024-02666-3.

Injective hydrogel loaded with liposomes-encapsulated MY-1 promotes wound healing and increases tensile strength by accelerating fibroblast migration via the PI3K/AKT-Rac1 signaling pathway

Affiliations

Injective hydrogel loaded with liposomes-encapsulated MY-1 promotes wound healing and increases tensile strength by accelerating fibroblast migration via the PI3K/AKT-Rac1 signaling pathway

Chunhao Zhou et al. J Nanobiotechnology. .

Abstract

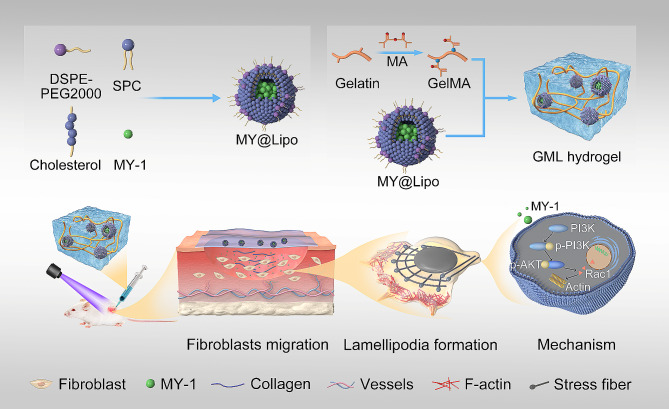
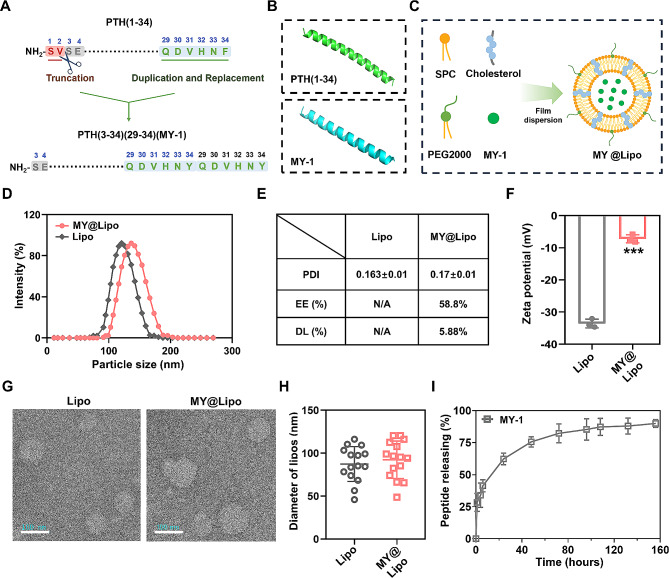
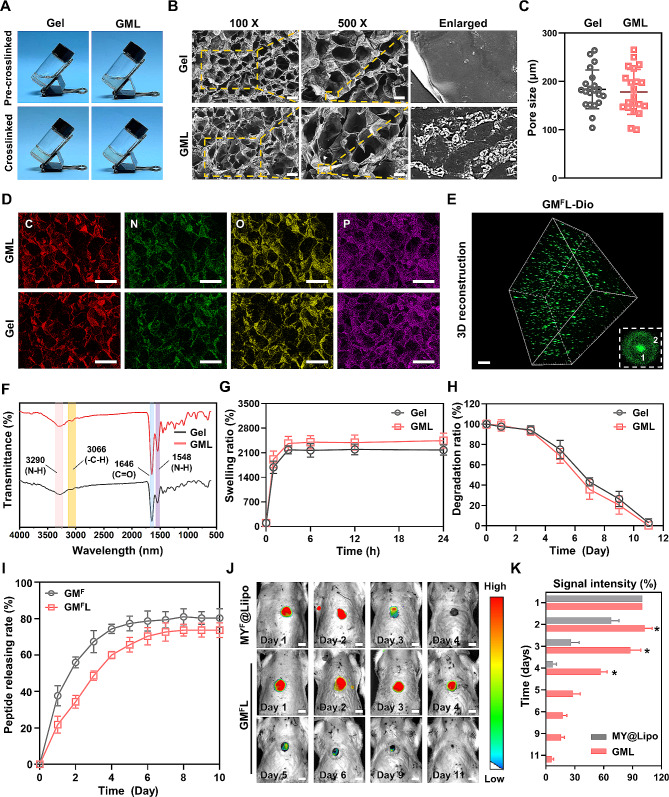
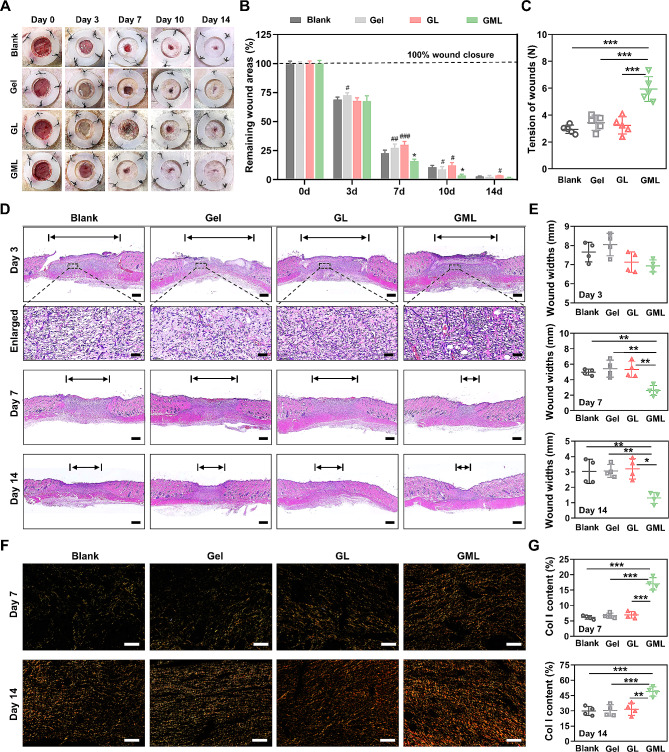
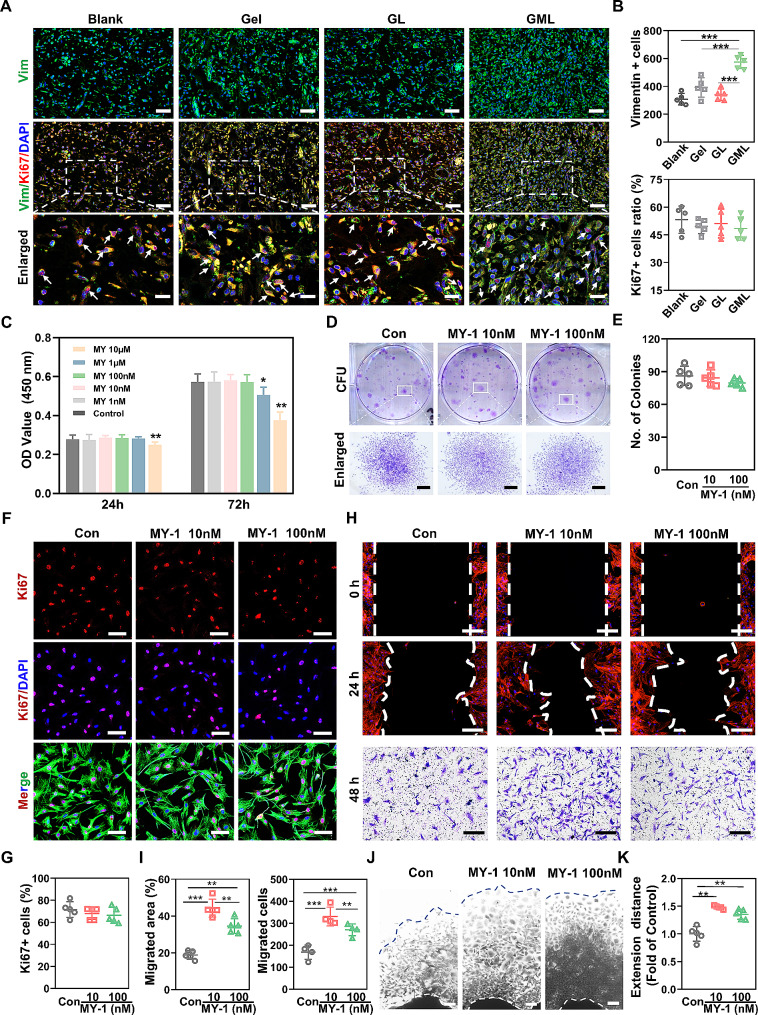
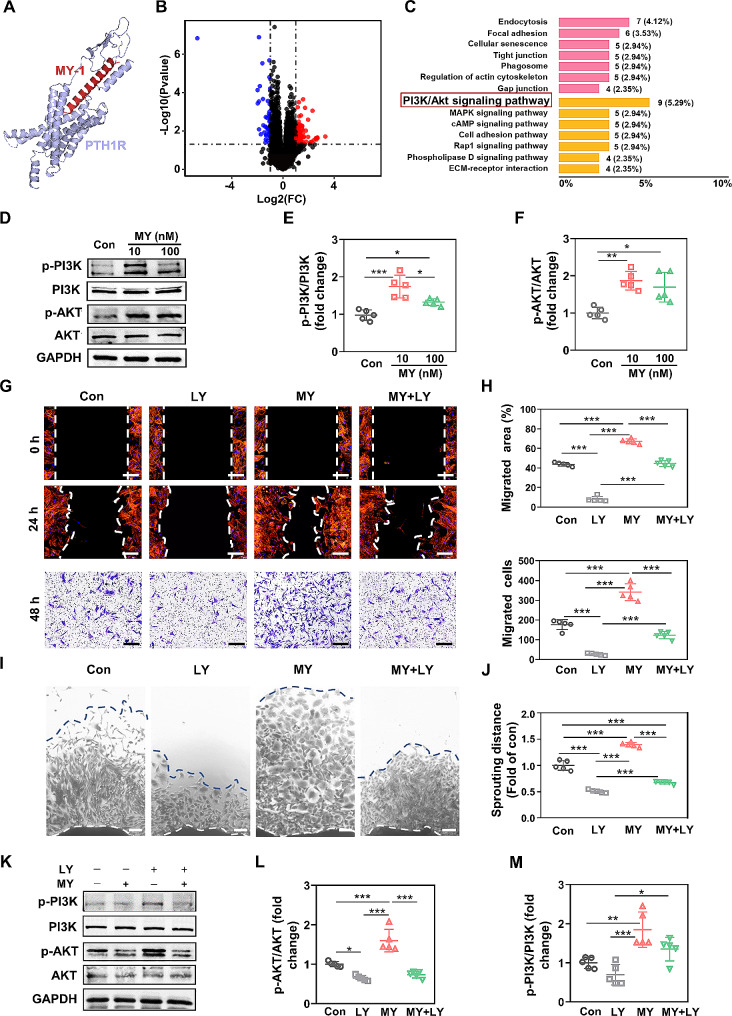
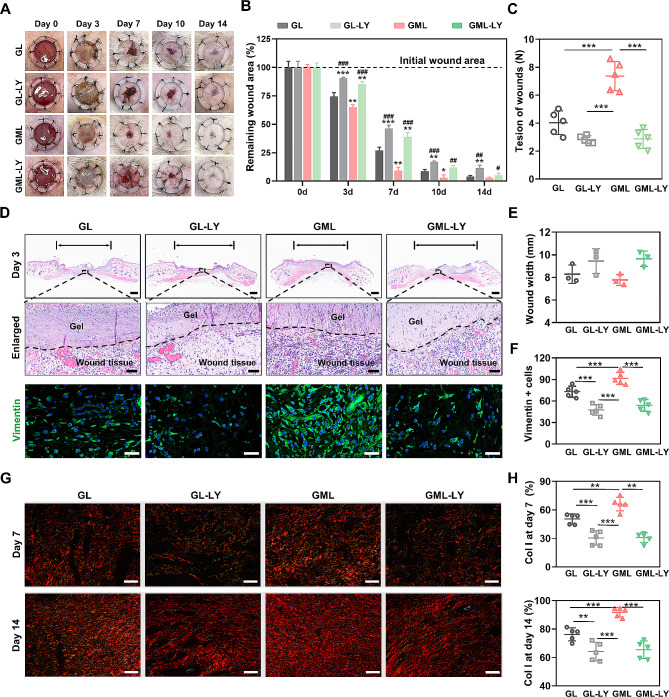
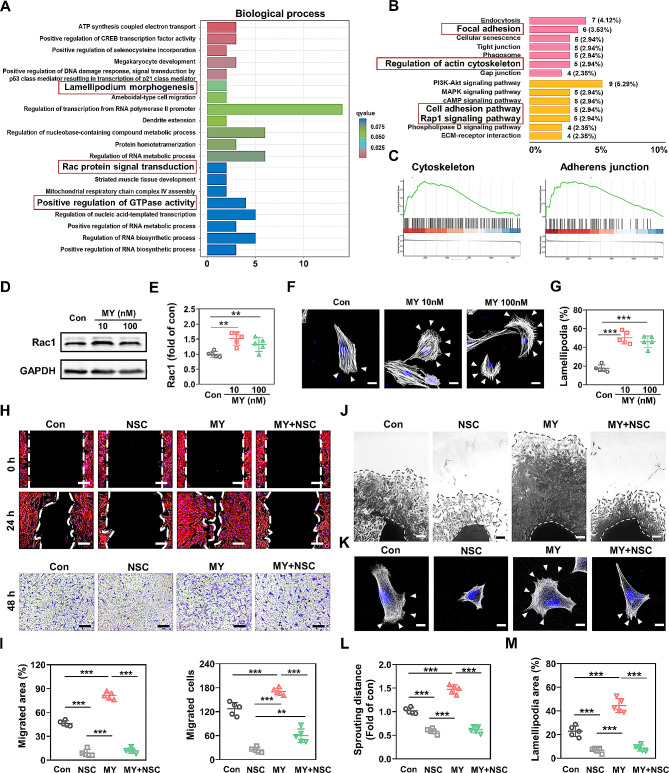
Failed skin wound healing, through delayed wound healing or wound dehiscence, is a global public health issue that imposes significant burdens on individuals and society. Although the application of growth factor is an effective method to improve the pace and quality of wound healing, the clinically approved factors are limited. Parathyroid hormone (PTH) demonstrates promising results in wound healing by promoting collagen deposition and cell migration, but its application is limited by potentially inhibitory effects when administered continuously and locally. Through partially replacing and repeating the amino acid domains of PTH(1-34), we previously designed a novel PTH analog, PTH(3-34)(29-34) or MY-1, and found that it avoided the inhibitory effects of PTH while retaining its positive functions. To evaluate its role in wound healing, MY-1 was encapsulated in liposomes and incorporated into the methacryloyl gelatin (GelMA) hydrogel, through which an injectable nanocomposite hydrogel (GelMA-MY@Lipo, or GML) was developed. In vitro studies revealed that the GML had similar properties in terms of the appearance, microstructure, functional groups, swelling, and degradation capacities as the GelMA hydrogel. In vitro drug release testing showed a relatively more sustainable release of MY-1, which was still detectable in vivo 9 days post-application. When the GML was topically applied to the wound areas of rat models, wound closure as well as tensile strength were improved. Further studies showed that the effects of GML on wound repair and tensile strength were closely related to the promotion of fibroblast migration to the wound area through the controlled release of MY-1. Mechanically, MY-1 enhanced fibroblast migration by activating PI3K/AKT signaling and its downstream molecule, Rac1, by which it increased fibroblast aggregation in the early stage and resulting in denser collagen deposition at a later time. Overall, these findings demonstrated that the nanocomposite hydrogel system promoted skin wound healing and increased tensile strength, thus offering new potential in the treatment of wound healing.

Keywords: Cell migration; GelMA; Liposome; PI3K/AKT; Rac1; Wound healing; hPTH(3–34)(29–34).


Conflict of interest statement

The authors declare no competing interests.

Figures

Fig. 1
Fig. 1
Schematic illustration of how GML hydrogel was fabricated and the mechanism by which GML promoted the wound healing
Fig. 2
Fig. 2
Design of MY-1 and characterization of the liposomes. Schematic illustration of how MY-1 was designed (A). The three-dimensional structure of MY-1 and PTH(1–34) was reconstructed using Alphafold 3 software (B). Schematic illustration of the MY-1 encapsulation process into liposomes (C). The hydrodynamic diameters of the liposomes with or without MY-1 (D). The dispersity index (PDI), encapsulation efficiency (EE), and the drug loading capacity (DL) of the liposomes with/without MY-1 (E). Zeta potential of the liposomes with/without MY-1 (F). SEM images and diameters of the liposomes with or without MY-1 (G and H). MY-1 was encapsulated into liposomes and immersed in PBS, the peptide releasing speed was calculated by the amount ratio of MY-1 in PBS over MY-1 in total at a certain time point (I). Data are expressed as mean ± SD. The experiments were repeated three times with similar results. ***, p < 0.001. Scale bars: 100 nm in (G)
Fig. 3
Fig. 3
Characterization of the GelMA and GML hydrogels. The gelation of GelMA (Gel) and GML hydrogels after exposed to the ultraviolet ray for 40 s (A). The microstructure of GelMA and GLM was investigated by SEM (B). Pore size of Gel and GMLwas measured base on SEM images (C). The Chemical elements of carbon (C), nitrogen (N), oxygen (O) and phosphorus (P) in Gel and GML were analyzed by EDS spectrum (D). 3D views of MY-1-FITC in the Dio-labeled liposomes (MYF@Lipo-Dio) in the GelMA scaffold was evaluated using a confocal microscope. Dio (green) was used to label the member of liposomes (Symbol ‘2’ in the upper panel, green), and FITC was used to characterize the MY-1 in the core (Symbol ‘1’ in the upper panel, green) (E). FTIR spectroscopy was carried out to detect the characteristic peaks of Gel and GML (F). In vitro swelling was quantified by the weight ratio of hydrogels maintained in PBS at 37 ℃ versus its freeze-dried weight at time zero (G). Gel and GML hydrogels were immersed in PBS at 37 ℃, the degradation properties of the materials were presented by the ratio of remaining to the original amount of the freeze-dried hydrogels at time zero (H). MYF@Lipo and then incorporated into GelMA (GMLF) and immersed in 10 mL PBS, the peptide releasing speed was calculated by the amount ratio of FITC in PBS over FITC in total at a certain time point (I). Full-thickness skin wounds with a diameter of 15 mm were applied with MYF@Lipo or GMLF (J) and the intensity of FITC was measured (K). The remaining FITC presented the amount of peptide in the wound. Data were expressed as mean ± SD. The experiments were repeated three times with similar results. *, p < 0.05. Scale bars: 200 μm and100 μm in (B), 200 μm in (D), 10 μm in (E) and 5 mm in (J)
Fig. 4
Fig. 4
Application of GML hydrogel accelerated skin wound healing and increased tensile strength. Full-thickness skin wounds with a diameter of 15 mm were generated on the back of SD rats. PBS, Gel, GL, or GML were applied into the defects and then covered with sterilized dressing. Wound closure was investigated and photographed at certain time point as indicated (A). The unclosed wound area at each time point of four treatments were quantified (B). The tensile strength of the wounds treated by the above treatments were also measured as indicated in the material and methods section (C). Microscopic structure was demonstrated by histological sectioning and HE staining (D) at day 3, 7 and 14. The wound width (day 3, day 7 and 14) were quantified (E). Components of collagen were demonstrated by Picrosirius red staining and investigated by polarized light microscopy at day 7 and 14 (F), and the deposition of type I collagen was quantified and presented as percentage of collagen I in all collagen components (G). Data were expressed as mean ± SD. The experiments were repeated three times with similar results. *, p < 0.05; **, p < 0.01; ***, p < 0.001 versus Blank group. #, p < 0.05; ##, p < 0.01; ###, p < 0.001 versus GML group. Scale bar: 1 mm and 50 μm in (D), 200 μm in (F)
Fig. 5
Fig. 5
MY-1 enhanced the motility of fibroblasts in vivo and in vitro. Histological sections of skin wounds were prepared as described in Fig. 3. Expressions of Vimentin and Ki67 were demonstrated by IF staining (A). The nucleus was stained with DAPI. The number of Vimentin+ cells (fibroblasts) were quantified (B, upper panel). The ratio of K67+  and Vimentin+ fibroblasts to Vimentin+  fibroblastspresented the proliferation portion of fibroblasts (B, lower panel). Fibroblasts proliferation was analyzed by CCK-8 assay (C) and colony formation units counting (D and E). Expressions of Vimentin and Ki67 in fibroblasts were also demonstrated by IF staining (F) and quantified as described above (G). Cell migration was demonstrated by cell scratching test (H, upper panels) and transwell assay (H, lowest panel). The area that refilled with migrated cells were measured and calculated to the proportion of originally scratched cell free area (I). The cells that migrated crossed the apertures were counted (I). The cells that grew and extended from dermal patches after 5 days of MY-1 addition were visualized (J) and quantified (K) as described in materials and methods. Data were expressed as mean ± SD. The in vitro experiments were repeated three times with similar results. *, p < 0.05; **, p < 0.01; ***, p < 0.001. Scale bars: Scale bars: 50 μm and 25 μm in (A), 500 μm in (D), 100 μm in (F), 200 μm in (H), and 150 μm in (J)
Fig. 6
Fig. 6
MY-1-enhanced fibroblasts motility was mediated by PI3K/AKT signaling. The docking between MY-1 and PTH1R were simulated by AutoDock software (A). The gene expression profile was explored by transcriptome. Volcano plot images exhibited the gene upregulated or downregulated by MY-1 (B). The signaling pathway that regulated prominently by 10 nM MY-1 was carried out by KEGG pathway analysis (C). The expressions of p-PI3K and p-AKT in fibroblasts were analyzed by western blot (D). The intensity of each band was measure and normalized to total PI3K or AKT then calculated as the ratio of the controls (E and F). Cell scratching test and transwell assay were employed to investigate the migration of fibroblasts treated with 10 nM MY-1 with or without PI3K inhibitor LY (10 µM) for 24–48 h (G and H). Dermis explants assays were performed as described in Fig. 5(I and J). After the fibroblasts treated with MY-1 with or without 10 µM LY, the expressions of p-PI3K and p-AKT in fibroblasts were quantified as described above (KM). Data were expressed as mean ± SD of triple samples, and three repeated experiments yielded similar results. *, p < 0.05; **, p < 0.01; ***, p < 0.001. Scale bars: 200 μm in (G) and 150 μm in (I)
Fig. 7
Fig. 7
Inhibition of PI3K/AKT signaling attenuated the effect of MY-1 on skin wound healing. Full-thickness skin wound was generated as described in Fig. 4. GL, GL-LY, and GML with or without LY were applied to the defects. Wound closure was investigated at the indicated time point (A). The unclosed wound area was quantified (B). The tensile strength of the wounds treated by the above treatments were measured at day 14 (C). At day 3, the histological sections of the wound area were prepared and stained with HE and IF of Vimentin (D). The wound width was measured (E) and the Vimentin+ cells per 40× field of view were counted (F). Picrosirius red staining, and the analyses of type I collagen content (G and H) were performed as described in Fig. 4. Data were shown as mean ± SD. *, p < 0.05; **, p < 0.01; ***, p < 0.001 versus GL group. #, p < 0.05; ##, p < 0.01; ###, p < 0.001 versus GML group. Scale bars: 3 mm in (A), 1 mm and 50 μm in (D), 200 μm in (G)
Fig. 8
Fig. 8
Rac1 was involved in MY-1-induced fibroblast migration. Transcriptome analysis was same as Fig. 6. Gene ontology analysis (A), KEGG pathway analysis (B), and Gene Set Enrichment Analysis (C) were performed to explore the effect of MY-1 on primary dermal fibroblasts. The expression level of Rac1 was detected by western blot (D) and the intensity of each band was quantified and normalized to GAPDH and then calculated to the ratio of control group (E). The cytoskeleton of migrating cells was stained with rhodamine-phalloidin, lamellipodia area of each cell were measured (F) and converted in percentage to the total area of the cell (G). Cell scratching test and transwell assays were performed (H), the recovered area and migrated cells (I) were quantified as described in materials and methods section. The cells grew out of dermis explants was investigated and quantified as the farthest distance of cell sprouting (J and L).. Demonstrations of the cytoskeleton of migrating cells were same as described above (K and M). Data are expressed as mean ± SD of triple samples and three repeated experiments yielded similar results. *, p < 0.05; **, p < 0.01; ***, p < 0.001. Scale bars: 20 μm in (F) and (K), 200 μm in (H) and 150 μm in (J)
Fig. 9
Fig. 9
Rac1 expression and its cellular location were regulated by PI3K/AKT signaling. After treated by MY-1, with or without LY (10 µM), lamellipodia area in primary dermal fibroblasts were demonstrated by rhodamine-phalloidin staining (A) and quantification (B) as described in Fig. 8. IF staining of Rac1 in migrating fibroblasts was performed and the cellular location of Rac1 was revealed by confocal microscopy (C). The cellular distribution of Rac1, F-actin and nucleus was measured as described in materials and methods (D). Data are expressed as mean ± SD of triple samples and three repeated experiments yielded similar results.*, p < 0.05; **, p < 0.01; ***, p < 0.001. Scale bars: 20 μm in (A) and (C)

Similar articles

Cited by

References

    1. Rosen RD. and B M. Wound Dehiscence. In: StatPearls [Internet]. Treasure Island (FL): StatPearls Publishing; 2023 Jan. https://www.ncbi.nlm.nih.gov/books/NBK551712/?report.
    1. Sandy-Hodgetts K, Carville K, Leslie GD. Determining risk factors for surgical wound dehiscence: a literature review. Int Wound J. 2015;12:265–75. doi: 10.1111/iwj.12088. - DOI - PMC - PubMed
    1. Barreiro G, de Lima VS, Cavazzola LT. Abdominal skin tensile strength in aesthetic and massive weight loss patients and its role in ventral hernia repair. Bmc Surg. 2019;19:68. doi: 10.1186/s12893-019-0523-7. - DOI - PMC - PubMed
    1. Saxena A, Dubey M, Saha GK, Tiwari D, Tyagi S, Singh RA. A prospective comparison of Octyl-2-Cyanoacrylate and suture in facial wounds. J Pharm Bioallied Sci. 2023;15:S1145–8. doi: 10.4103/jpbs.jpbs_187_23. - DOI - PMC - PubMed
    1. Yuk H, Varela CE, Nabzdyk CS, Mao X, Padera RF, Roche ET, Zhao X. Dry double-sided tape for adhesion of wet tissues and devices. Nature. 2019;575:169–74. doi: 10.1038/s41586-019-1710-5. - DOI - PubMed