. 2024 Jul 4;26(1):113.
doi: 10.1186/s13058-024-01866-x.

GNA13 suppresses proliferation of ER+ breast cancer cells via ERα dependent upregulation of the MYC oncogene

Affiliations

GNA13 suppresses proliferation of ER+ breast cancer cells via ERα dependent upregulation of the MYC oncogene

Lalitha Vaishnavi Subramanyan et al. Breast Cancer Res. .

Abstract

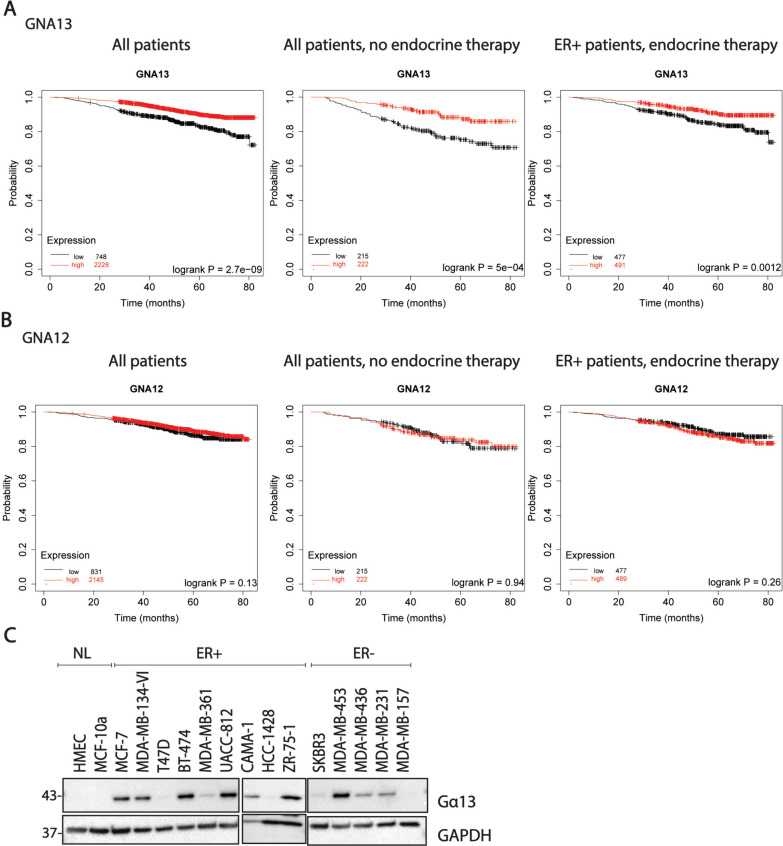
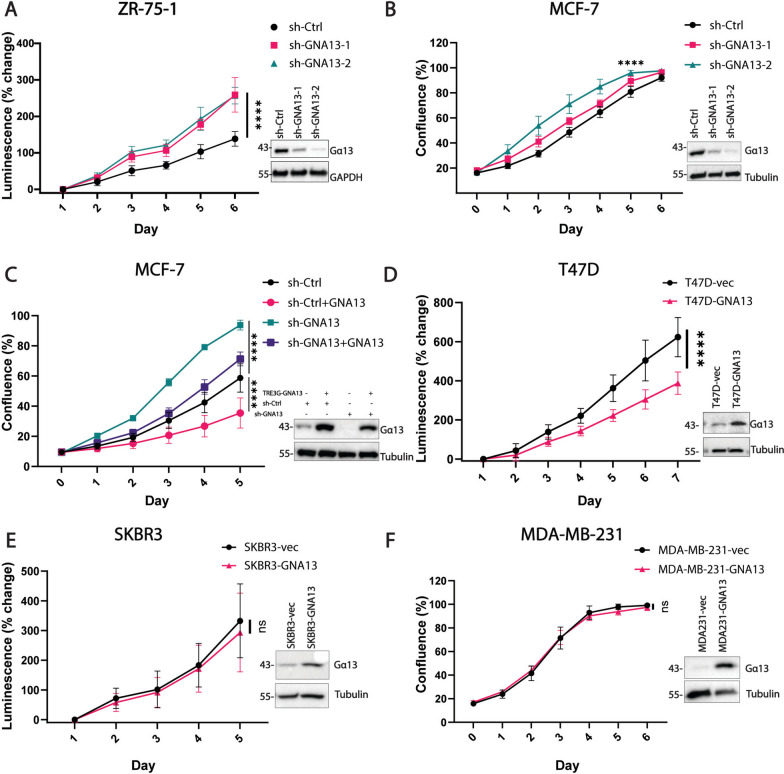
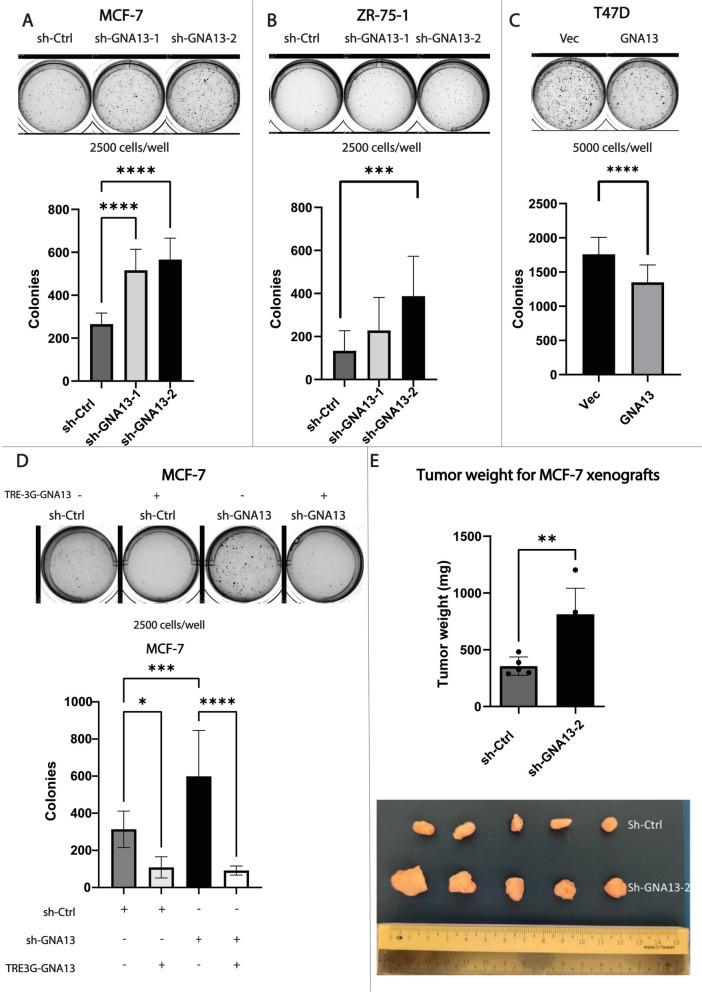
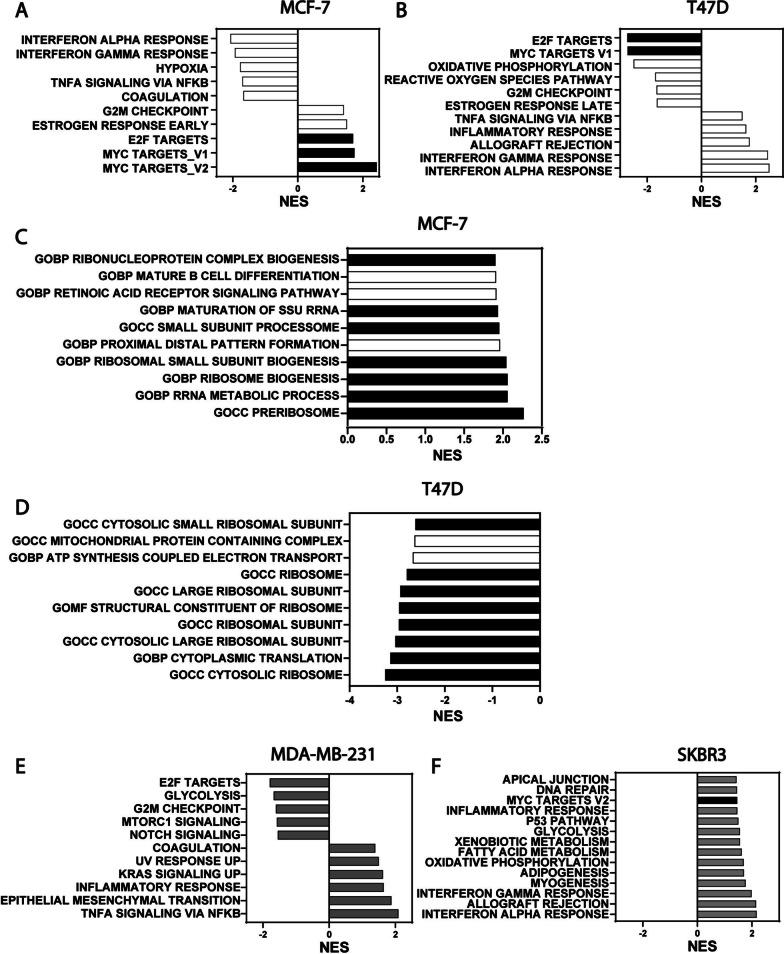
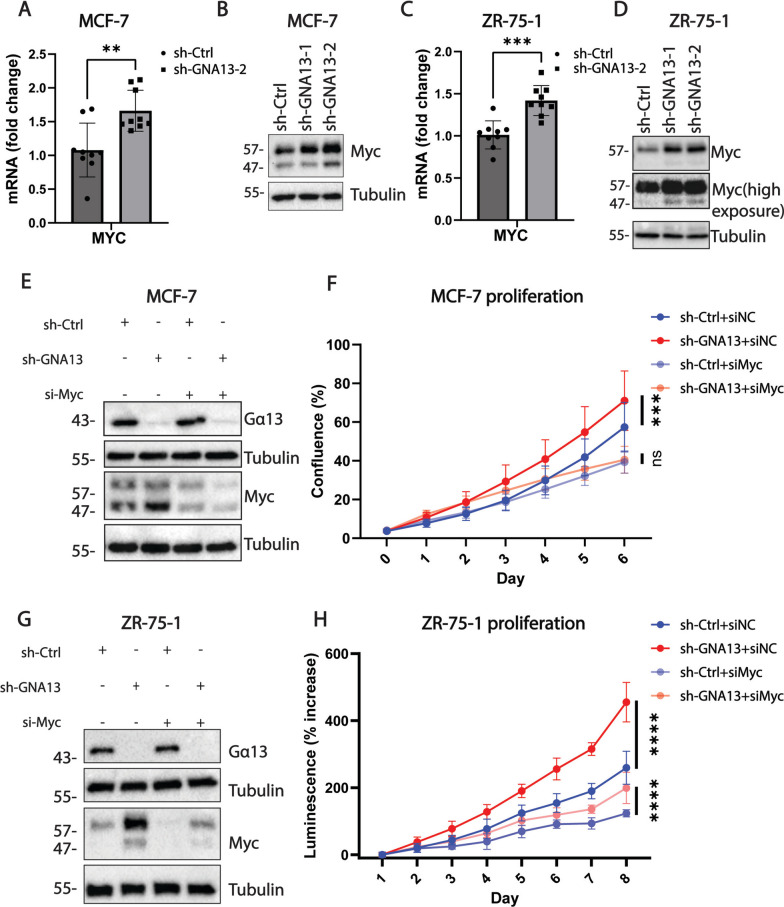
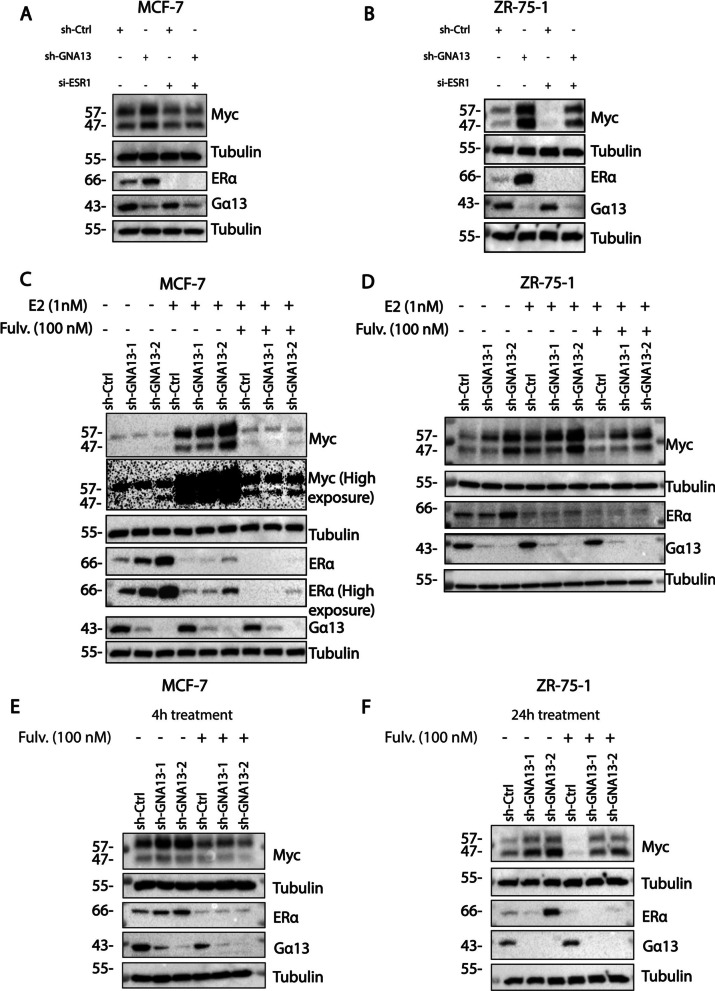
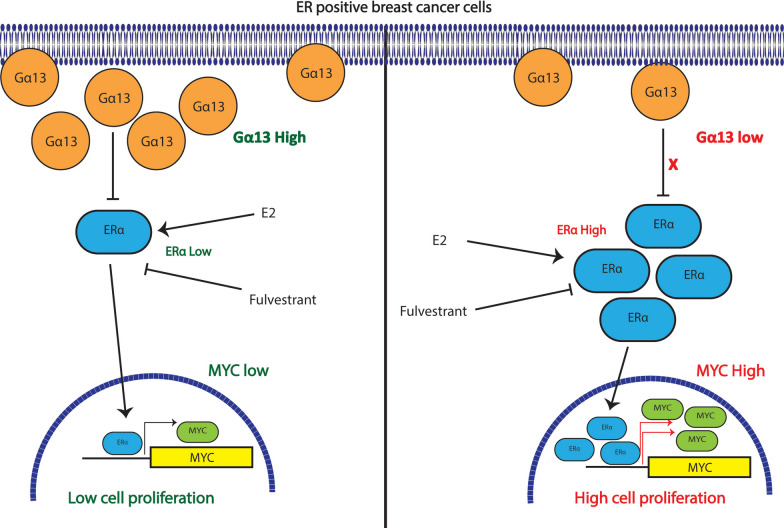
GNA13 (Gα13) is one of two alpha subunit members of the G12/13 family of heterotrimeric G-proteins which mediate signaling downstream of GPCRs. It is known to be essential for embryonic development and vasculogenesis and has been increasingly shown to be involved in mediating several steps of cancer progression. Recent studies found that Gα13 can function as an oncogene and contributes to progression and metastasis of multiple tumor types, including ovarian, head and neck and prostate cancers. In most cases, Gα12 and Gα13, as closely related α-subunits in the subfamily, have similar cellular roles. However, in recent years their differences in signaling and function have started to emerge. We previously identified that Gα13 drives invasion of Triple Negative Breast Cancer (TNBC) cells in vitro. As a highly heterogenous disease with various well-defined molecular subtypes (ER+ /Her2-, ER+ /Her2+, Her2+, TNBC) and subtype associated outcomes, the function(s) of Gα13 beyond TNBC should be explored. Here, we report the finding that low expression of GNA13 is predictive of poorer survival in breast cancer, which challenges the conventional idea of Gα12/13 being universal oncogenes in solid tumors. Consistently, we found that Gα13 suppresses the proliferation in multiple ER+ breast cancer cell lines (MCF-7, ZR-75-1 and T47D). Loss of GNA13 expression drives cell proliferation, soft-agar colony formation and in vivo tumor formation in an orthotopic xenograft model. To evaluate the mechanism of Gα13 action, we performed RNA-sequencing analysis on these cell lines and found that loss of GNA13 results in the upregulation of MYC signaling pathways in ER+ breast cancer cells. Simultaneous silencing of MYC reversed the proliferative effect from the loss of GNA13, validating the role of MYC in Gα13 regulation of proliferation. Further, we found Gα13 regulates the expression of MYC, at both the transcript and protein level in an ERα dependent manner. Taken together, our study provides the first evidence for a tumor suppressive role for Gα13 in breast cancer cells and demonstrates for the first time the direct involvement of Gα13 in ER-dependent regulation of MYC signaling. With a few exceptions, elevated Gα13 levels are generally considered to be oncogenic, similar to Gα12. This study demonstrates an unexpected tumor suppressive role for Gα13 in ER+ breast cancer via regulation of MYC, suggesting that Gα13 can have subtype-dependent tumor suppressive roles in breast cancer.


Conflict of interest statement

The authors declare no competing interests.

Figures

Fig. 1
Fig. 1
High Gα13 expression predicts better survival in breast cancers. A Kaplan–Meier plot showing the association between expression of GNA13 and overall survival in breast cancer in patients in response to all treatment modalities (left); treatments other than endocrine therapy (center) or ER+ breast cancer patients given endocrine therapy (right) B Kaplan–Meier plot showing the association between expression of GNA12 and overall survival in breast cancer in patients in response to all treatment modalities (left); treatments other than endocrine therapy (center) or ER+ breast cancer patients endocrine therapy (right) (data obtained from Kmplotter, www.kmplot.com) C Immunoblot showing the levels of Gα13 in a panel of breast cancer cell lines. HMeC, MCF-10a are non-tumorigenic. MCF-7, T47D, MDA-MB-134-VI belong to luminal A subtype (ER +). BT-474, MDA-MB-361, UACC-812 are luminal B(ER+), SKBR3 and MDA-MB-453 are ER- Her2+ and MDA-MB-436, MDA-MB-231 and MDA-MB-157 belong to TNBC. These immunoblots are representative of three independent experiments
Fig. 2
Fig. 2
Gα13 negatively impacts proliferation uniquely in ER+ breast cancer cells. A Viability assay to measure proliferation of ER+ ZR-75-1 cells expressing control shRNA or that targeting GNA13 as indicated. (Inset) immunoblot showing levels of Gα13 in the respective ZR-75-1 cell lines. B Proliferation of ER+ MCF-7 cells, expressing control shRNA or that targeting GNA13 as indicated, determined by confluence measurements using the live cell imaging platform IncuCyte®. (Inset) Immunoblot showing levels of Gα13 in the respective MCF-7 cell lines. C Proliferation of MCF-7 knockdown cells upon reintroduction of GNA13 as indicated, determined as in (B) (Inset) Immunoblot showing expression of Gα13 in the respective MCF-7 cell lines. D Cell viability assay to measure proliferation of ER+ T47D cells, expressing vector alone or that harboring GNA13, as indicated. (Inset) Immunoblot showing levels of Gα13 in the indicated ER+ T47D cell lines. E Proliferation of ER-/Her2+ SKBR3 cells expressing vector only or that containing GNA13. (Inset) Immunoblot showing levels of Gα13 in the respective SKBR3 cell lines. F Proliferation of ER−/Her2− MDA-MB-231 cells expressing either vector or that harboring GNA13. (Inset) Immunoblot showing levels of Gα13 in the respective MDA-MB-231 cells. All results shown are pooled data from three independent experiments. Data is presented as mean ± SD, and p-values are denoted as: *, p < 0.05, **, p < 0.01, ***, p < 0.001, and ****, p < 0.0001 or ‘ns’ for ‘not significant’. All Immunoblots are representative images of three independent experiments of the cells from the corresponding proliferation assays. See Experimental Procedures for details
Fig. 3
Fig. 3
Gα13 negatively impacts soft agar colony formation and in vivo tumorigenesis in ER+ breast cancer cells. A Soft agar colony formation in MCF-7 cells. MCF-7 cells, expressing control shRNA or that targeting GNA13 as indicated, were subject to soft colony formation assay as described in Experimental Procedures. Top: image showing colonies formed 21 days post seeding. Bottom: quantification of the number of colonies formed. B Soft agar colony formation in ZR-75-1 cells. ZR-75-1 cells expressing control shRNA or that targeting GNA13 as indicated, were subject to soft agar colony as in (A). Top: image showing colonies formed 21 days post seeding. Bottom: quantification of the number of colonies formed. C Soft agar colony formation in T47D cells. T47D cells, expressing vector alone or that harboring GNA13 as indicated, were subject to soft agar colony as in (A). Top: image showing colonies formed 21 days post seeding. Bottom: quantification of the number of colonies formed. D Soft agar colony formation assay in MCF-7 knockdown cells following reintroduction of GNA13. MCF-7 GNA13 knockdown cells, expressing vector alone or that harboring GNA13 as indicated, were subject to soft agar colony as in (A). Top: image showing colonies formed 21 days post seeding. Bottom: Quantification of the number of colonies formed. E Top: quantification of weight of tumors at the endpoint of in vivo tumor formation studies. Bottom: images of tumors post excision. For AD, results shown are pooled data from three independent experiments. Plotted data is presented as mean ± SD, and p-values are denoted as: *, p < 0.05, **, p < 0.01, ***, p < 0.001, and ****, p < 0.0001 or ‘ns’ for ‘not significant’. All colony images are representative of three independent experiments. See Experimental Procedures for details
Fig. 4
Fig. 4
RNA sequencing analysis of ER+ breast cancer cells reveal a connection between GNA13 expression and Myc-related signaling pathways. For all experiments, cells were harvested at 80% confluence and processed as described in Experimental Procedures. A RNA sequencing analysis of MCF-7 sh-Control cells and those in which GNA13 was silenced with sh-GNA13-2. Shown are the results of GSEA Hallmark analysis showing the top five pathways up-and downregulated upon GNA13 silencing. B RNA sequencing analysis of T47D expressing either vector or that harboring-GNA13. Shown are the results of GSEA Hallmark analysis showing top five pathways up-and downregulated upon GNA13 overexpression in T47D cells. C Results of GSEA GO analysis showing top pathways upregulated upon GNA13 knockdown in MCF-7 cells from (A). D Results of GSEA GO analysis showing top pathways downregulated upon GNA13 overexpression in T47D cells from (B). E RNA sequencing analysis of MDA-MB-231 expressing either vector or that harboring GNA13. Shown are the results of GSEA Hallmark analysis showing the top five pathways up-and downregulated upon GNA13 overexpression in MDA-MB-231 cells. F RNA sequencing analysis of SKBR3 expressing either vector or that harboring GNA13. Shown are the results of GSEA Hallmark analysis showing top pathways upregulated upon GNA13 overexpression in SKBR3 cells. Pathways highlighted in black represent MYC and related pathways. All pathways represented have nominal p-value < 0.05 and FDR < 0.25. All RNA sequencing experiments were performed in triplicate
Fig. 5
Fig. 5
Gα13 suppresses the expression of MYC, and loss of MYC reverses the proliferative phenotype observed upon GNA13 silencing in ER+ breast cancer cells. A MYC mRNA levels in MCF-7 cells upon GNA13 silencing, RNA levels were assessed by real-time PCR; relative mRNA expression plotted as fold-change to control cells (sh-GNA13-2 compared to sh-control), HPRT was used a normalizing control. B Immunoblot showing the expression of MYC upon GNA13 silencing in MCF-7 cells. C MYC mRNA levels in ZR-75-1 cells upon GNA13 silencing, RNA levels were assessed as in (A). D Immunoblot showing the expression of MYC upon GNA13 knockdown in ZR-75-1 cells. E Immunoblot showing Gα13 and MYC levels in MCF-7 cells (sh-Control and sh-GNA13-2) with or without silencing of MYC. F proliferation of ER+ MCF-7 cells in (E) as determined by confluence measurements using the live cell imaging platform IncuCyte®. G Immunoblot showing Gα13 and MYC levels in ZR-75-1 cells (sh-Control and sh-GNA13-2) with or without silencing of MYC. H Proliferation of ER+ ZR-75-1 cells in (G). Results shown are pooled data from three independent experiments. Plotted data is presented as mean ± SD, and p-values are denoted as: *, p < 0.05, **, p < 0.01, ***, p < 0.001, and ****, p < 0.0001 or ‘ns’ for ‘not significant’. All immunoblots are representative of three independent experiments. See Experimental Procedures for details
Fig. 6
Fig. 6
Increased levels of MYC observed upon GNA13 loss is context dependent. A Immunoblot showing the levels of MYC upon ESR1 silencing in MCF-7 sh-Control and sh-GNA13 cells. B Immunoblot showing the levels of MYC upon ESR1 silencing in ZR-75-1 sh-Control and sh-GNA13 cells. C Immunoblot showing estradiol dependent induction of MYC in MCF-7 cells, MCF-7 cells were deprived of estradiol by treating in Charcoal-Stripped FBS media for 72 h, and then stimulated with either 1 nM E2 in presence or absence of 100 nM fulvestrant for 6h. D Immunoblot showing estradiol dependent induction of MYC expression in ZR-75-1 cells, ZR-75-1 cells were deprived of Estradiol by treating in Charcoal-Stripped FBS media for 48 h, and then stimulated with either 1 nM E2 in presence or absence of 100 nM fulvestrant for 6h. E Immunoblot showing the levels of MYC in MCF-7 cells (sh-Control, sh-GNA13-1, shGNA13-2) cells upon estrogen signaling inhibition using 100 nM Fulvestrant for 4h. F Immunoblot showing the levels of MYC in ZR-75-1 cells (sh-Control, sh-GNA13-1, sh-GNA13-2) cells upon estrogen signaling inhibition using 100 nM Fulvestrant for 24h.For immunoblots, results shown are representative of three independent experiments
Fig. 7
Fig. 7
Schematic diagram showing the findings from this study: in the ER+ subtype, loss of GNA13 results in increased proliferation and tumor formation suggesting a tumor suppressive role for GNA13 in this subtype. This phenotype is dependent on upregulation of MYC signaling pathway observed upon GNA13 silencing exclusively in ER+ cell lines, where loss of GNA13 drives the expression of MYC through increasing ERα driven estrogen signalling

Similar articles

References

    1. Arnold M, Morgan E, Rumgay H, Mafra A, Singh D, Laversanne M, et al. Current and future burden of breast cancer: global statistics for 2020 and 2040. Breast. 2022;66:15–23. doi: 10.1016/j.breast.2022.08.010. - DOI - PMC - PubMed
    1. Goldhirsch A, Wood WC, Coates AS, Gelber RD, Thürlimann B, Senn HJ. Strategies for subtypes-dealing with the diversity of breast cancer: highlights of the St Gallen international expert consensus on the primary therapy of early breast cancer 2011. Ann Oncol. 2011;22:1736–1747. doi: 10.1093/annonc/mdr304. - DOI - PMC - PubMed
    1. Garrido-Castro AC, Lin NU, Polyak K. Insights into molecular classifications of triple-negative breast cancer: improving patient selection for treatment. Cancer Discov. 2019;9:176–198. doi: 10.1158/2159-8290.CD-18-1177. - DOI - PMC - PubMed
    1. Lumachi F. Current medical treatment of estrogen receptor-positive breast cancer. World J Biol Chem. 2015;6:231. doi: 10.4331/wjbc.v6.i3.231. - DOI - PMC - PubMed
    1. Lei JT, Anurag M, Haricharan S, Gou X, Ellis MJ. Endocrine therapy resistance: new insights. Breast. 2019;48:S26–30. doi: 10.1016/S0960-9776(19)31118-X. - DOI - PMC - PubMed

MeSH terms

Substances

LinkOut - more resources