

Dysregulated proteasome activity and steroid hormone biosynthesis are associated with mortality among patients with acute COVID-19
- PMID: 38965561
- PMCID: PMC11229496
- DOI: 10.1186/s12967-024-05342-0
Dysregulated proteasome activity and steroid hormone biosynthesis are associated with mortality among patients with acute COVID-19
Abstract
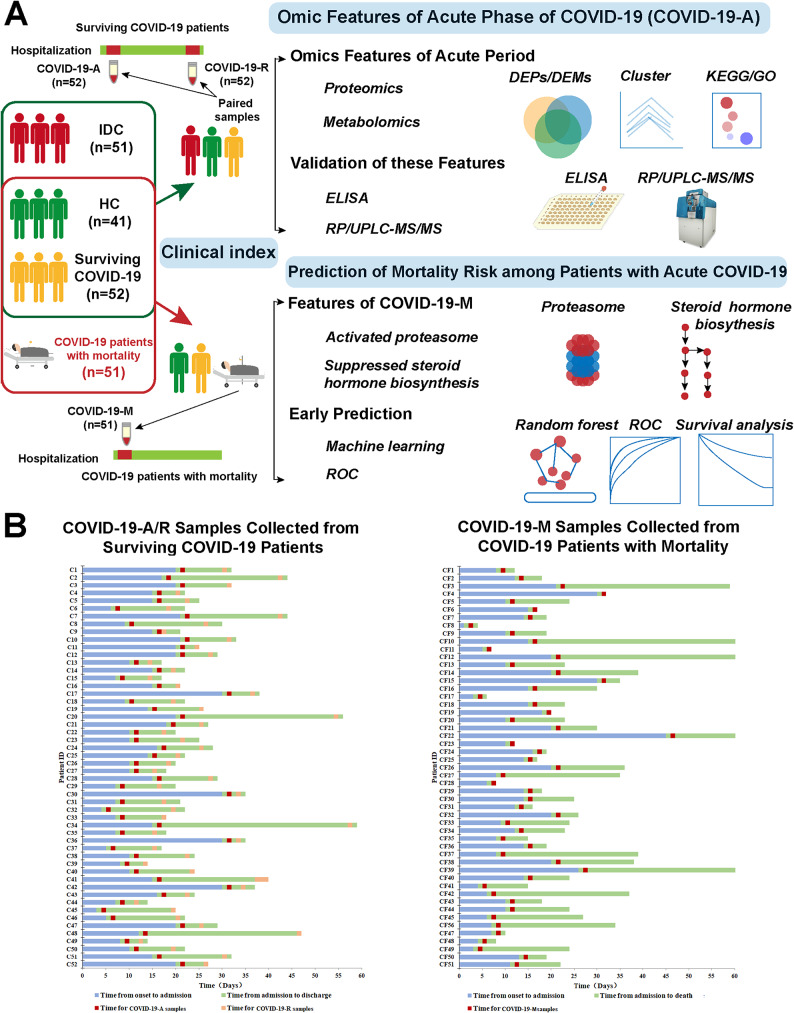
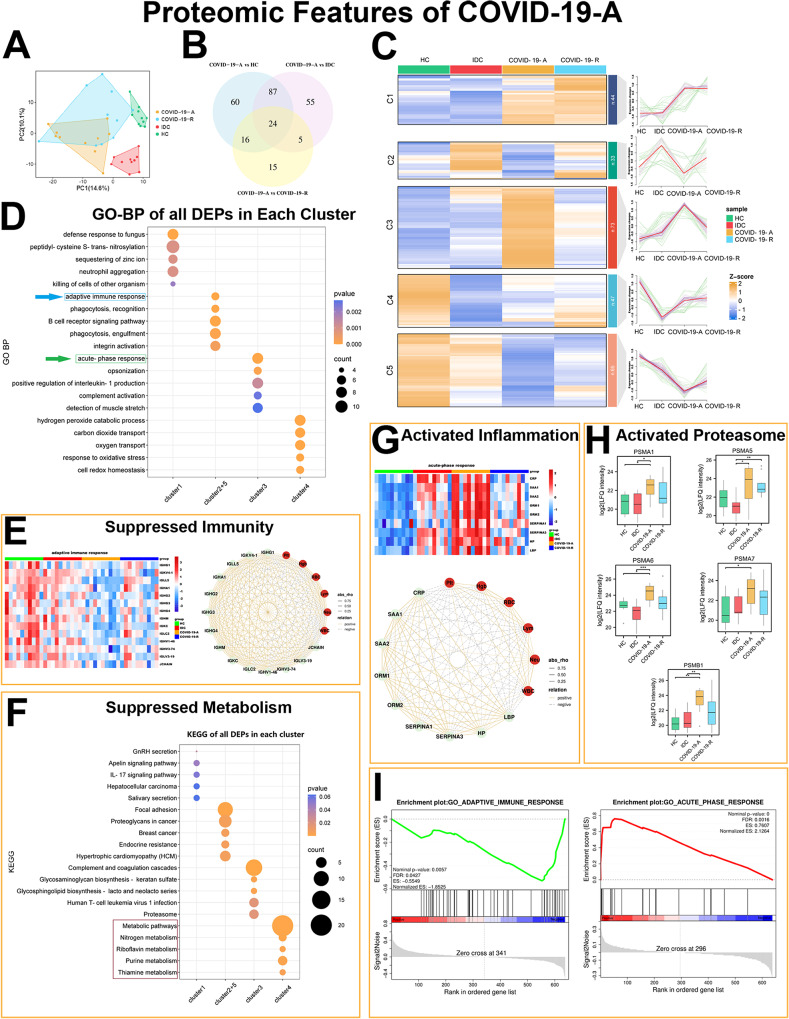
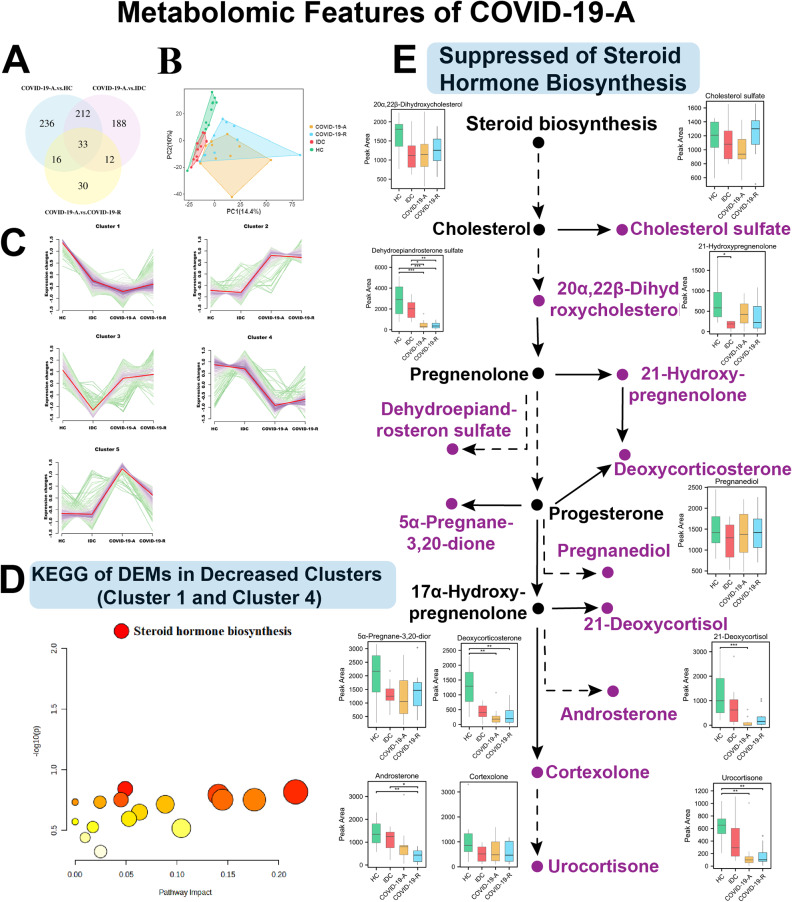
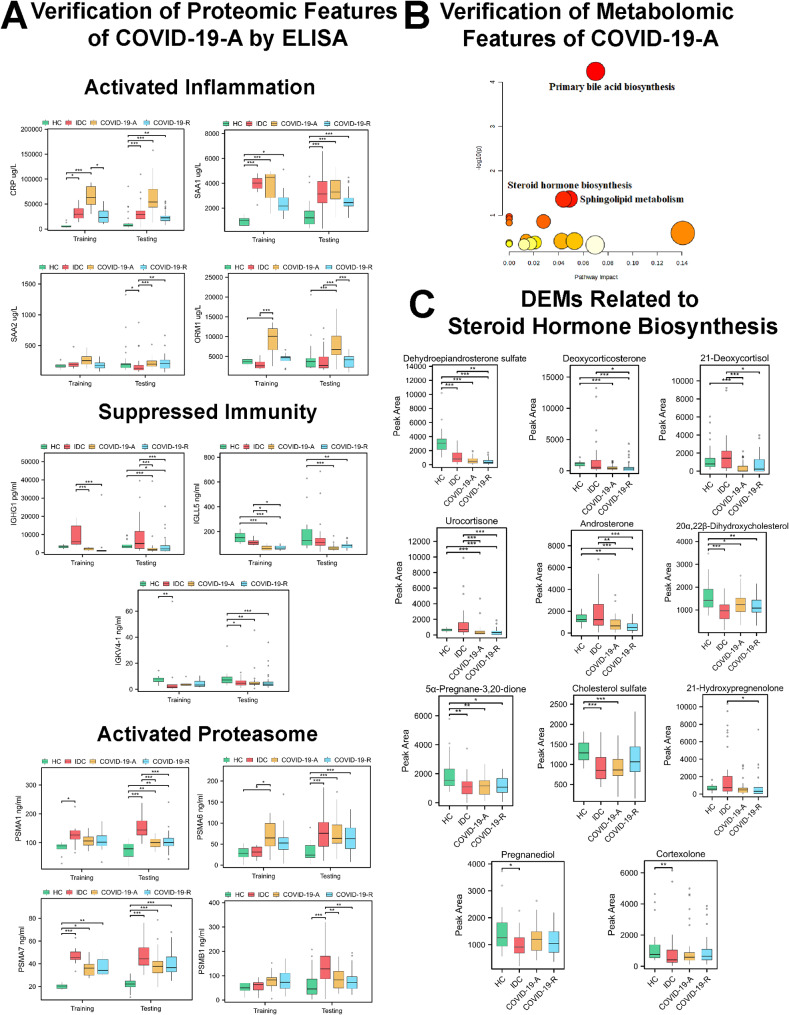
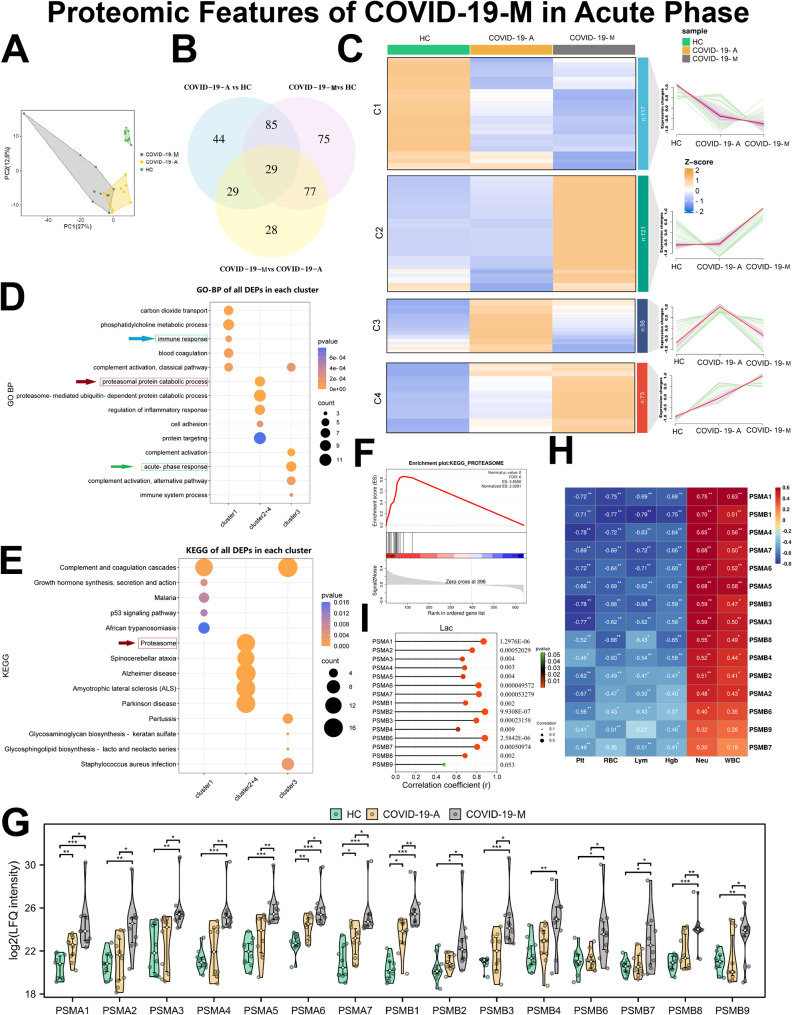
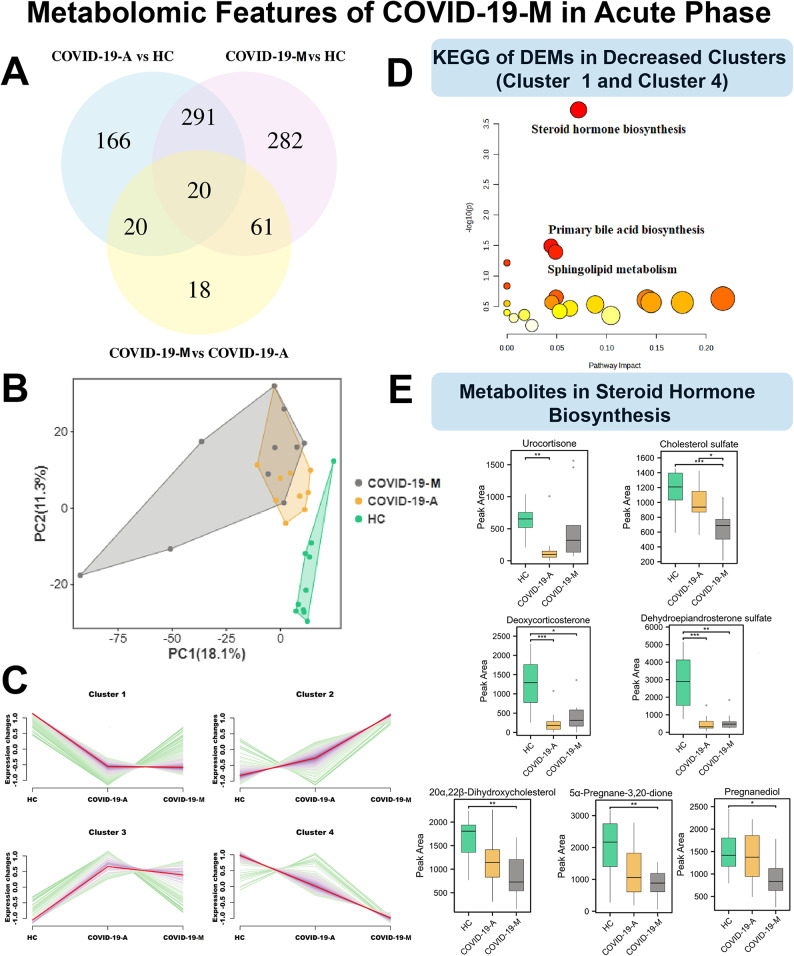
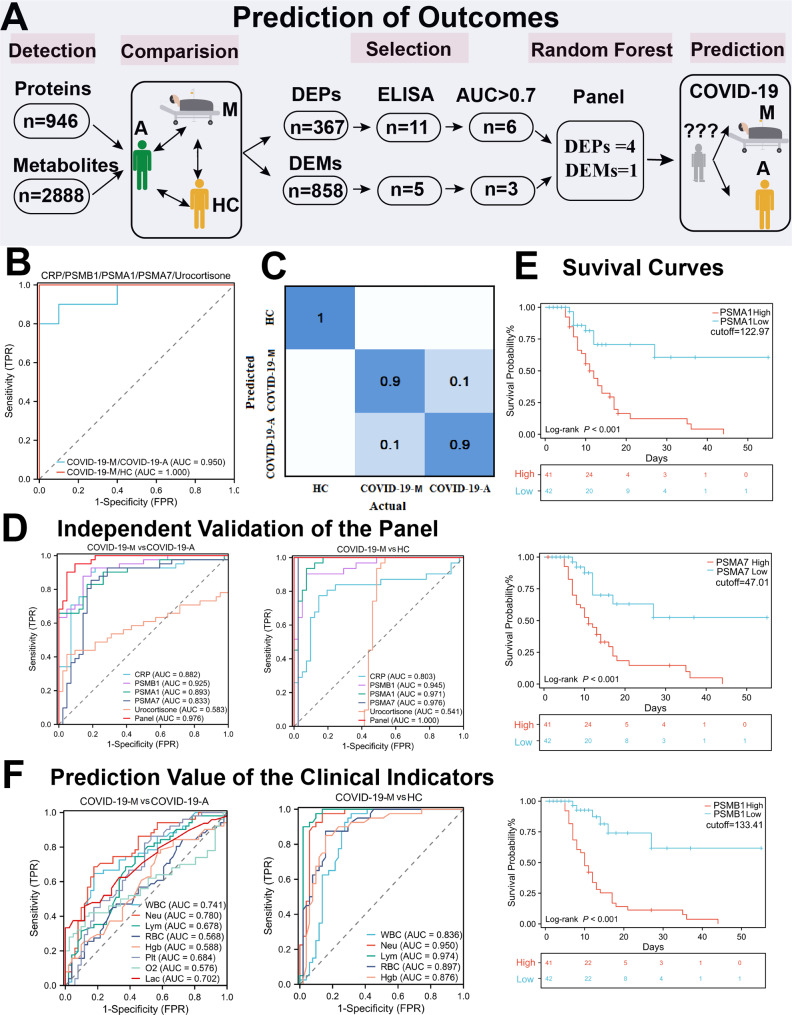
The persistence of coronavirus disease 2019 (COVID-19)-related hospitalization severely threatens medical systems worldwide and has increased the need for reliable detection of acute status and prediction of mortality. We applied a systems biology approach to discover acute-stage biomarkers that could predict mortality. A total 247 plasma samples were collected from 103 COVID-19 (52 surviving COVID-19 patients and 51 COVID-19 patients with mortality), 51 patients with other infectious diseases (IDCs) and 41 healthy controls (HCs). Paired plasma samples were obtained from survival COVID-19 patients within 1 day after hospital admission and 1-3 days before discharge. There were clear differences between COVID-19 patients and controls, as well as substantial differences between the acute and recovery phases of COVID-19. Samples from patients in the acute phase showed suppressed immunity and decreased steroid hormone biosynthesis, as well as elevated inflammation and proteasome activation. These findings were validated by enzyme-linked immunosorbent assays and metabolomic analyses in a larger cohort. Moreover, excessive proteasome activity was a prominent signature in the acute phase among patients with mortality, indicating that it may be a key cause of poor prognosis. Based on these features, we constructed a machine learning panel, including four proteins [C-reactive protein (CRP), proteasome subunit alpha type (PSMA)1, PSMA7, and proteasome subunit beta type (PSMB)1)] and one metabolite (urocortisone), to predict mortality among COVID-19 patients (area under the receiver operating characteristic curve: 0.976) on the first day of hospitalization. Our systematic analysis provides a novel method for the early prediction of mortality in hospitalized COVID-19 patients.
Keywords: Acute phase; COVID-19; Mortality; Omics; Prediction.
© 2024. The Author(s).
Conflict of interest statement
The authors declare that they have no competing interests.
Figures
Similar articles
-
Oxidative Stress Markers and Prediction of Severity With a Machine Learning Approach in Hospitalized Patients With COVID-19 and Severe Lung Disease: Observational, Retrospective, Single-Center Feasibility Study.JMIR Form Res. 2025 Apr 11;9:e66509. doi: 10.2196/66509. JMIR Form Res. 2025. PMID: 40215478 Free PMC article.
-
Cytokine Profiles Associated With Worse Prognosis in a Hospitalized Peruvian COVID-19 Cohort.Front Immunol. 2021 Sep 1;12:700921. doi: 10.3389/fimmu.2021.700921. eCollection 2021. Front Immunol. 2021. PMID: 34539631 Free PMC article.
-
Machine Learning to Predict Mortality and Critical Events in a Cohort of Patients With COVID-19 in New York City: Model Development and Validation.J Med Internet Res. 2020 Nov 6;22(11):e24018. doi: 10.2196/24018. J Med Internet Res. 2020. PMID: 33027032 Free PMC article.
-
Early Prediction of COVID-19 Patient Survival by Targeted Plasma Multi-Omics and Machine Learning.Mol Cell Proteomics. 2022 Oct;21(10):100277. doi: 10.1016/j.mcpro.2022.100277. Epub 2022 Aug 3. Mol Cell Proteomics. 2022. PMID: 35931319 Free PMC article.
-
Biomarkers and outcomes of COVID-19 hospitalisations: systematic review and meta-analysis.BMJ Evid Based Med. 2021 Jun;26(3):107-108. doi: 10.1136/bmjebm-2020-111536. Epub 2020 Sep 15. BMJ Evid Based Med. 2021. PMID: 32934000 Free PMC article.
Cited by
-
Mendelian randomization analysis to identify potential drug targets for osteoarthritis.PLoS One. 2025 Feb 11;20(2):e0316824. doi: 10.1371/journal.pone.0316824. eCollection 2025. PLoS One. 2025. PMID: 39932908 Free PMC article.
-
Longitudinal multi-omics analysis of convalescent individuals with respiratory sequelae 6-36 months after COVID-19.BMC Med. 2025 Mar 5;23(1):134. doi: 10.1186/s12916-025-03971-w. BMC Med. 2025. PMID: 40038650 Free PMC article.
References
-
- Adjei S, Hong K, Molinari NM, Bull-Otterson L, Ajani UA, Gundlapalli AV, et al. Mortality risk among patients hospitalized primarily for COVID-19 during the omicron and Delta variant pandemic periods - United States, April 2020-June 2022. MMWR Morbidity Mortal Wkly Rep. 2022;71(37):1182–9. doi: 10.15585/mmwr.mm7137a4. - DOI - PMC - PubMed
-
- Link-Gelles R, Weber ZA, Reese SE, Payne AB, Gaglani M, Adams K, et al. Estimates of Bivalent mRNA vaccine durability in preventing COVID-19-Associated hospitalization and critical illness among adults with and without Immunocompromising conditions - VISION Network, September 2022-April 2023. MMWR Morbidity Mortal Wkly Rep. 2023;72(21):579–88. doi: 10.15585/mmwr.mm7221a3. - DOI - PMC - PubMed
-
- Chan JF, Yuan S, Kok KH, To KK, Chu H, Yang J, et al. A familial cluster of pneumonia associated with the 2019 novel coronavirus indicating person-to-person transmission: a study of a family cluster. Lancet (London England) 2020;395(10223):514–23. doi: 10.1016/S0140-6736(20)30154-9. - DOI - PMC - PubMed
MeSH terms
Substances
Grants and funding
LinkOut - more resources
Full Text Sources
Medical
Research Materials
Miscellaneous
