. 2024 Jul 4;24(1):324.
doi: 10.1186/s12890-024-03130-6.

Comprehensive analysis and identification of subtypes and hub genes of high immune response in lung adenocarcinoma

Affiliations

Comprehensive analysis and identification of subtypes and hub genes of high immune response in lung adenocarcinoma

Han Li et al. BMC Pulm Med. .

Abstract

Background: The advent of immunotherapy targeting immune checkpoints has conferred significant clinical advantages to patients with lung adenocarcinoma (LUAD); However, only a limited subset of patients exhibit responsiveness to this treatment. Consequently, there is an imperative need to stratify LUAD patients based on their response to immunotherapy and enhance the therapeutic efficacy of these treatments.

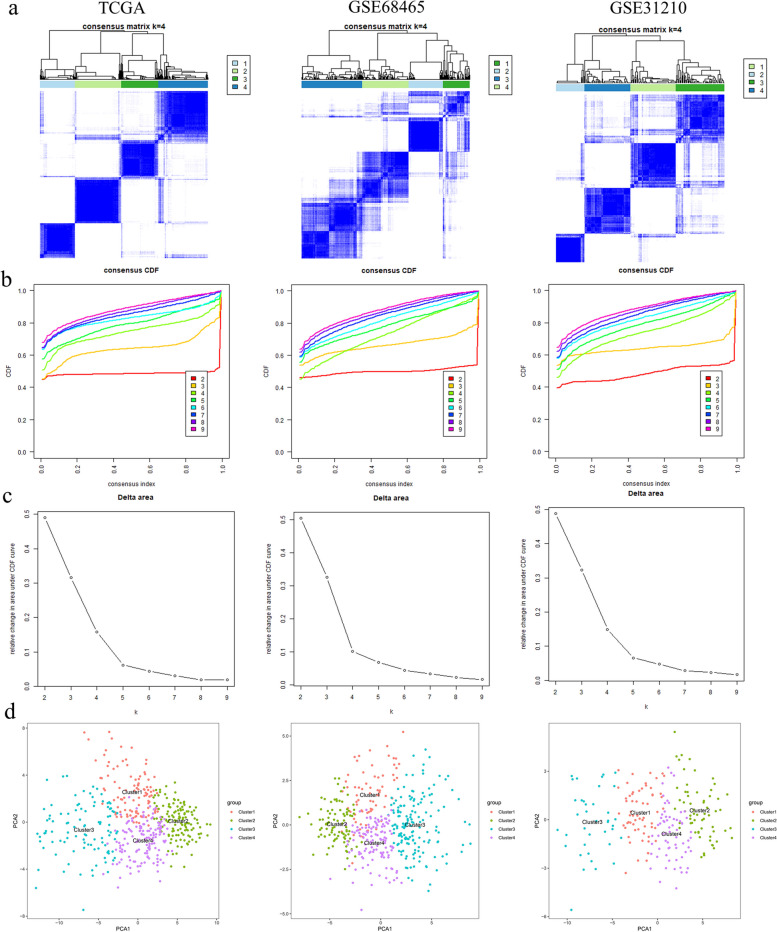
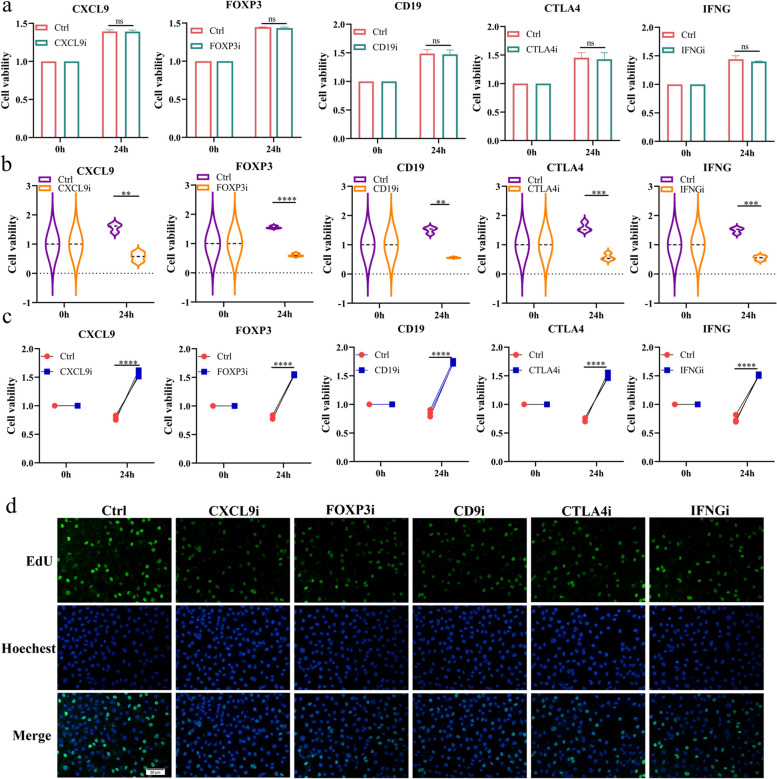
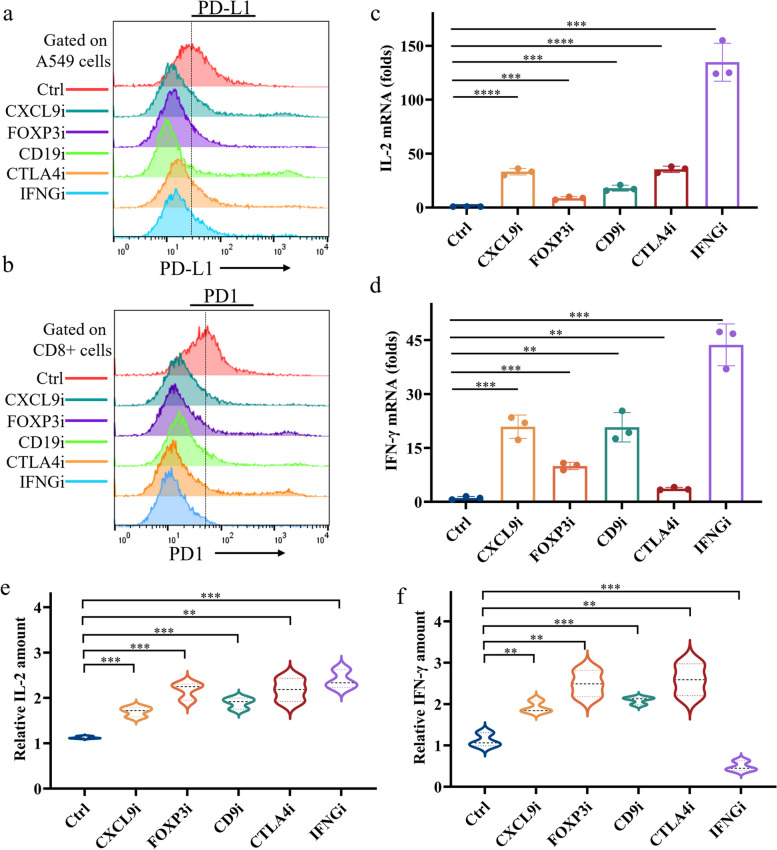
Methods: The differentially co-expressed genes associated with CD8 + T cells were identified through weighted gene co-expression network analysis (WGCNA) and the Search Tool for the Retrieval of Interacting Genes (STRING) database. These gene signatures facilitated consensus clustering for TCGA-LUAD and GEO cohorts, categorizing them into distinct immune subtypes (C1, C2, C3, and C4). The Tumor Immune Dysfunction and Exclusion (TIDE) model and Immunophenoscore (IPS) analysis were employed to assess the immunotherapy response of these subtypes. Additionally, the impact of inhibitors targeting five hub genes on the interaction between CD8 + T cells and LUAD cells was evaluated using CCK8 and EDU assays. To ascertain the effects of these inhibitors on immune checkpoint genes and the cytotoxicity mediated by CD8 + T cells, flow cytometry, qPCR, and ELISA methods were utilized.

Results: Among the identified immune subtypes, subtypes C1 and C3 were characterized by an abundance of immune components and enhanced immunogenicity. Notably, both C1 and C3 exhibited higher T cell dysfunction scores and elevated expression of immune checkpoint genes. Multi-cohort analysis of Lung Adenocarcinoma (LUAD) suggested that these subtypes might elicit superior responses to immunotherapy and chemotherapy. In vitro experiments involved co-culturing LUAD cells with CD8 + T cells and implementing the inhibition of five pivotal genes to assess their function. The inhibition of these genes mitigated the immunosuppression on CD8 + T cells, reduced the levels of PD1 and PD-L1, and promoted the secretion of IFN-γ and IL-2.

Conclusions: Collectively, this study delineated LUAD into four distinct subtypes and identified five hub genes correlated with CD8 + T cell activity. It lays the groundwork for refining personalized therapy and immunotherapy strategies for patients with LUAD.

Keywords: CD8 + T cells; Immune subtype; Immunotherapy response; Lung adenocarcinoma; PD-L1.


Conflict of interest statement

The authors declare no competing interests.

Figures

Fig. 1
Fig. 1
Screening of CD8 + T cell-related weighted co-expressed gene sets in TCGA-LUAD cohort. (a) Soft threshold power analysis was used to obtain the scale free fitting index of network topology. (b) The correlation between co-expression modules constructed by WGCNA and T cells. The royalblue module had the highest correlation with CD8 + T cells. (c) PPI network of royalblue module genes, the top5 hub genes were in the center. (d) The correlation between bub genes and B cell, CD4 + T cell, CD8 + T cell, Neutrophil, Macrophage and Myeloid dendritic cell in TCGA, GSE68465 and GSE31210 cohorts
Fig. 2
Fig. 2
Consensus clustering of three independent cohorts. (a) Consensus clustering matrix of three independent cohorts (TCGA, GSE68465 and GSE31210) when k = 4. (b) Cumulative distribution function (CDF) of consensus clustering of three independent cohorts (TCGA, GSE68465 and GSE31210) for k = 2–9. (c) Relative change of area under CDF curve of three cohorts (TCGA, GSE68465 and GSE31210) for k = 2–9. (d) Principal component analysis (PCA) of three cohorts (TCGA, GSE68465 and GSE31210) based on CD8+ T cell-related co-expressed genes
Fig. 3
Fig. 3
Immune landscape analysis and immunotherapy response analysis of LUAD immune subtypes (a) The four immune subtypes of the TCGA cohort showed an almost consistent immune cell infiltration landscape. (b) Heatmap of 29 immune gene sets for four immune subtypes in TCGA cohort. (c) Immune score of four immune subtypes in TCGA cohort. (d) Stromal score of four immune subtypes in TCGA cohort. (e) Tumor purity of four immune subtypes in TCGA cohort. (f) Heatmap of TIDE score, exclusion score and dysfunction score of four immune subtypes. (g) Percentages of true responder of immunotherapy in four immune subtypes (C1: 90%, C2: 31%, C3: 93%, C4: 49%). (h) Expression levels of PD-1, PD-L1, CTLA4 and LAG3 in four immune subtypes of TCGA cohort
Fig. 4
Fig. 4
Immunotherapy response and chemotherapy sensitivity analysis of LUAD immune subtypes (a-b) The IPS anti-PD-1 (a) and anti-CTLA4 (b) scores of immunotherapeutic true responders were significantly higher than false responders. (c) The combination therapy of anti-PD-1 and anti-CTLA4 had a higher response in immunotherapeutic true responders. (d) C1 and C3 had higher response to anti-PD-1 treatment. (e) Only C3 had a high response to anti-CTLA4 treatment. (f) C1 and C3 had high response to combination therapy of anti-PD-1 and anti-CTLA4. (g-h) C1 and C2 had a higher proportion of patients with high tumor stages III&IV (g) and T3&4 (h) than C3 and C4. (i-k) The comparison of IC50 of cisplatin, gefitinib and gemcitabine in high and low immunotherapy response groups in TCGA (i), GSE68465 (j) and GSE31210 (k) cohorts
Fig. 5
Fig. 5
Analysis of immune-related pathways and biological processes in high and low immune response groups and evaluation of anti-PD-L1 therapy. (a) Multiple immune-related pathways were activated in the high immunotherapy response group. (b) Various immune-related biological processes were more active in high immunotherapy response group. (c) Waterfall plot of mutated genes with mutation frequency greater than 20% of high immunotherapy response group. (d) Waterfall plot of mutated genes with mutation frequency greater than 20% of low immunotherapy response group. (e) The high immunotherapy response group had higher TMB. (f) Heatmap of DEGs of high and low immunotherapy response groups. (g) Function annotation of DEGs. (h) PCA analysis of DEGs. PC1 was extracted to serve as ITRscore. (i) Kaplan-Meier plot of IMvigor210 cohort. The IMvigor210 cohort was divided into high and low ITRscore group according to the best cut-off value of ITRscore.
Fig. 6
Fig. 6
Inhibition of these five hub genes on the function of LUAD cells and CD8+T cells. (a) A549 cells were exposed to CXCL9i (Seselin), FOXP3i (Epirubicin), CD9i (loncastuximab), CTLA4i (Zalifrelimab), or IFNGi (IFN-γ Antagonist 1) for 24 h, and then CCK8 assay was used to detect the changes in cell activity of A549. (b) A549 cells were co-cultured with CD8+ T cells and exposed to inhibitors of these five hub genes for 24 h, respectively. After that, the cell viability of A549 cells was examined by CCK8 assay. (c) Cells were treated as in (b). After treatment, the cell viability of CD8+ T cells was examined by CCK8 assay. (d) A549 cells were co-cultured with CD8+ T cells and exposed to inhibitors of these five hub genes for 24 h, respectively. After that, the proliferation ability of A549 cells was examined by EdU assay
Fig. 7
Fig. 7
Inhibition of these five hub genes can remove tumor immunosuppression of CD8+T cells. (a-b) A549 cells were co-cultured with CD8+ T cells and exposed to inhibitors of these five hub genes for 24 h, respectively. After treatment, PD-L1 expression levels on A549 cells (a) or PD1 expression levels on CD8+ T cells (b) were measured by flow cytometry. (c-d) Cells were treated as in (b). After treatment, mRNA levels of IL-2 (c) and IFN-γ (d) in CD8+ T cells were detected by qPCR assay. (e-f) Cells were treated as in (b). After treatment, the levels of cytokines IL-2 (e) and IFN-γ (f) secreted by CD8+ T cells were detected by Elisa assay

Similar articles

References

    1. Chaft JE, Shyr Y, Sepesi B, Forde PM. Preoperative and postoperative systemic therapy for operable non-small-cell Lung Cancer. J Clin Oncol. 2022;40(6):546–55. doi: 10.1200/JCO.21.01589. - DOI - PMC - PubMed
    1. Wu JT, Wakelee HA, Han SS. Optimizing Lung Cancer Screening with Risk Prediction: current challenges and the emerging role of biomarkers. J Clin Oncol. 2023;41(27):4341–7. doi: 10.1200/JCO.23.01060. - DOI - PMC - PubMed
    1. Wu L, Chen X, Zeng Q, Lai Z, Fan Z, Ruan X, Li X, Yan J. NR5A2 gene affects the overall survival of LUAD patients by regulating the activity of CSCs through SNP pathway by OCLR algorithm and immune score. Heliyon. 2024;10(7):e28282. doi: 10.1016/j.heliyon.2024.e28282. - DOI - PMC - PubMed
    1. Leiter A, Veluswamy RR, Wisnivesky JP. The global burden of lung cancer: current status and future trends. Nat Rev Clin Oncol. 2023;20(9):624–39. doi: 10.1038/s41571-023-00798-3. - DOI - PubMed
    1. Butterfield LH, Najjar YG. Immunotherapy combination approaches: mechanisms, biomarkers and clinical observations. Nat Rev Immunol. 2023;24(6):399–416. doi: 10.1038/s41577-023-00973-8. - DOI - PMC - PubMed

MeSH terms