. 2024 Jul 4;43(1):185.
doi: 10.1186/s13046-024-03095-8.

A novel lncRNA LOC101928222 promotes colorectal cancer angiogenesis by stabilizing HMGCS2 mRNA and increasing cholesterol synthesis

Affiliations

A novel lncRNA LOC101928222 promotes colorectal cancer angiogenesis by stabilizing HMGCS2 mRNA and increasing cholesterol synthesis

Lisha Chang et al. J Exp Clin Cancer Res. .

Abstract

Background: Metastasis is the leading cause of mortality in patients with colorectal cancer (CRC) and angiogenesis is a crucial factor in tumor invasion and metastasis. Long noncoding RNAs (lncRNAs) play regulatory functions in various biological processes in tumor cells, however, the roles of lncRNAs in CRC-associated angiogenesis remain to be elucidated in CRC, as do the underlying mechanisms.

Methods: We used bioinformatics to screen differentially expressed lncRNAs from TCGA database. LOC101928222 expression was assessed by qRT-PCR. The impact of LOC101928222 in CRC tumor development was assessed both in vitro and in vivo. The regulatory mechanisms of LOC101928222 in CRC were investigated by cellular fractionation, RNA-sequencing, mass spectrometric, RNA pull-down, RNA immunoprecipitation, RNA stability, and gene-specific m6A assays.

Results: LOC101928222 expression was upregulated in CRC and was correlated with a worse outcome. Moreover, LOC101928222 was shown to promote migration, invasion, and angiogenesis in CRC. Mechanistically, LOC101928222 synergized with IGF2BP1 to stabilize HMGCS2 mRNA through an m6A-dependent pathway, leading to increased cholesterol synthesis and, ultimately, the promotion of CRC development.

Conclusions: In summary, these findings demonstrate a novel, LOC101928222-based mechanism involved in the regulation of cholesterol synthesis and the metastatic potential of CRC. The LOC101928222-HMGCS2-cholesterol synthesis pathway may be an effective target for diagnosing and managing CRC metastasis.

Keywords: Angiogenesis; Cholesterol synthesis; Colorectal cancer; LOC101928222; m6A.


Conflict of interest statement

The authors declare that they have no competing interests.

Figures

Fig. 1
Fig. 1
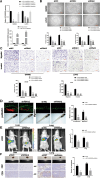
LOC101928222 is upregulated in CRC and associated with poor prognosis. A Differentially expressed genes were analyzed based on the GEO database (GSE126092, GSE4988, GSE92914). B Venn diagram showing overlap between differentially expressed lncRNAs. C The UCSC database shows the protein coding capacity of LOC101928222. D The overall expression of LOC101928222 in multiple human cancers at TCGA. E TCGA database showing expression levels of LOC101928222 in CRC tissues (n=132) and normal colorectal tissues (n=52). F The expression of LOC101928222 in 51 pairs of CRC tissues was detected and classified into relatively high-expression and low-expression group. G ISH analyses of LOC101928222 expression in colorectal cancer and adjacent normal tissues. Scale bar: 100 μm. H Expression levels of LOC101928222 in CRC cell lines and normal human colon epithelial cell was detected by qRT-PCR. I Relative Expression of LOC101928222 in Patients with higher Pathologic Staging (III/IV) and lower Pathologic Staging (I/II). J Kaplan-Meier analysis of survival curves in CRC patients with low LOC101928222 expression and high LOC101928222 expression. *p < 0.05, **p < 0.01, ***p < 0.001, ****p < 0.0001
Fig. 2
Fig. 2
LOC101928222 promotes progression of CRC in vitro and vivo. A The knockdown and overexpression efficiency of LOC101928222 in SW480, LOVO cells were detected by qRT-PCR. B Tube formation assays were performed to detect the angiogenesis of HUVECs cells (number of branches, meshes), which co-cultured with supernatant of CRC cells transfected with LOC101928222 shRNAs. Scale bar: 100 μm. C Transwell assays were performed to determine the effects of LOC101928222 on migration and invasion in SW480 and LOVO cells transfected with LOC101928222 shRNAs. Scale bar: 50 μm. D Confocal imaging showing cells in CM-DiI-positive areas in the yolk (proliferation) and trunk(migration). E Images and analysis of luminescence intensity in metastasis models. F Images and IHC staining of metastatic tumors in the livers and lungs of mice. The number of metastases in livers or lungs was analyzed. Scale bar: 50 μm.*p < 0.05, **p < 0.01, ***p < 0.001, ****p < 0.0001
Fig. 3
Fig. 3
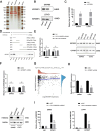
LOC101928222 promotes CRC progression by regulating HMGCS2 expression. A Subcellular localization of LOC101928222 in SW480 and LOVO cells. The nuclear control was U6, and the cytoplasm control was GAPDH, β-actin. B FISH analysis of the location of LOC101928222 in the cytoplasm and nuclear fractions of SW480 and LOVO cells. C Heatmap of differentially expressed mRNA identified by RNA-seq after LOC101928222 knockdown in LOVO cells. D Metascape website for enrichment analysis of differential genes. E qRT-PCR were performed to validate genes with high differential expression folds in the RNA-seq results. F Western blotting was used to detect changes in HMGCS2 protein levels after knockdown and overexpression of LOC101928222. G Tube formation rescue assays for effects of HMGCS2 overexpression on angiogenesis of SW480 and LOVO cells with LOC101928222 shRNA. Scale bar: 100 μm. H Transwell rescue assays for effects of HMGCS2 overexpression on migration and invasion of SW480 and LOVO cells with LOC101928222 shRNA. Scale bar: 50 μm.*p < 0.05, **p < 0.01, ***p < 0.001, ****p < 0.0001
Fig. 4
Fig. 4
LOC101928222 interacts with IGF2BP1 to regulate HMGCS2 expression. A RNA pull-down was performed in LOVO cells lysates using antisense and sense LOC101928222, followed by silver staining. Bands showing clear changes in IGF2BP1 are shown. B Western blotting was used to detect the specific interaction between IGF2BP1 and LOC101928222. C RIP was performed to examine the enrichment between LOC101928222 and IGF2BP1 in SW480 and LOVO cells. D Western blotting was used to examine IGF2BP1 in the pull-down precipitates with segmented LOC101928222. E qRT-PCR and western blotting assays were performed to detect the effects of knockdown or overexpression of LOC101928222 on IGF2BP1 expression. F qRT-PCR were performed to detect the effect of knockdown of IGF2BP1 on LOC101928222. G Correlation between IGF2BP1 and HMGCS2 based on TCGA database. H qRT-PCR and western blotting assays were performed to detect the effects of knockdown of IGF2BP1 on HMGCS2 expression. I RIP assays were performed to detect the effect of knockdown of LOC101928222 on the enrichment of IGF2BP1 with HMGCS2. *p < 0.05, **p < 0.01, ***p < 0.001, ****p < 0.0001
Fig. 5
Fig. 5
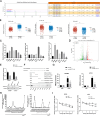
LOC101928222/IGF2BP1 complex promotes CRC progression by stabilizing HMGCS2 mRNA. A Changes in the stability of HMGCS2 mRNA after knockdown of LOC10192822, IGF2BP1, or both LOC10192822 and IGF2BP1 were examined in SW480 and LOVO cells. B HMGCS2 mRNA stability was assayed in negative control, LOC101928222-overexpressing with or without IGF2BP2-kockdown in SW480 and LOVO cells. C Different tumor cellular localization of HMGCS2 and IGF2BP1 based on The Human Protein Atlas. IF were performed to determine CRC cellular localization of HMGCS2 and IGF2BP1. D Tube formation rescue assays for effects of IGF2BP1 shRNA on angiogenesis of SW480 and LOVO cells with LOC101928222 overexpression. Scale bar: 100 μm. E Transwell rescue assays for effects of IGF2BP1 shRNA on migration and invasion of SW480 and LOVO cells with LOC101928222 overexpression. Scale bar: 50 μm.*p < 0.05, **p < 0.01, ***p < 0.001, ****p < 0.0001
Fig. 6
Fig. 6
LOC101928222 synergizes with IGF2BP1 to stabilize HMGCS2 mRNA via a METTL16-mediated m6A-dependent pathway. A The SRAMP website predicts potential m6A modification sites in HMGCS2. B TCGA database showing expression levels of METTL3, METTL14 and METTL16 in CRC tissue (n=620) and normal colorectal tissue (n=789). (C) Expression levels of METTL3, METTL14 and METTL16 in CRC cell lines and normal human colon epithelial cell was detected by qRT-PCR. D Volcano plot of differentially expressed RNAs identified by RNA-seq after METTL16 knockdown in LOVO cells. E qRT-PCR and western blotting assays were performed to detect the effects of knockdown of METTL16 on HMGCS2 expression. F Western blotting was used to examine METTL16 in the pull-down precipitates with segmented LOC101928222. G MeRIP-qPCR was performed on SW480 and LOVO cells to detect changes in m6A levels in HMGCS2 after knockdown of METTL16. H MeRIP-qPCR was conducted to determine specific locations of HMGCS2 mRNA enrichment for METTL16 and m6A. I Changes in the stability of HMGCS2 mRNA after knockdown of METTL16 were examined in SW480 and LOVO cells. *p < 0.05, **p < 0.01, ***p < 0.001, ****p < 0.0001
Fig. 7
Fig. 7
LOC101928222 mediates cholesterol increase in CRC leading to its progression. A Pathway correlation analysis of HMGCS2 based on TCGA database. B Simplified overview of cholesterol biosynthesis metabolism. C Cholesterol assays were performed to detect the effect of shNC,shHMGCS2,shLOC101928222,shlGF2BP1,shLOC101928222+shIGF2BP1,shLOC101928222+OE-HMGCS2,shLOC101928222+OE-IGF2BP1,shHMGCS2+OE-IGF2BP1 on cholesterol. D Tube formation rescue assay for the effect of 0, 5, 10 or 15 µM cholesterol (labeled Cho) on angiogenesis in SW480 and LOVO cells with knockdown of LOC101928222. Scale bar: 100 μm. E Transwell rescue assays for the effect of 0 or 10 µM cholesterol (labeled Cho) on migration and invasion in SW480 and LOVO cells with knockdown of LOC101928222. Scale bar: 50 μm. F-G. LOVO cells of the corresponding group (1× 10⁶/mouse) were injected into mice, and pictures of tumors (F), tumor growth curve and tumor weight (G) of each mouse group were measured. H Cholesterol concentrations in mice tumors of each experimental group were measured. *p < 0.05, **p < 0.01, ***p < 0.001, ****p < 0.0001
Fig. 8
Fig. 8
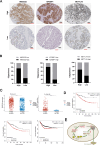
Clinical relationships of related molecules. A Representative images showing high or low expression of HMGCS2, IGF2BP1 and METTL16 in CRC patients’ tumor tissues. Scar bar: 50 μm. B Percentages of specimens showing different levels of HMGCS2, IGF2BP1 and METTL16 in 51 pairs of CRC tissues. (C)TCGA database showing expression levels of HMGCS2 and IGF2BP1 in CRC tissue (n=620) and normal colorectal tissue (n=789). D Kaplan-Meier analysis of survival curves in CRC patients based on HMGCS2, IGF2BP1 and METTL16 expression levels. E Schematic model depicting that LOC101928222 synergizes with IGF2BP1 to stabilize HMGCS2 mRNA through an m6A-dependent pathway, leading to increased cholesterol synthesis and ultimately promoting the development of CRC. * p < 0.05, **p < 0.01, ***p < 0.001, ****p < 0.0001

Similar articles

Cited by

References

    1. Siegel RL, Miller KD, Wagle NS, et al. Cancer statistics, 2023. CA Cancer J Clin. 2023;73(1):17–48. doi: 10.3322/caac.21763. - DOI - PubMed
    1. Siegel RL, Wagle NS, Cercek A, et al. Colorectal cancer statistics, 2023. CA Cancer J Clin. 2023;73(3):233–254. doi: 10.3322/caac.21772. - DOI - PubMed
    1. Lugano R, Ramachandran M, Dimberg A. Tumor angiogenesis: causes, consequences, challenges and opportunities. Cell Mol Life Sci. 2020;77(9):1745–1770. doi: 10.1007/s00018-019-03351-7. - DOI - PMC - PubMed
    1. Hoang T, Sohn DK, Kim BC, et al. Efficacy and Safety of Systemic Treatments Among Colorectal Cancer Patients: A Network Meta-Analysis of Randomized Controlled Trials. Front Oncol. 2021;11:756214. doi: 10.3389/fonc.2021.756214. - DOI - PMC - PubMed
    1. Schmitt AM, Chang HY. Long Noncoding RNAs in Cancer Pathways. Cancer Cell. 2016;29(4):452–463. doi: 10.1016/j.ccell.2016.03.010. - DOI - PMC - PubMed

MeSH terms