. 2024 Jul 4;22(1):623.
doi: 10.1186/s12967-024-05249-w.

Increased secretion of adipocyte-derived extracellular vesicles is associated with adipose tissue inflammation and the mobilization of excess lipid in human obesity

Affiliations

Increased secretion of adipocyte-derived extracellular vesicles is associated with adipose tissue inflammation and the mobilization of excess lipid in human obesity

Johanna Matilainen et al. J Transl Med. .

Abstract

Background: Obesity is a worldwide epidemic characterized by adipose tissue (AT) inflammation. AT is also a source of extracellular vesicles (EVs) that have recently been implicated in disorders related to metabolic syndrome. However, our understanding of mechanistic aspect of obesity's impact on EV secretion from human AT remains limited.

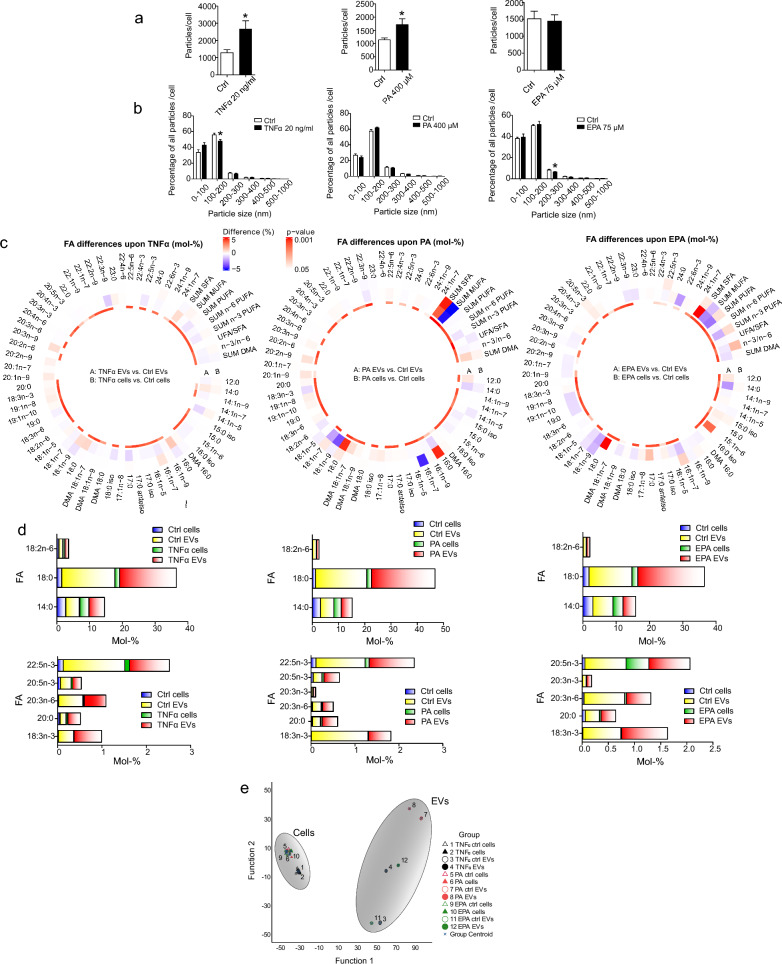
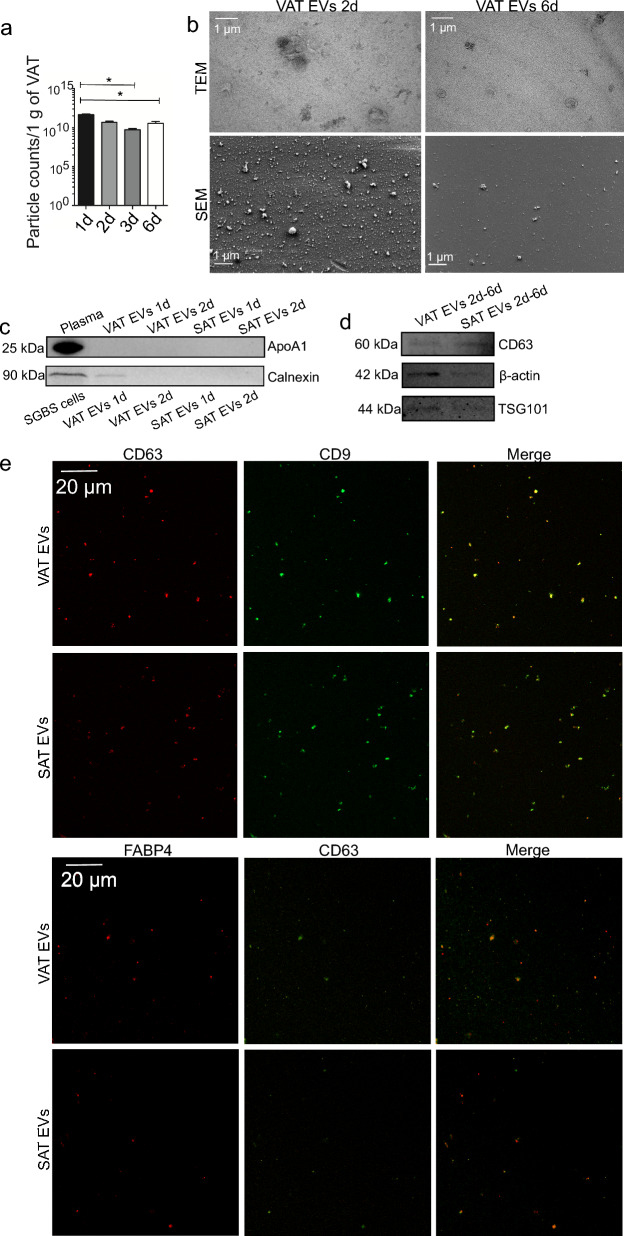
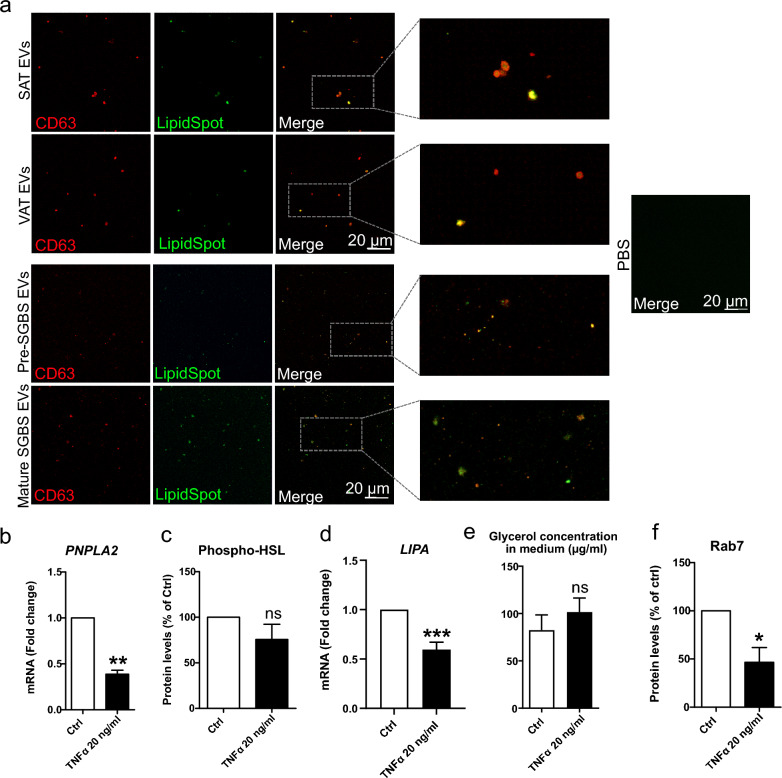
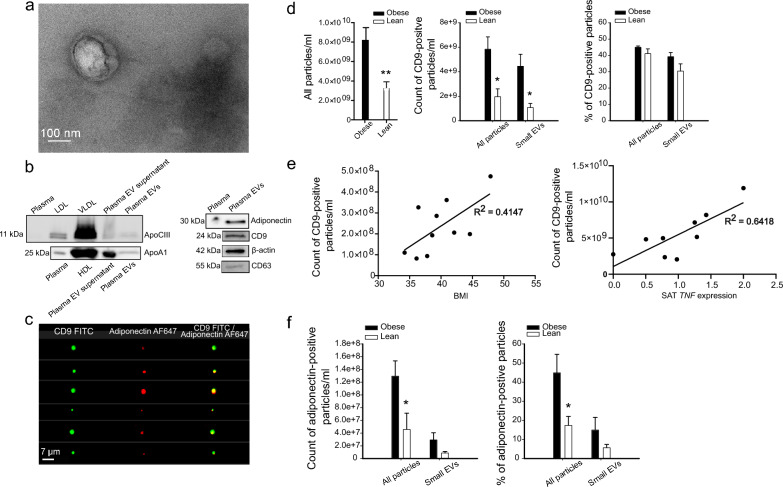
Methods: We investigated EVs from human Simpson Golabi Behmel Syndrome (SGBS) adipocytes, and from AT as well as plasma of subjects undergoing bariatric surgery. SGBS cells were treated with TNFα, palmitic acid, and eicosapentaenoic acid. Various analyses, including nanoparticle tracking analysis, electron microscopy, high-resolution confocal microscopy, and gas chromatography-mass spectrometry, were utilized to study EVs. Plasma EVs were analyzed with imaging flow cytometry.

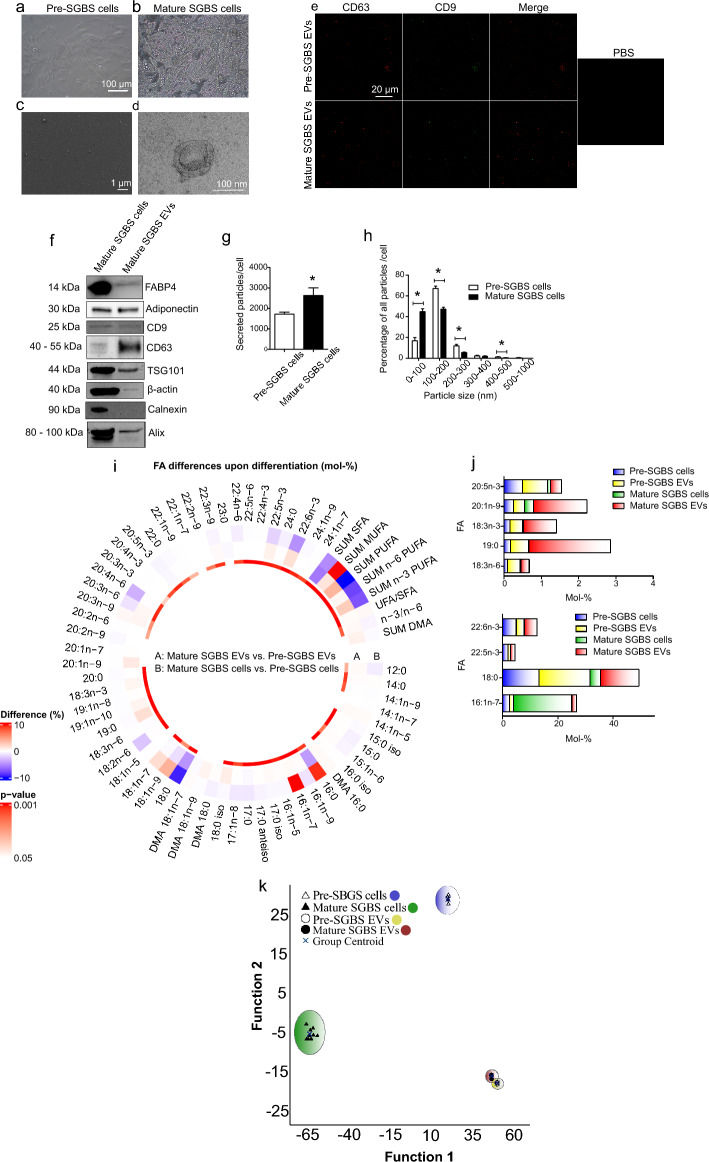
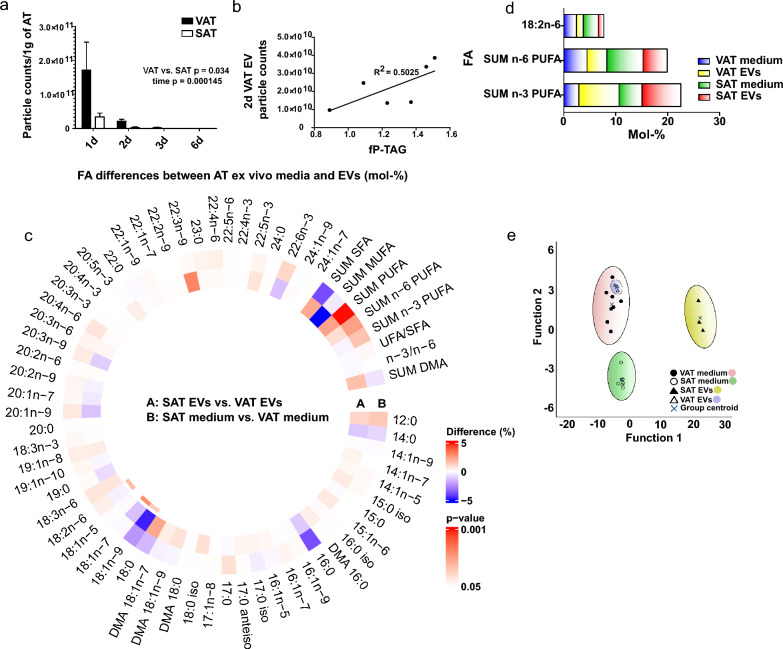
Results: EVs from mature SGBS cells differed significantly in size and quantity compared to preadipocytes, disagreeing with previous findings in mouse adipocytes and indicating that adipogenesis promotes EV secretion in human adipocytes. Inflammatory stimuli also induced EV secretion, and altered EV fatty acid (FA) profiles more than those of cells, suggesting the role of EVs as rapid responders to metabolic shifts. Visceral AT (VAT) exhibited higher EV secretion compared to subcutaneous AT (SAT), with VAT EV counts positively correlating with plasma triacylglycerol (TAG) levels. Notably, the plasma EVs of subjects with obesity contained a higher number of adiponectin-positive EVs than those of lean subjects, further demonstrating higher AT EV secretion in obesity. Moreover, plasma EV counts of people with obesity positively correlated with body mass index and TNF expression in SAT, connecting increased EV secretion with AT expansion and inflammation. Finally, EVs from SGBS adipocytes and AT contained TAGs, and EV secretion increased despite signs of less active lipolytic pathways, indicating that AT EVs could be involved in the mobilization of excess lipids into circulation.

Conclusions: We are the first to provide detailed FA profiles of human AT EVs. We report that AT EV secretion increases in human obesity, implicating their role in TAG transport and association with adverse metabolic parameters, thereby emphasizing their role in metabolic disorders. These findings promote our understanding of the roles that EVs play in human AT biology and metabolic disorders.

Keywords: Adipocyte; Adipose tissue; Extracellular vesicles; Fatty acids; Inflammation; Obesity.


Conflict of interest statement

The authors have no relevant financial or non-financial interests to disclose.

Figures

Fig. 1
Fig. 1
Characterization of extracellular vesicles (EVs) from Simpson Golabi Behmel Syndrome (SGBS) cells. The differentiation of pre-SGBS cells (a) into mature, lipid-laden SGBS cells was induced (b), after which EVs were isolated from culture medium by differential steps of ultracentrifugation. Scanning electron microscopy of EVs from mature SGBS cells (c) reveals good sample purity, and transmission electron micrograph a high-magnification image of a typical EV (d). The presence of EV-markers in EV samples was confirmed by fluorescent labelling of CD63 and CD9 in confocal microscopy (e). The presence of adipocyte-derived material (fatty acid binding protein 4 (FABP4) and adiponectin), tumor susceptibility 101 (TSG101), CD63, CD9, programmed cell death 6 interacting protein (Alix) and β-actin, as well as the absence of calnexin were further analyzed by Western Blotting from mature SGBS cell EV samples (f). Nanoparticle tracking analysis (NTA) of EV samples from pre- and mature SGBS cells revealed concentration (g) and size distribution (h) of secreted particles. NTA results are presented as mean + SEM, from 4 independent experiments. *p = 0.021 (Mann–Whitney U test). Differences in FA profiles of pre- and mature cells and their EVs were determined from total lipids with gas chromatography–mass spectrometry (i). Results are presented as percentage differences, calculated by subtracting the mol-% of each FA in the pre-group from the mol-% in the mature group. Red indicates an increase in the mature group, while blue indicates a decrease. DMA plasmalogen alkenyl chain-derived dimethyl acetal derivative, SFA saturated fatty acid, MUFA monounsaturated fatty acid, PUFA polyunsaturated fatty acid, unsaturated FA (UFA) = MUFA + PUFA. *p ≤ 0.05 Mann–Whitney U test vs. control. Percentages of selected FAs in pre- and mature cells and secreted EVs, presented as mean mol-% (j). The supervised discriminant analysis of FA proportions in pre- and mature SGBS cells, as well as their EVs (k)
Fig. 2
Fig. 2
Studying extracellular vesicle (EV) secretion and EV fatty acid (FA) profiles from adipocyte treatments. Mature Simpson Golabi Behmel Syndrome cells were treated with either 20 ng/ml of tumor necrosis factor α (TNFα), 400 µM of palmitic acid (PA, 16:0) or 75 µM eicosapentaenoic acid (EPA, 20:5n-3) for 24 h, after which EVs were isolated and analyzed by nanoparticle tracking analysis (NTA). Both particle counts (a) and size distribution of particles (b) were obtained by nanoparticle tracking analysis NTA. Particle counts have been normalized to cell number, and results are presented as mean + SEM. *p < 0.05 (Mann–Whitney U test). Differences in FA profiles of cells and secreted EVs from TNFα, PA, and EPA treatments were determined from total lipids with gas chromatography–mass spectrometry (c). Results are presented as percentage differences, calculated by subtracting the mol-% of each FA in the control group from the mol-% in the treatment group. Red indicates an increase in the treatment group, while blue indicates a decrease. FAs are listed in the order of increasing chromatographic retention time. DMA plasmalogen alkenyl chain-derived dimethyl acetal derivative, SFA saturated fatty acid, MUFA monounsaturated fatty acid, PUFA polyunsaturated fatty acid, unsaturated FA (UFA) = MUFA + PUFA. *p ≤ 0.05 Mann–Whitney U test vs. control. Percentages of selected FAs in cells and secreted EVs from TNFα, PA, and EPA treatments, presented as mean mol-% (d). The FA results of TNFα and PA treatments were measured from 5 independent experiments and the results of EPA treatments from 7 independent experiments. The supervised discriminant analysis depicts the classification of FA signatures of cells and EVs from TNFα, PA, and EPA experiments based on discriminant functions 1 and 2 (e). Function 1 (on the x-axis) explained 81.7% of the variance in the dataset, and Function 2 10.6% of the variance
Fig. 3
Fig. 3
Characterization of patient visceral (VAT) and subcutaneous adipose tissue (SAT) extracellular vesicles (EVs). AT samples from bariatric surgeries were cultured ex vivo in EV-free culture medium for several days, after which EVs were isolated by differential steps of ultracentrifugation. To evaluate how EV secretion changes over time in AT cultures, culture supernatant was collected from VAT cultures and replenished daily until cultures had been maintained for 3 days in total (samples 1d, 2d, 3d). Replenished culture medium was then incubated for 3 more days, and then collected (6d). Results include VAT ex vivo cultures of 6 patients, presented as mean + SEM (a). *p = 0.006 (Kruskal–Wallis ANOVA). All EV counts have been normalized to 1 g of VAT obtained for culturing. Sample purity and the morphology of VAT EV isolates obtained after 2 and 6 days of culture initiation were analyzed by scanning (SEM) and transmission electron microscopy (TEM) (b). Scale bars 1 µm. The possible presence of blood- and cell-derived material was studied by apolipoprotein A1 (ApoA1) and calnexin Western Blotting, respectively, from 1 and 2d AT EV samples (c). Final VAT and SAT EV samples (pooled 2d, 3d, and 6d samples) were further analyzed by CD63, β-actin, and tumor susceptibility 101 (TSG101) Western Blotting (d). The presence of common EV markers (CD63 and CD9) and AT-specific EV marker fatty acid binding protein 4 (FABP4) was further confirmed by fluorescent labelling and confocal microscopy (e)
Fig. 4
Fig. 4
Comparison of the extracellular vesicles (EV) from visceral (VAT) and subcutaneous adipose tissue (SAT). Particle counts were obtained by nanoparticle tracking analysis (a). Generalized linear model VAT vs. SAT group p = 0.034, time p = 0.00145. Results include AT cultures of 6 patients, presented as mean + SEM. All EV counts have been normalized to 1 g of AT obtained for culturing. Correlation between 2d VAT EV particle counts with patient fasting plasma triacylglycerol levels (fP-TAG) (b). Spearman’s rank correlation efficient 0.829, p = 0.042. Fatty acid (FA) profiles of VAT and SAT EVs, as well as ex vivo culture media, were determined from total lipids with gas chromatography–mass spectrometry (c). Results are presented as percentage differences, calculated by subtracting the mol-% of each FA in the VAT group from the mol-% in the SAT group. Red indicates an increase in the SAT group, while blue indicates a decrease. FAs are listed in the order of increasing chromatographic retention time. DMA plasmalogen alkenyl chain-derived dimethyl acetal derivative, SFA saturated fatty acid, MUFA monounsaturated fatty acid, PUFA polyunsaturated fatty acid, unsaturated fatty acid (UFA) = MUFA + PUFA. *p ≤ 0.05 Mann–Whitney U test vs. VAT. Percentages of selected FAs in AT EVs and ex vivo culture media, presented as mean mol-% (d). Results of FA profiles were analyzed from 3 EV samples, which each corresponded to a pooled EV sample from 2 different patients. Media samples were obtained from 2 patients’ AT ex vivo cultures. The supervised discriminant analysis depicts the classification of FA signatures of VAT and SAT EVs as well as corresponding ex vivo media based on discriminant Functions 1 and 2 (e). Function 1 on the horizontal axis explained 89.3% of the variance, and Function 2 8.0% of the variance
Fig. 5
Fig. 5
Studying the presence of lipids in adipose tissue (AT)-extracellular vesicles (EVs) by confocal microscopy (a). Confocal microscopy analysis was performed for Simpson Golabi Behmel Syndrome (SGBS) adipocyte and patient AT-derived EVs that were stained for lipids and CD63. EV samples from pre- and mature SGBS cells, as well as from patient visceral and subcutaneous adipose tissue (VAT and SAT, respectively) ex vivo cultures were stained with LipidSpot lipid droplet stain and fluorophore-conjugated CD63-antibody, after which samples were imaged with high-resolution confocal microscopy. PBS was included as non-EV control. The mRNA expression levels of PNPLA2 in SGBS cells treated with 20 ng/ml TNFα for 24 h were analyzed by RT-qPCR (b). The values of six independent experiments are shown, presented as mean + SEM. **p = 0.002 (Mann–Whitney U test). Phosphorylated levels of hormone sensitive lipase (HSL) were studied by Western Blotting, from three independent experiments (c). Results are presented as mean + SEM. The mRNA expression levels of LIPA were studied by RT-qPCR, from nine independent experiments (d). Results are presented as mean + SEM, ***p = 0.0001 (Mann–Whitney U test). Glycerol concentration was determined from culture media of three experiments (e), and Rab7 protein levels from cells of four experiments (f). Results are presented as mean + SEM. *p = 0.014 (Mann–Whitney U test)
Fig. 6
Fig. 6
Amnis® ImageStream®X Mark II imaging flow cytometry analysis of plasma extracellular vesicles (EVs). Obese: Subjects with obesity, lean: Subjects with normal weight. Sample purity and the morphology of plasma EVs were first analyzed by transmission electron microscopy (a). Scale bar 100 nm. The presence of lipoprotein markers, apolipoprotein A1 (ApoA1) and apolipoprotein C-III (ApoCIII), as well as adiponectin, CD63, CD9, and β-actin EV markers, was analyzed by Western Blotting (b). Plasma EV samples were incubated with the mixture of CD9 and adiponectin antibodies, to test the double-positivity of adiponectin for CD9. Images of double-positive events are shown (c). All particles (objects/ml) and CD9-positive particles were measured, together with the percentage of CD9-positive particles (d) **p = 0.007 and *p = 0.022 (Mann–Whitney U test). Correlation between the number of CD9-positive EV particles with body mass index (BMI) and subcutaneous adipose tissue (SAT) TNF expression (e). CD9 particles and BMI: Spearman’s rank correlation coefficient 0.636, p = 0.048, CD9 particles and SAT TNF expression: Spearman’s rank correlation coefficient 0.733, p = 0.025. Adiponectin-positive particles were counted, and the percentage of adiponectin-positive particles from all particles was measured (f). EV samples from 6 normal-weight subjects and from 10 subjects with obesity were analyzed in total. TNF expression values were obtained from 9 subjects with obesity

Similar articles

Cited by

References

    1. World Health Organization (WHO). Obesity and overweight, Key facts. 2021. https://www.who.int/news-room/fact-sheets/detail/obesity-and-overweight.
    1. Ogden CL, Carroll MD, Fryar CD, et al. Prevalence of obesity among adults and youth: United States, 2011–2014. NCHS Data Brief. 2015;219:1–8. - PubMed
    1. Ouchi N, Parker JL, Lugus JJ, et al. Adipokines in inflammation and metabolic disease. Nat Rev Immunol. 2011;11:85–97. doi: 10.1038/nri2921. - DOI - PMC - PubMed
    1. Lazar I, Clement E, Dauvillier S, et al. Adipocyte exosomes promote melanoma aggressiveness through fatty acid oxidation: a novel mechanism linking obesity and cancer. Cancer Res. 2016;76:4051–4057. doi: 10.1158/0008-5472.CAN-16-0651. - DOI - PubMed
    1. Yáñez-Mó M, Siljander PR-M, Andreu Z, et al. Biological properties of extracellular vesicles and their physiological functions. J Extracell Vesicles. 2015;4:27066. doi: 10.3402/jev.v4.27066. - DOI - PMC - PubMed

Grants and funding