. 2024 Sep 17;123(18):3065-3079.
doi: 10.1016/j.bpj.2024.07.004. Epub 2024 Jul 4.

A colloidal model for the equilibrium assembly and liquid-liquid phase separation of the reflectin A1 protein

Affiliations

A colloidal model for the equilibrium assembly and liquid-liquid phase separation of the reflectin A1 protein

Tse-Chiang Huang et al. Biophys J. .

Abstract

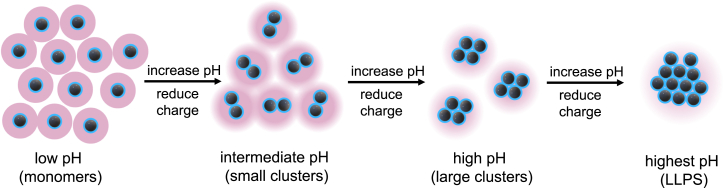
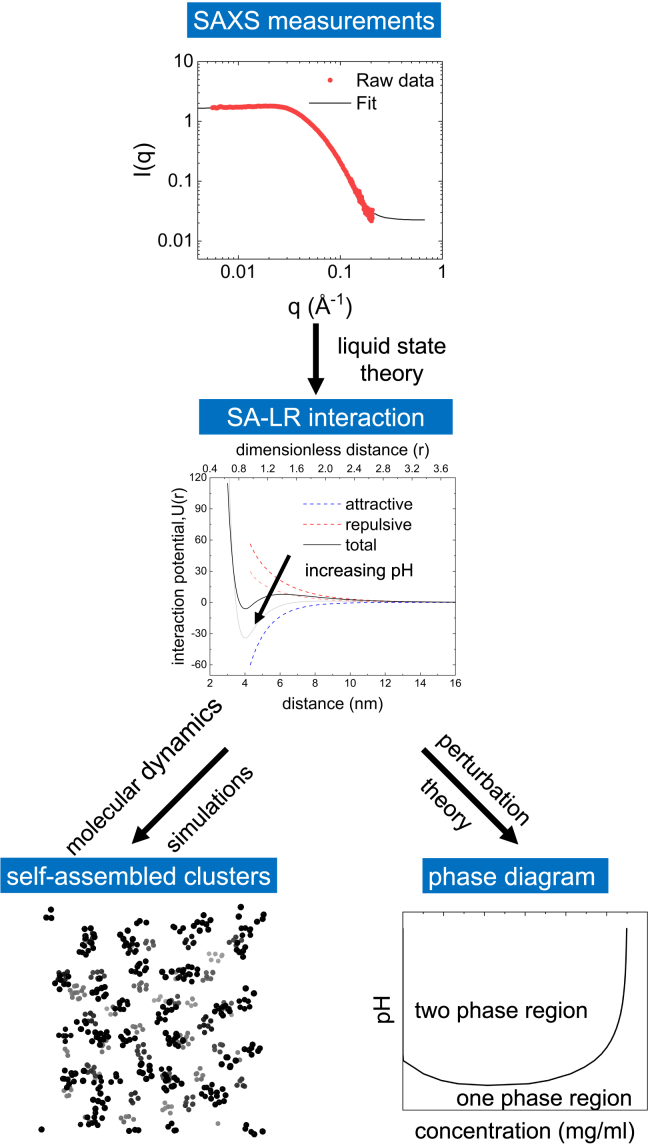
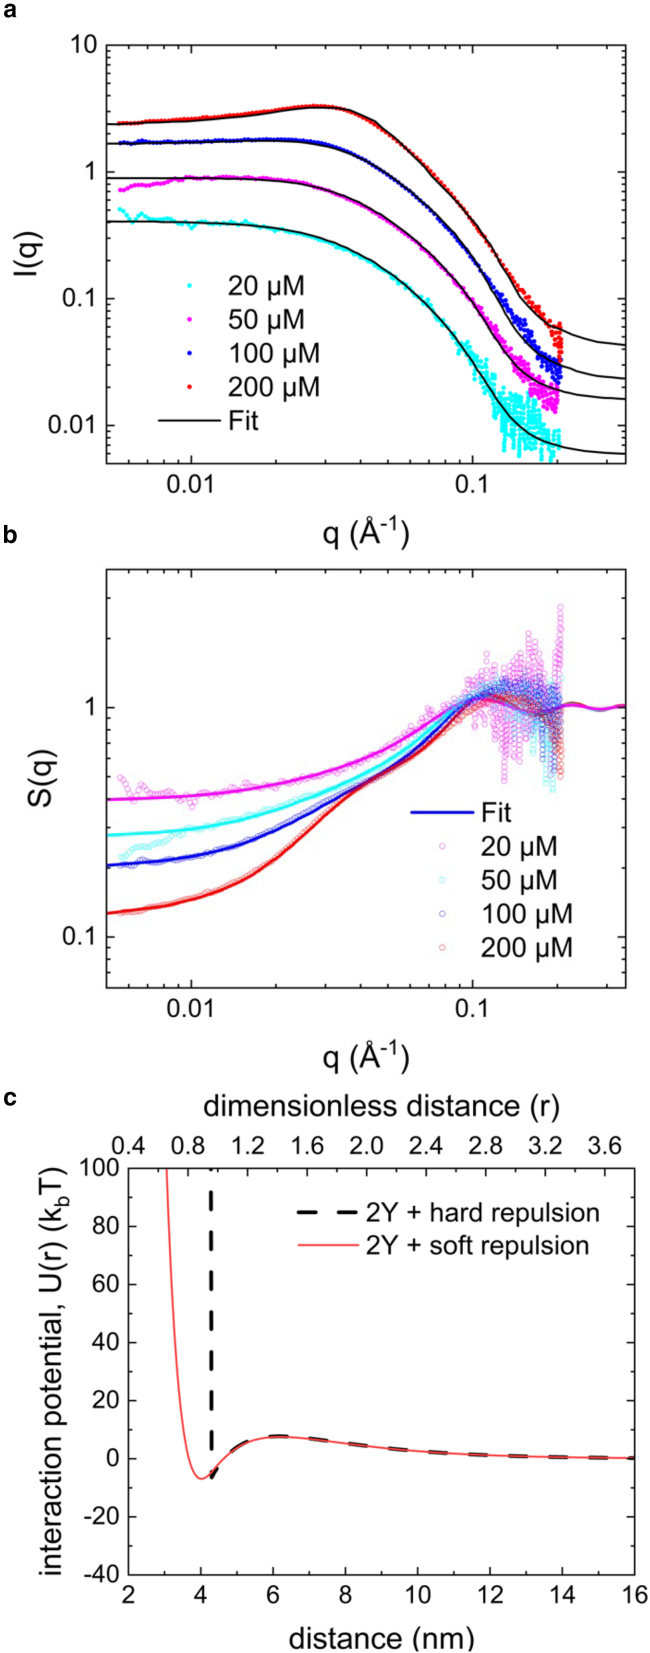
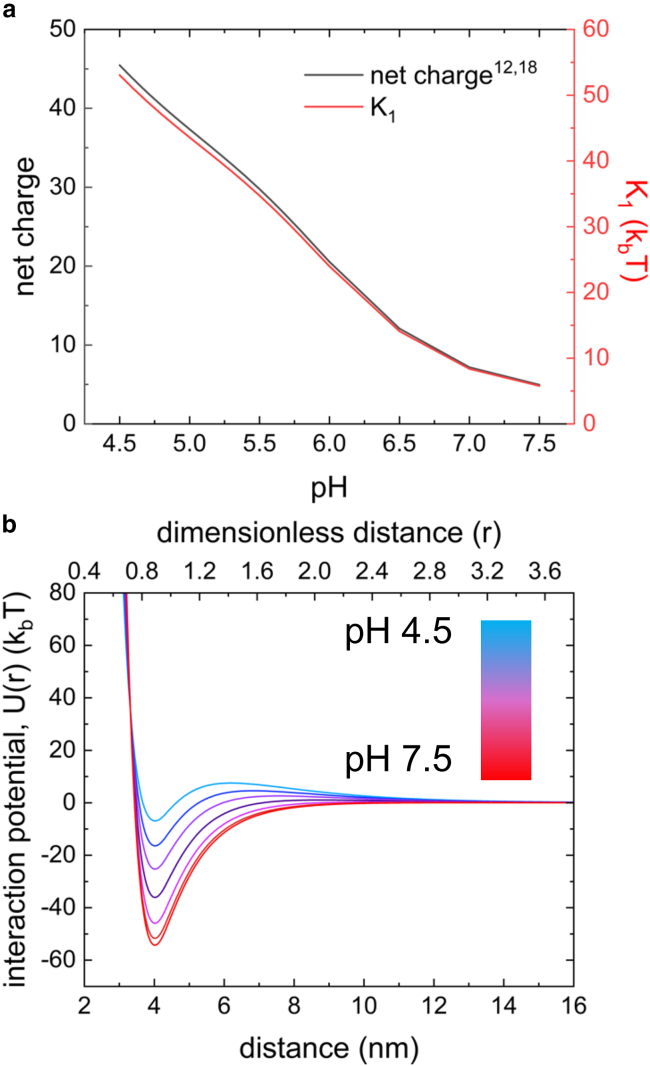
Reflectin is an intrinsically disordered protein known for its ability to modulate the biophotonic camouflage of cephalopods based on its assembly-induced osmotic properties. Its reversible self-assembly into discrete, size-controlled clusters and condensed droplets are known to depend sensitively on the net protein charge, making reflectin stimuli-responsive to pH, phosphorylation, and electric fields. Despite considerable efforts to characterize this behavior, the detailed physical mechanisms of reflectin's assembly are not yet fully understood. Here, we pursue a coarse-grained molecular understanding of reflectin assembly using a combination of experiments and simulations. We hypothesize that reflectin assembly and phase behavior can be explained from a remarkably simple colloidal model whereby individual protein monomers effectively interact via a short-range attractive and long-range repulsive (SA-LR) pair potential. We parameterize a coarse-grained SA-LR interaction potential for reflectin A1 from small-angle x-ray scattering measurements, and then extend it to a range of pH values using Gouy-Chapman theory to model monomer-monomer electrostatic interactions. The pH-dependent SA-LR interaction is then used in molecular dynamics simulations of reflectin assembly, which successfully capture a number of qualitative features of reflectin, including pH-dependent formation of discrete-sized nanoclusters and liquid-liquid phase separation at high pH, resulting in a putative phase diagram for reflectin. Importantly, we find that at low pH size-controlled reflectin clusters are equilibrium assemblies, which dynamically exchange protein monomers to maintain an equilibrium size distribution. These findings provide a mechanistic understanding of the equilibrium assembly of reflectin, and suggest that colloidal-scale models capture key driving forces and interactions to explain thermodynamic aspects of native reflectin behavior. Furthermore, the success of SA-LR interactions presented in this study demonstrates the potential of a colloidal interpretation of interactions and phenomena in a range of intrinsically disordered proteins.


Conflict of interest statement

Declaration of interests The authors declare no competing interests.

Figures

Figure 1
Figure 1
Illustration of reflectin self-assembly depicted as spherical colloids with short-range attractive and long-range repulsive interactions. Short-range attractions (blue) facilitate assembly of monomers into clusters, but are balanced by longer-range electrostatic repulsion (red) that thermodynamically limits the cluster size. Self-assembly of reflectin is triggered as the repulsive electrostatic forces are reduced in strength, proceeding from monomers to discrete-sized clusters and eventually a state of liquid-liquid phase separation (LLPS).
Figure 2
Figure 2
Schematic of overall modeling workflow, involving inverse fitting of SAXS data and molecular dynamics simulations. We first extract the structure factor, S(q), from experimentally measured SAXS data. The structure factor is used to estimate an interaction potential in the form of short-range attractive and long-range repulsive (SA-LR) potentials at different pH. With the pH-dependent interaction potential, molecular dynamics simulations are performed to capture the self-assembly of reflectin protein. With the same interaction potential, the phase diagram of reflectin is calculated using liquid-state theory.
Figure 3
Figure 3
Estimation of colloidal interaction potentials from SAXS measurements. (a) SAXS data and fitting based on a liquid-state theoretical model of reflectin A1 at pH 4.5 with concentrations of 20, 50, 100, and 200 μM. (b) Structure factor of (a) fit with two-Yukawa potential (100 μM). (c) Best-fit interaction potential resulting from (b) (dotted black line), and interaction potential after the hard-sphere repulsion is replaced with a soft repulsion (red line).
Figure 4
Figure 4
Estimated pH-dependence of colloidal interaction potential for reflectin A1 from Gouy-Chapman theory. (a) Net charge (12,18) of reflectin (left axis, black) and estimated K2 value (right axis, red) in the pH range 4.5–7.5. (b) The resulting estimated reflectin pair interaction potential as a function of pH based on a two-Yukawa form with a Gaussian-core repulsion. With increasing pH, the attractive well increases and the repulsive barrier decreases.
Figure 5
Figure 5
Snapshots from colloidal molecular dynamics simulations (100 μM) of reflectin A1 assembly at (a) pH 4.5, (b) pH 5.2, and (c) pH 7.0. (d) TEM of reflectin A1 clusters at pH 7.0 (12).
Figure 6
Figure 6
Hydrodynamic radius of assembled reflectin clusters. Lines represent simulation results, whereas points show experimental dynamic light scattering measurements (17). The blue filled points represent experiments in 20 mM sodium acetate (NaAc) buffer, which was used for SAXS measurements to inform the extracted interaction potential; empty points represent measurements in two other buffers, red for 2-(N-morpholino) ethane sulfonic acid (MES) and pink for 3-(N-morpholino) propane sulfonic acid (MOPS). The added salt concentration is maintained constant at 20 mM both for these experiments, and the concentration of reflectin A1 is 10 μM, as in simulations. The two sets of simulation results correspond to different initial structures, involving either randomly dispersed monomers (solid line) or a single cluster (dashed line). Error bars on the lines represent the possible hydrodynamic radius of the clusters between two different methods of approximating hydrodynamic radius. The upper bound represents the hydrodynamic radius calculated from radius of gyration from the simulations, using a methodology from a previous study (63). The lower bound gives the hydrodynamic radius calculated through an assumed packing density of the monomer in the clusters. The lines display the average of the two different methods.
Figure 7
Figure 7
Kinetic behavior of cluster formation and monomer exchange at 100 μM for (a) equilibrium clustering (pH < 5.35) and (b) kinetically limited clustering (pH > 5.35). The left panels show a snapshot of the simulation at the beginning of production run, where monomers in the same clusters are labeled with identical color. The right panels show a snapshot of the simulation at the end of production run (1.8 μs). Mixing of colors between clusters over time illustrates the process of monomer exchange.
Figure 8
Figure 8
Representative size distributions of reflectin clusters at different pH based on molecular dynamics simulations, with a system size of 500 particles corresponding to 10 μM reflectin protein.
Figure 9
Figure 9
Equilibrium phase diagram predicted for the SA-LR colloidal model of reflectin in a space of pH and concentration (in mg/mL). Four different regimes are observed: the dispersed fluid, cluster fluid, percolated cluster, and two-phase region. Both the boundaries between the dispersed fluid and the cluster fluid, and between the cluster fluid and the percolated cluster, are determined by molecular dynamics simulations at different pH and concentrations (shown as black dots). Particles in the dispersed fluid region primarily exist as monomers, while the cluster fluid region is defined when 80% of particles participate in clusters. In the percolated cluster region, the clustering is such that a continuous path of bonded monomers exists for more than 50% of the simulation time. Lastly, the boundary of the two-phase region is calculated through liquid-state perturbation theory (supporting material, section 3). The dashed portions of the phase boundary suggest limits of the theory, which extrapolates the phase boundary to lower concentrations where the ability to distinguish two phases in the liquid-state theory falls below the numerical resolution of the calculations.

Similar articles

Cited by

References

    1. Brangwynne C.P., Tompa P., Pappu R.V. Polymer physics of intracellular phase transitions. Nat. Phys. 2015;11:899–904.
    1. Martin E.W., Mittag T. Relationship of Sequence and Phase Separation in Protein Low-Complexity Regions. Biochemistry. 2018;57:2478–2487. - PMC - PubMed
    1. Weber S.C. Sequence-encoded material properties dictate the structure and function of nuclear bodies. Curr. Opin. Cell Biol. 2017;46:62–71. - PubMed
    1. Sreekumar A., Nyati M.K., et al. Chinnaiyan A.M. Profiling of cancer cells using protein microarrays: Discovery of novel radiation-regulated proteins. Cancer Res. 2001;61:7585–7593. - PubMed
    1. Song J., Levenson R., et al. Morse D.E. Reflectin Proteins Bind and Reorganize Synthetic Phospholipid Vesicles. Langmuir. 2020;36:2673–2682. - PubMed

Publication types

LinkOut - more resources