Randomized Controlled Trial
. 2024 Aug;109(8):1292-1304.
doi: 10.1113/EP091815. Epub 2024 Jul 4.

Growth differentiation factor 15 is not modified after weight loss induced by liraglutide in South Asians and Europids with type 2 diabetes mellitus

Affiliations
Randomized Controlled Trial

Growth differentiation factor 15 is not modified after weight loss induced by liraglutide in South Asians and Europids with type 2 diabetes mellitus

Carlijn A Hoekx et al. Exp Physiol. 2024 Aug.

Abstract

Glucagon-like peptide-1 receptor (GLP-1R) agonists induce weight loss in patients with type 2 diabetes mellitus (T2DM), but the underlying mechanism is unclear. Recently, the mechanism by which metformin induces weight loss could be explained by an increase in growth differentiation factor 15 (GDF15), which suppresses appetite. Therefore, we aimed to investigate whether the GLP-1R agonist liraglutide modifies plasma GDF15 levels in patients with T2DM. GDF15 levels were measured in plasma samples obtained from Dutch Europids and Dutch South Asians with T2DM before and after 26 weeks of treatment with daily liraglutide (n = 44) or placebo (n = 50) added to standard care. At baseline, circulating GDF15 levels did not differ between South Asians and Europids with T2DM. Treatment with liraglutide, compared to placebo, decreased body weight, but did not modify plasma GDF15 levels in all patients, or when data were split by ethnicity. Also, the change in plasma GDF15 levels after treatment with liraglutide did not correlate with changes in body weight or HbA1c levels. In addition, the dose of metformin used did not correlate with baseline plasma GDF15 levels. Compared to placebo, liraglutide treatment for 26 weeks does not modify plasma GDF15 levels in Dutch Europid or South Asian patients with T2DM. Thus, the weight loss induced by liraglutide is likely explained by other mechanisms beyond the GDF15 pathway. HIGHLIGHTS: What is the central question of this study? Growth differentiation factor 15 (GDF15) suppresses appetite and is increased by metformin: does the GLP-1R agonist liraglutide modify plasma GDF15 levels in patients with type 2 diabetes mellitus (T2DM)? What is the main finding and its importance? Plasma GDF15 levels did not differ between South Asians and Europids with T2DM and were not modified by 26 weeks of liraglutide in either ethnicity. Moreover, there was no correlation between the changes in plasma GDF15 levels and dosage of metformin administered, changes in body weight or HbA1c levels. The appetite-suppressing effect of liraglutide is likely exerted via pathways other than GDF15.

Keywords: ethnic differences; metabolic diseases; obesity; weight‐reducing drugs.


Conflict of interest statement

The authors declared no conflict of interest.

Figures
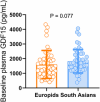
FIGURE 1
FIGURE 1
Comparison of plasma GDF15 levels in Europids and South Asians at baseline. Box plots showing plasma GDF15 levels in Europids (n = 47; orange box with circles) compared to South Asians (n = 47; blue box with circles) at baseline combined for the placebo and liraglutide treatment groups. Dots represent individual values, boxes represent means and error bars represent standard deviation (SD).
FIGURE 2
FIGURE 2
Changes in plasma GDF15 levels in Europids, South Asians and both ethnicities combined after 26 weeks of placebo or liraglutide treatment. Scatter plots showing changes in plasma GDF15 (26‐week treatment minus baseline values) of Europids (a), South Asians (b), and both ethnicities combined (c) after treatment with placebo (n = 50; green box and circles) or liraglutide (n = 44; red box and circles). Dots represent individual values, horizontal lines represent means and error bars represent standard deviation (SD).
FIGURE 3
FIGURE 3
Changes in plasma GDF15 levels in male and female Europids, South Asians and both ethnicities combined after 26 weeks of placebo or liraglutide treatment. Scatter plots showing changes in plasma GDF15 levels (26‐week treatment minus baseline values) of (a) Europid males (placebo: n = 14; green circles; liraglutide: n = 13; red circles), South Asian males placebo: n = 11; green circles; liraglutide: n = 8; red circles) and males of both ethnicities combined after placebo (n = 25; green circles) or liraglutide (n = 21; red circles), and (b) Europid females (placebo: n = 11; green circles; liraglutide: n = 9; red circles), South Asian females (placebo: n = 14; green circles; liraglutide: n = 14; red circles) and females of both ethnicities combined after placebo (n = 25; green circles) or liraglutide (n = 23; red circles). Dots represent individual values, horizontal lines represent means and error bars represent standard deviation (SD).
FIGURE 4
FIGURE 4
Correlations between changes in body weight and HbA1c levels and changes in plasma GDF15 levels after 26 weeks of treatment with placebo or liraglutide. Spearman correlation, in both Europids and South Asians, combined, between the change of body weight and the change in plasma GDF15 levels (a) and change in plasma HbA1c levels and change in plasma GDF15 levels (b) after treatment with placebo (n = 50; green circles) or liraglutide (n = 44; red circles). Dots represent individual values.
FIGURE 5
FIGURE 5
Correlations between changes in metabolic parameters and changes in plasma GDF15 levels after 26 weeks of treatment with placebo or liraglutide. Spearman's correlation plots between changes in fasting plasma glucose and changes in plasma GDF15 levels (a) and changes between total cholesterol levels and changes in plasma GDF15 levels (b) in both ethnicities combined after treatment with placebo (n = 50; green circles) or liraglutide (n = 44; red circles). For one participant in the placebo treatment group, the fasting glucose at the end of the study was missing (n = 43). Dots represent individual values.
FIGURE 6
FIGURE 6
Correlations between changes in subcutaneous adipose tissue, visceral adipose tissue, epicardial adipose tissue and paracardial adipose tissue volumes and changes in plasma GDF15 levels after 26 weeks of treatment with placebo or liraglutide. Spearman's correlation plots between changes in subcutaneous adipose tissue (a), visceral adipose tissue (b), epicardial adipose tissue (c), or paracardial adipose tissue volumes (d) and the change of plasma GDF15 levels in both ethnicities combined after treatment with placebo (n = 50; green circles) or liraglutide (n = 44; red circles). For six participants in the placebo treatment group, the epicardial adipose tissue (n = 44) and for five participants in the placebo group the paracardial adipose tissue (n = 45) was not reported. For four participants in the liraglutide treatment group, both epicardial adipose tissue and paracardial adipose tissue volumes could not be reported (n = 40) at either the start of the study, or at the end of the study, or both. This was due to either unsuccessful 1H‐MRS of the heart due to low signal‐to‐noise ratio incorrect peak frequency, or due to missing data (Bizino et al., ; van Eyk et al., 2019). Dots represent individual values.
FIGURE 7
FIGURE 7
Correlations between markers for kidney function and plasma GDF15 levels at baseline and after 26 weeks of treatment with placebo or liraglutide. (a, b) Spearman's correlation plots between baseline serum creatinine levels (a) or estimated glomerular filtration rate (eGFR) calculated based on serum creatine levels (b) and baseline plasma GDF15 levels in both ethnicities combined. (c, d) Spearman's correlations between changes in plasma creatine levels (c) or changes in eGFR (d) and changes in plasma GDF15 levels in both ethnicities combined after placebo (n = 50; green circle) or liraglutide (n = 44; red circles). Dots represent individual values.
FIGURE 8
FIGURE 8
Correlation between metformin dose and change of plasma GDF15. Spearman correlations between the metformin dose at baseline and baseline GDF15 levels (a) and between metformin dose at the end of the study and the change in plasma GDF15 levels (b) in both ethnicities combined after placebo (n = 48; green circles) or liraglutide (n = 44; red circles). Two participants in the placebo intervention arm did not use metformin at baseline (placebo; n = 48), but one participant started metformin during the trial (placebo; n = 49). Dots represent individual values.

References

    1. Adela, R. , & Banerjee, S. K. (2015). GDF‐15 as a target and biomarker for diabetes and cardiovascular diseases: A translational prospective. Journal of Diabetes Research, 2015, 490842. - PMC - PubMed
    1. American Diabetes Association Professional Practice Committee . (2021). 9. Pharmacologic approaches to glycemic treatment: Standards of medical care in diabetes—2022. Diabetes Care, 45, (Supplement_1), S125–S143. - PubMed
    1. Anjana, R. M. , Pradeepa, R. , Deepa, M. , Datta, M. , Sudha, V. , Unnikrishnan, R. , Bhansali, A. , Joshi, S. R. , Joshi, P. P. , Yajnik, C. S. , Dhandhania, V. K. , Nath, L. M. , Das, A. K. , Rao, P. V. , Madhu, S. V. , Shukla, D. K. , Kaur, T. , Priya, M. , Nirmal, E. , … Mohan, V. (2011). Prevalence of diabetes and prediabetes (impaired fasting glucose and/or impaired glucose tolerance) in urban and rural India: Phase I results of the Indian Council of Medical Research‐INdia DIABetes (ICMR‐INDIAB) study. Diabetologia, 54(12), 3022–3027. - PubMed
    1. Association, W. M. (2013). World medical association declaration of Helsinki: Ethical principles for medical research involving human subjects. Journal of the American Medical Association, 310(20), 2191–2194. - PubMed
    1. Baek, S. J. , Kim, K. S. , Nixon, J. B. , Wilson, L. C. , & Eling, T. E. (2001). Cyclooxygenase inhibitors regulate the expression of a TGF‐beta superfamily member that has proapoptotic and antitumorigenic activities. Molecular Pharmacology, 59(4), 901–908. - PubMed

Publication types

MeSH terms