. 2024 May 24;32(2):200818.
doi: 10.1016/j.omton.2024.200818. eCollection 2024 Jun 20.

CDKN2A copy number alteration in bladder cancer: Integrative analysis in patient-derived xenografts and cancer patients

Affiliations

CDKN2A copy number alteration in bladder cancer: Integrative analysis in patient-derived xenografts and cancer patients

Maria-Alexandra Papadimitriou et al. Mol Ther Oncol. .

Abstract

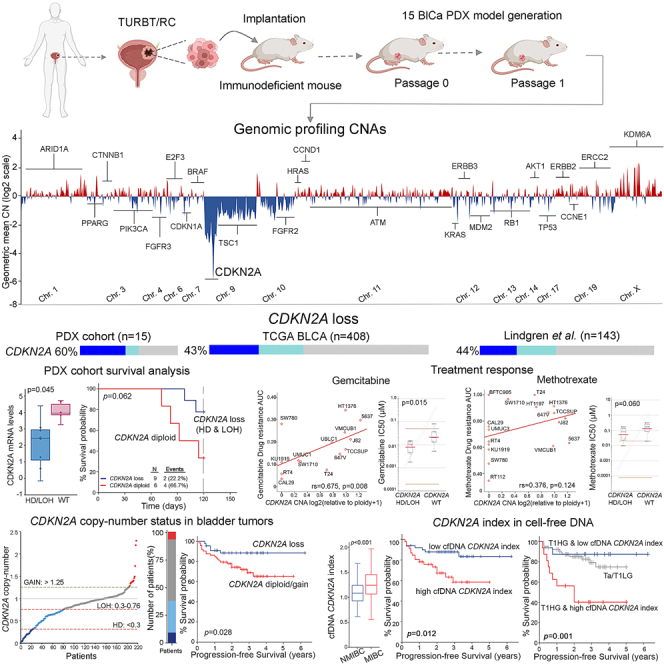
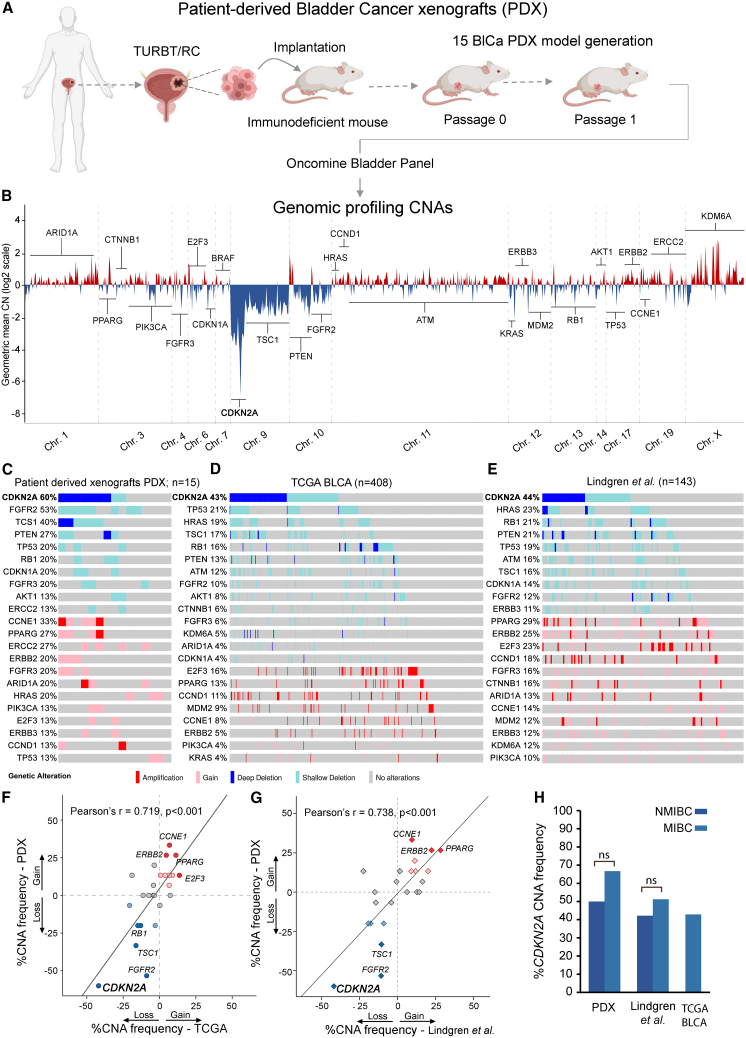
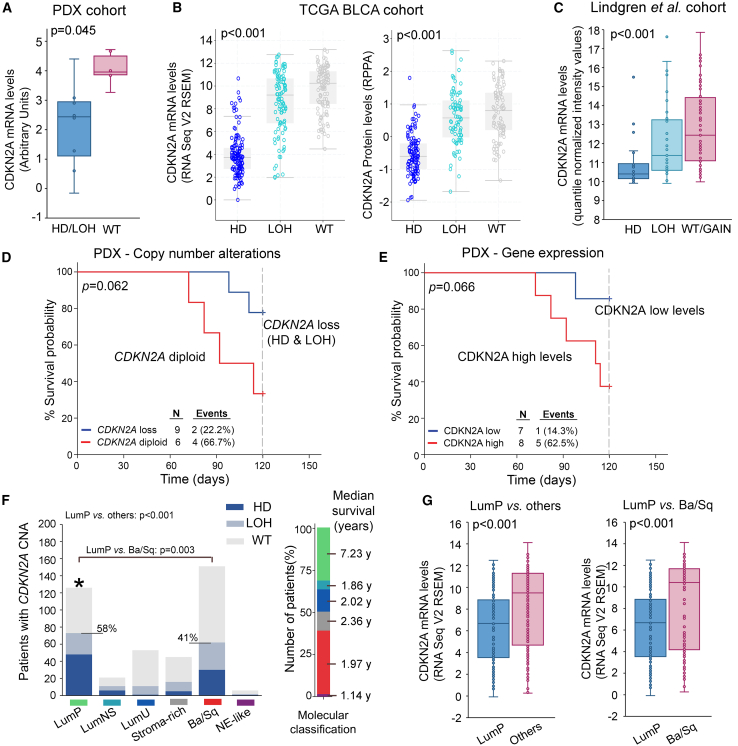
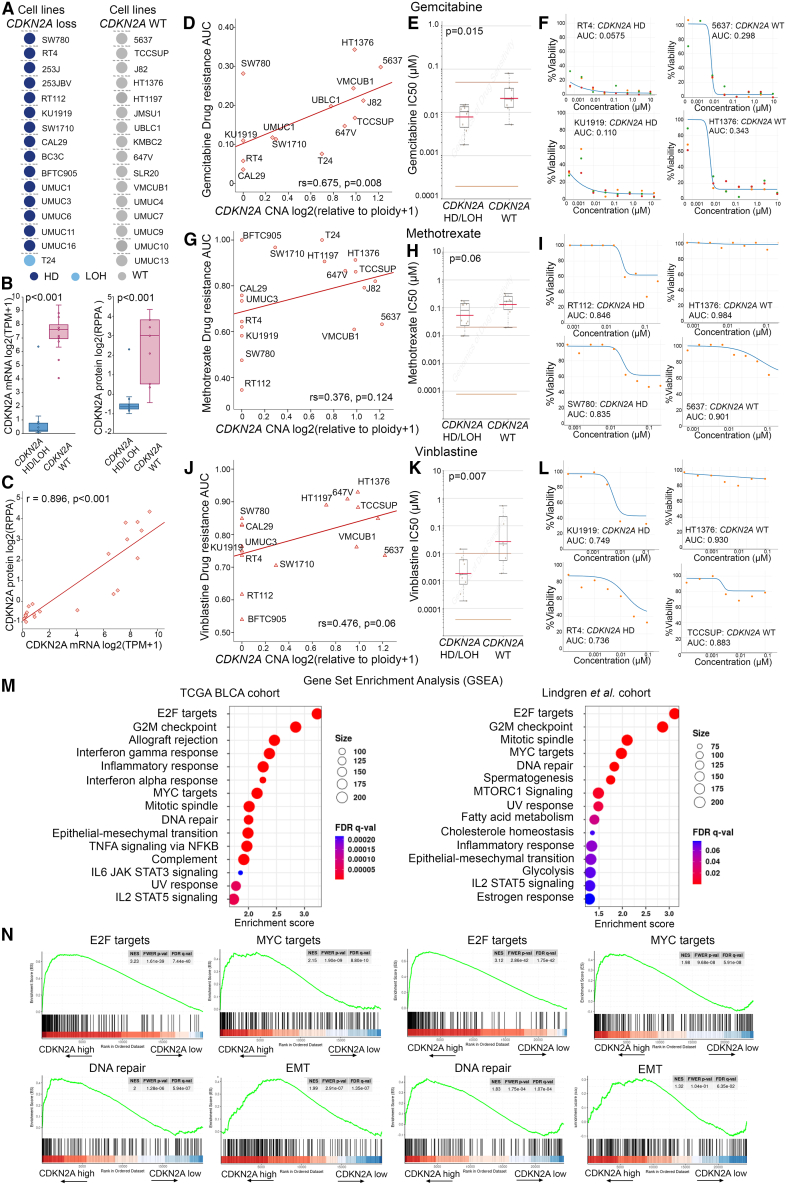
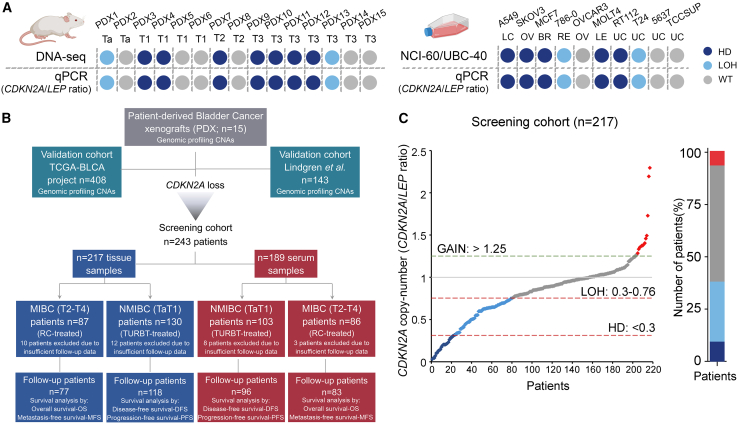
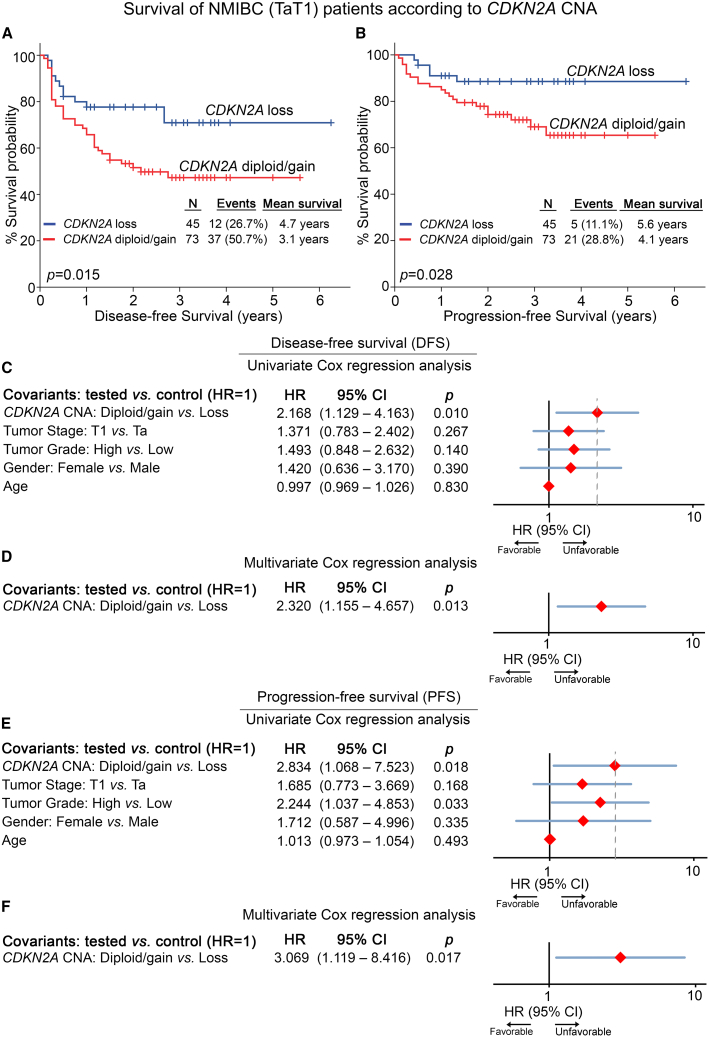
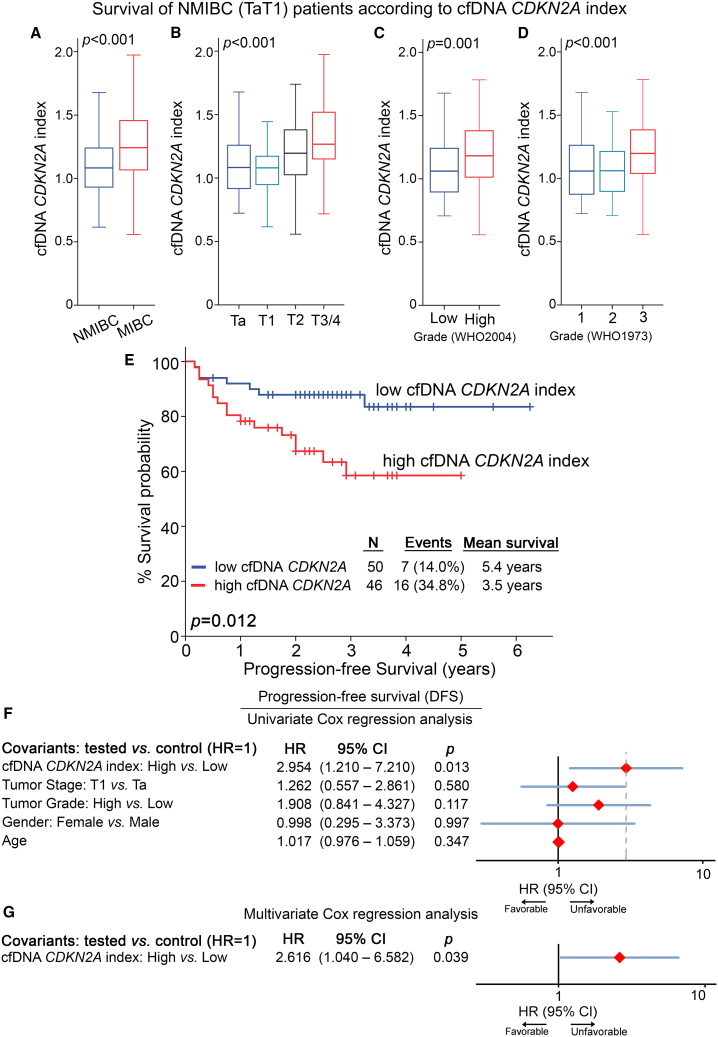
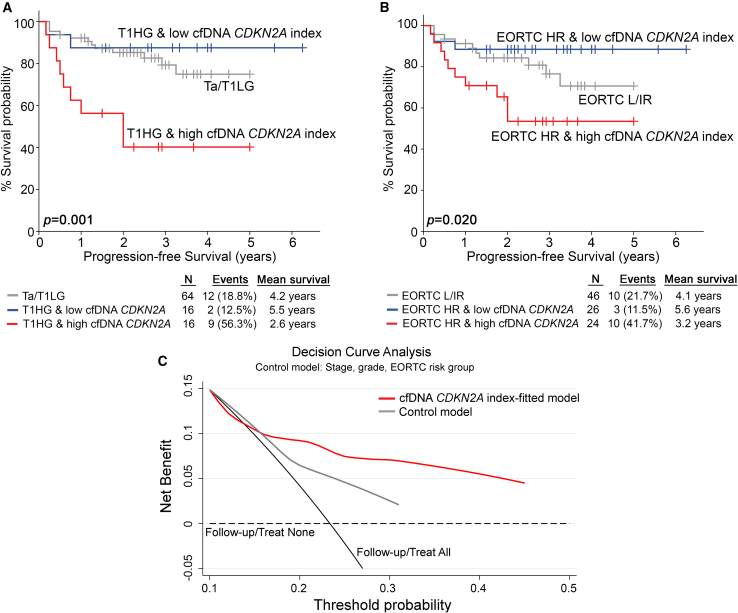
Bladder cancer (BlCa) is an extensively heterogeneous disease that leads to great variability in tumor evolution scenarios and lifelong patient surveillance, emphasizing the need for modern, minimally invasive precision medicine. Here, we explored the clinical significance of copy number alterations (CNAs) in BlCa. CNA profiling was performed in 15 patient-derived xenografts (PDXs) and validated in The Cancer Genome Atlas BlCa (TCGA-BLCA; n = 408) and Lindgren et al. (n = 143) cohorts. CDKN2A copy number loss was identified as the most frequent CNA in bladder tumors, associated with reduced CDKN2A expression, tumors of a papillary phenotype, and prolonged PDX survival. The study's screening cohort consisted of 243 BlCa patients, and CDKN2A copy number was assessed in genomic DNA and cell-free DNA (cfDNA) from 217 tumors and 189 pre-treatment serum samples, respectively. CDKN2A copy number loss was correlated with superior disease-free and progression-free survival of non-muscle-invasive BlCa (NMIBC) patients. Moreover, a higher CDKN2A index (CDKN2A/LEP ratio) in pre-treatment cfDNA was associated with advanced tumor stage and grade and short-term NMIBC progression to invasive disease, while multivariate models fitted for CDKN2A index in pre-treatment cfDNA offered superior risk stratification of T1/high-grade and EORTC high-risk patients, enhancing prediction of treatment outcome. CDKN2A copy number status could serve as a minimally invasive tool to improve risk stratification and support personalized prognosis in BlCa.

Keywords: CNV; DNA-seq; MT: Regular Issue; PDX mouse model; cfDNA; copy number variation; ctDNA; liquid biopsy; p14ARF; p16INK4A; prognosis.


Conflict of interest statement

The authors declare no competing interests.

Figures

None
Graphical abstract
Figure 1
Figure 1
CNA analysis of PDX mouse models (A) Study design of PDX generation and CNA profiling. (B) CNA profiles of PDXs across the genome. Copy number losses are shown in blue and copy number gains in red. (C–E) Oncoplots of CNAs in PDX tumors (C) and the TCGA-BLCA (D) and Lindgren et al. (E) cohorts. (F and G) Pearson correlation dot plot of CNA frequency (%) between the PDX and TCGA-BLCA (F) and between the PDX and Lindgren et al. (G) cohorts. (H) Bar graph of CDKN2A CNA frequency (%) in the NMIBC and MIBC of PDX models and the Lindgren et al. and TCGA-BLCA cohorts. Oncoplots were generated by the cBioPortal Oncoprinter tool.
Figure 2
Figure 2
CDKN2A copy number status in bladder tumors (A–C) Boxplots presenting the correlation of CDKN2A copy number loss (HD/LOH) with mRNA expression across PDX samples (A), mRNA and protein levels in the TCGA-BLCA cohort (B), and mRNA levels in the Lindgren et al. cohort (C). The p values were calculated by Mann-Whitney U (A) and Kruskal-Wallis (B and C) tests. (D and E) Kaplan-Meier survival curves of PDX mouse models according to CDKN2A copy number status (D) and CDKN2A mRNA levels (E). The p value was calculated by log rank test. (F) Bar graphs of CDKN2A copy number status distribution across the molecular subtypes (consensusMIBC 2020) of the TCGA-BLCA cohort. The p values were evaluated by Fisher’s exact test. (G) Boxplots presenting the correlation of CDKN2A expression between LumP vs. other subtypes and LumP vs. Ba/Sq subtypes. The p values were calculated by Mann-Whitney U test.
Figure 3
Figure 3
In silico analysis of CDKN2A copy number loss in the bladder tumor molecular background and chemotherapy response (A) CDKN2A copy number status of BlCa cell lines in the DepMap portal (https://depmap.org/portal/). (B) Boxplots presenting the correlation of CDKN2A copy number loss (HD/LOH) with mRNA and protein expression across BlCa cells. (C) Spearman correlation of CDKN2A mRNA and protein levels in BlCa cells. (D–L) Correlation of CDKN2A CNA with area under the dose-response curve (AUC) and IC50 values of BlCa cell lines for gemcitabine (D and E), methotrexate (G and H), and vinblastine (J and K). The p values were calculated by Mann-Whitney U test (B, E, H, and K) and Spearman analysis (C, D, G, and J). Shown are indicative dose-response curves of BlCa cells with CDKN2A copy number loss (e.g., RT4, RT112, KU1919, and SW780) compared to WT cells (e.g., 5637, HT1376, and TCCSUP) for gemcitabine (F), methotrexate (I), and vinblastine (L). (M) Dot plot of GSEA Hallmark analysis of the CDKN2A-related enriched gene sets in the TCGA-BLCA and Lindgren et al. cohorts. The size of the dots represents the number of genes, and the color of the dots represents the false discovery rate (FDR) q value. (N) Enrichment plots for the top four gene sets enriched in GSEA Hallmark analysis in the TCGA-BLCA and Lindgren et al. cohorts.
Figure 4
Figure 4
CDKN2A copy-number status screening in BlCa patients (A) Comparison of CDKN2A copy number status between DNA-seq and qPCR in PDX models (left) and NCI-60/UBC-40 cell line panels and qPCR in 10 selected cell lines (right). (B) REMARK diagram of the study. (C) Distribution of CDKN2A copy number status in tumors of our BlCa screening cohort.
Figure 5
Figure 5
CDKN2A copy number loss is associated with superior event-free survival of NMIBC patients (A and B) Kaplan-Meier survival curves for disease-free survival (DFS; A) and progression-free survival (PFS; B) of the NMIBC cohort according to CDKN2A copy number status. The p values were calculated by log rank test. (C–F) Forest plots of the univariate and multivariate Cox regression analysis for DFS (C and D) and PFS (E and F) of NMIBC patients. Internal validation was performed by bootstrap Cox proportional regression analysis based on 1,000 bootstrap samples. HR, hazard ratio; 95% CI, 95% confidence interval of the estimated HR.
Figure 6
Figure 6
High CDKN2A index in pre-treatment cfDNA is associated with worse prognosis (A–D) Boxplots presenting the correlation of the CDKN2A index in pre-treatment cfDNA with patient tumor stage (A and B) and grade (C and D). The p values (two-sided) were calculated by Mann-Whitney U (A and C) and Kruskal-Wallis (B and D) tests. (E) Kaplan-Meier survival curve for the PFS of the NMIBC cohort according to CDKN2A index in pre-treatment cfDNA. The p value was calculated by log rank test. (F and G) Forest plots of the univariate and multivariate Cox regression analysis for the PFS of NMIBC patients. Internal validation was performed by bootstrap Cox proportional regression analysis based on 1,000 bootstrap samples.
Figure 7
Figure 7
Evaluation of the CDKN2A index in pre-treatment cfDNA improves risk stratification and prediction of NMIBC progression to muscle-invasive disease (A and B) Kaplan-Meier survival curves for the PFS of NMIBC patients according to CDKN2A index in pre-treatment cfDNA combined with tumor stage/grade (A) and EORTC risk group (B). The p values were calculated by log rank test. (C) DCA curves of “cfDNA CDKN2A index-fitted” and “control” multivariate prognostic models for the PFS of NMIBC patients. Net benefit is plotted against various ranges of threshold probabilities.

References

    1. Sung H., Ferlay J., Siegel R.L., Laversanne M., Soerjomataram I., Jemal A., Bray F. Global Cancer Statistics 2020: GLOBOCAN Estimates of Incidence and Mortality Worldwide for 36 Cancers in 185 Countries. CA A Cancer J. Clin. 2021;71:209–249. - PubMed
    1. Cambier S., Sylvester R.J., Collette L., Gontero P., Brausi M.A., van Andel G., Kirkels W.J., Silva F.C.D., Oosterlinck W., Prescott S., et al. EORTC Nomograms and Risk Groups for Predicting Recurrence, Progression, and Disease-specific and Overall Survival in Non-Muscle-invasive Stage Ta-T1 Urothelial Bladder Cancer Patients Treated with 1-3 Years of Maintenance Bacillus Calmette-Guérin. Eur. Urol. 2016;69:60–69. - PubMed
    1. Messing E.M., Tangen C.M., Lerner S.P., Sahasrabudhe D.M., Koppie T.M., Wood D.P., Jr., Mack P.C., Svatek R.S., Evans C.P., Hafez K.S., et al. Effect of Intravesical Instillation of Gemcitabine vs Saline Immediately Following Resection of Suspected Low-Grade Non-Muscle-Invasive Bladder Cancer on Tumor Recurrence: SWOG S0337 Randomized Clinical Trial. JAMA. 2018;319:1880–1888. - PMC - PubMed
    1. Witjes J.A., Bruins H.M., Cathomas R., Compérat E.M., Cowan N.C., Gakis G., Hernández V., Linares Espinós E., Lorch A., Neuzillet Y., et al. European Association of Urology Guidelines on Muscle-invasive and Metastatic Bladder Cancer: Summary of the 2020 Guidelines. Eur. Urol. 2021;79:82–104. - PubMed
    1. Tran L., Xiao J.F., Agarwal N., Duex J.E., Theodorescu D. Advances in bladder cancer biology and therapy. Nat. Rev. Cancer. 2021;21:104–121. - PMC - PubMed

LinkOut - more resources