. 2024 Apr 11;11(6):nwae142.
doi: 10.1093/nsr/nwae142. eCollection 2024 Jun.

Human CD56+CD39+ dNK cells support fetal survival through controlling trophoblastic cell fate: immune mechanisms of recurrent early pregnancy loss

Affiliations

Human CD56+CD39+ dNK cells support fetal survival through controlling trophoblastic cell fate: immune mechanisms of recurrent early pregnancy loss

Wentong Jia et al. Natl Sci Rev. .

Abstract

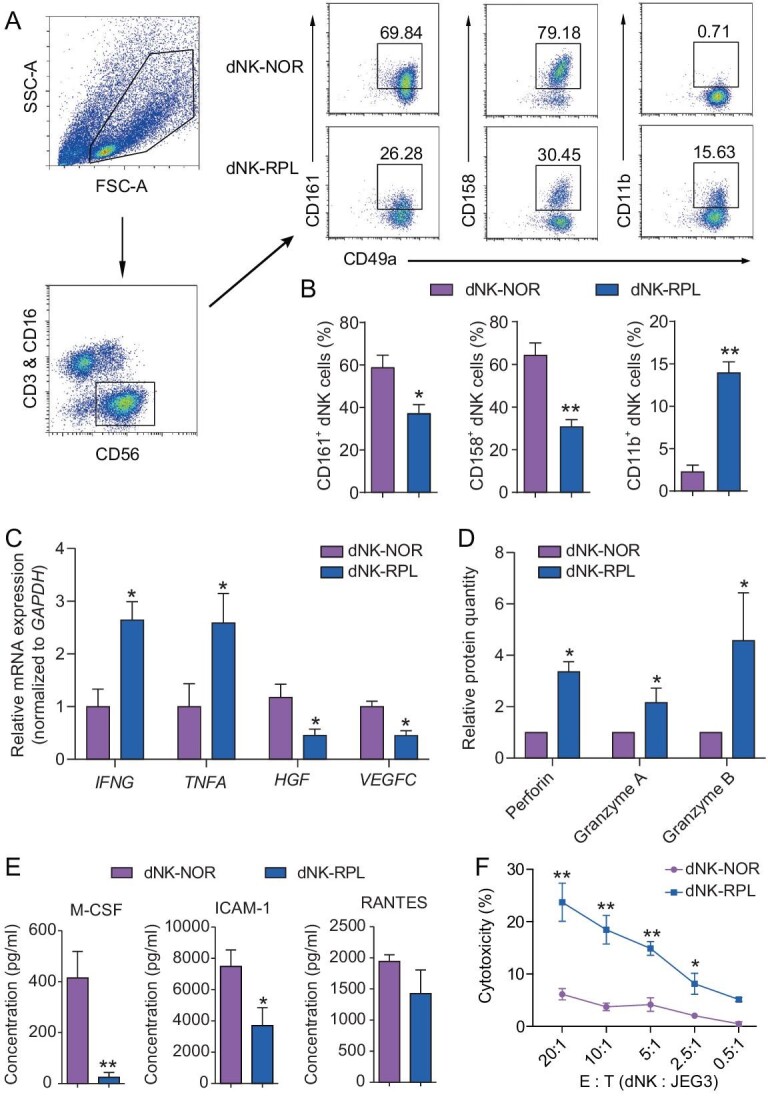
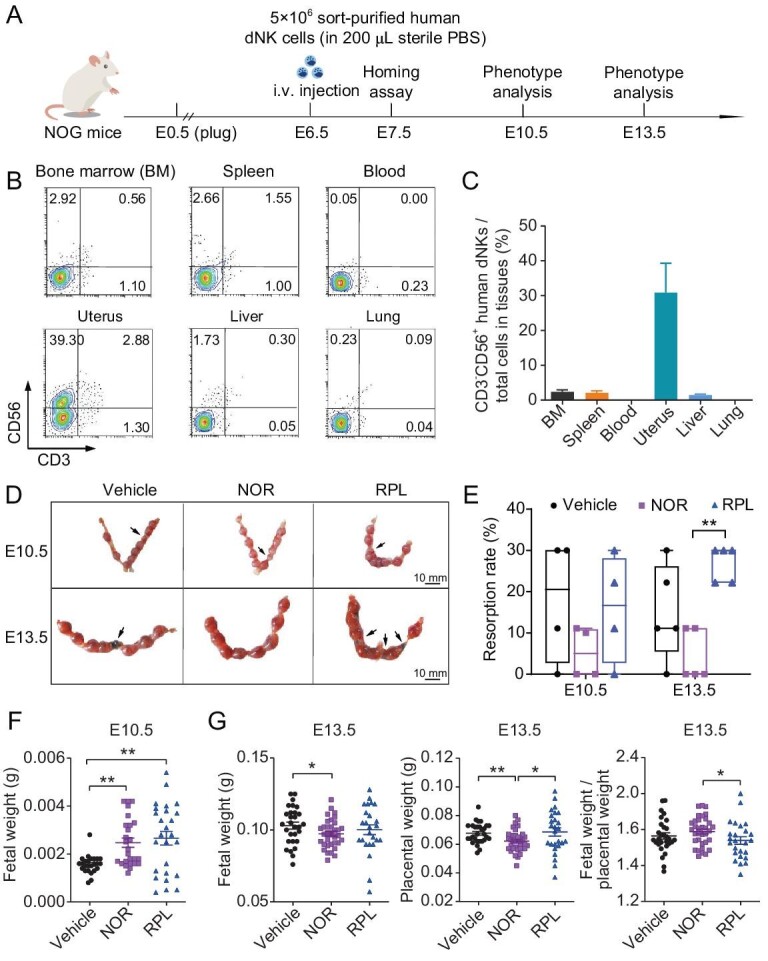
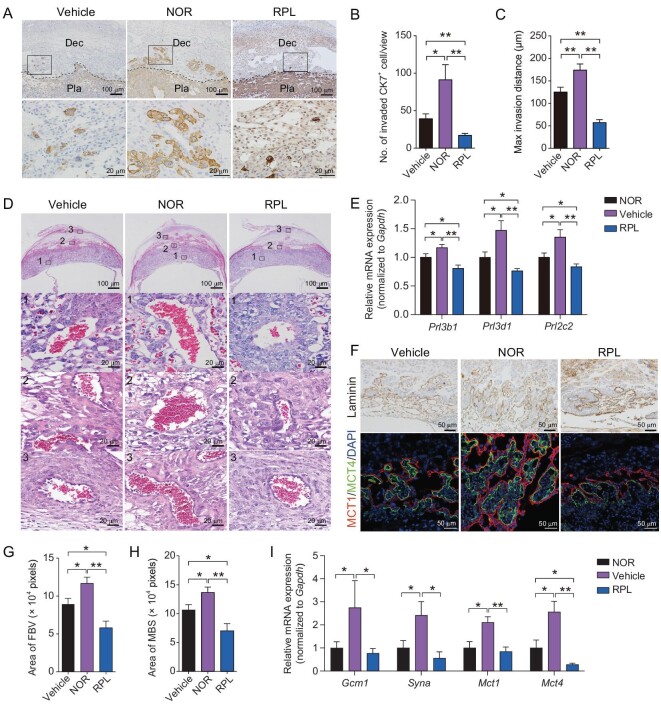
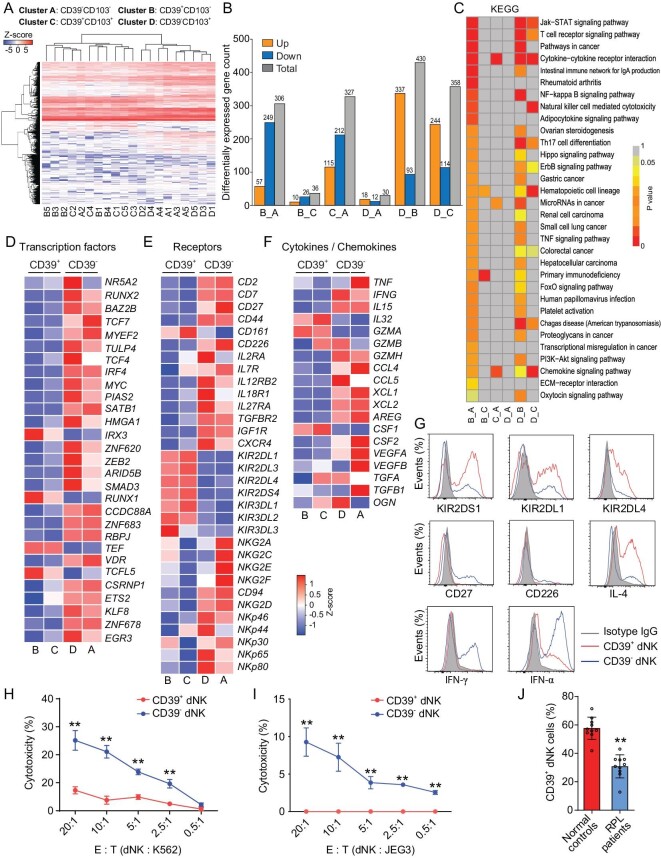
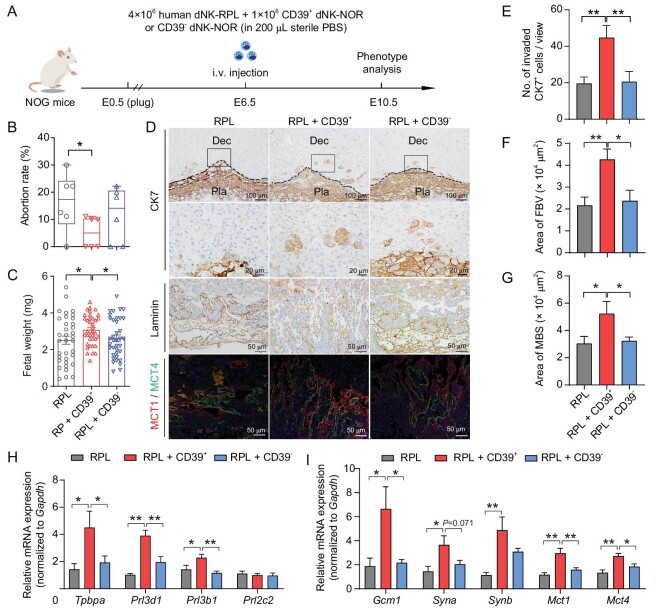
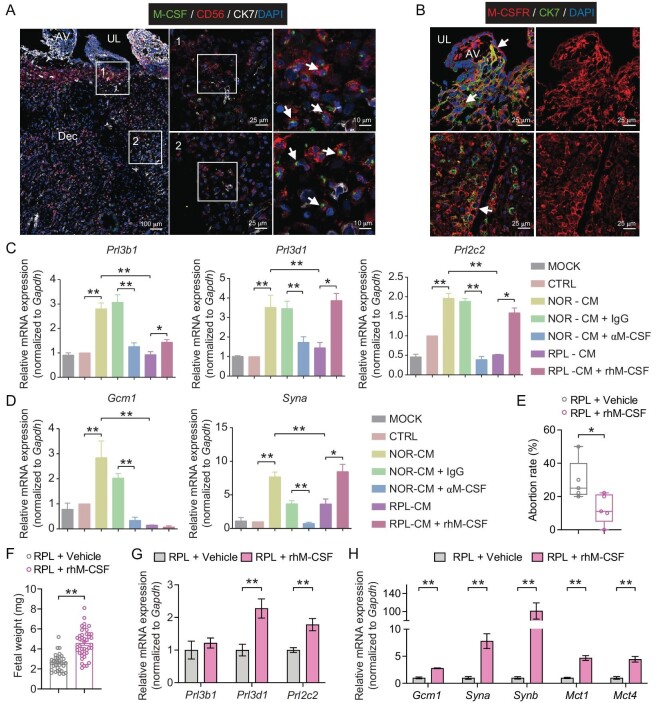
Decidual natural killer (dNK) cells are the most abundant immune cells at the maternal-fetal interface during early pregnancy in both mice and humans, and emerging single-cell transcriptomic studies have uncovered various human dNK subsets that are disrupted in patients experiencing recurrent early pregnancy loss (RPL) at early gestational stage, suggesting a connection between abnormal proportions or characteristics of dNK subsets and RPL pathogenesis. However, the functional mechanisms underlying this association remain unclear. Here, we established a mouse model by adoptively transferring human dNK cells into pregnant NOG (NOD/Shi-scid/IL-2Rγnull) mice, where human dNK cells predominantly homed into the uteri of recipients. Using this model, we observed a strong correlation between the properties of human dNK cells and pregnancy outcome. The transfer of dNK cells from RPL patients (dNK-RPL) remarkably worsened early pregnancy loss and impaired placental trophoblast cell differentiation in the recipients. These adverse effects were effectively reversed by transferring CD56+CD39+ dNK cells. Mechanistic studies revealed that CD56+CD39+ dNK subset facilitates early differentiation of mouse trophoblast stem cells (mTSCs) towards both invasive and syncytial pathways through secreting macrophage colony-stimulating factor (M-CSF). Administration of recombinant M-CSF to NOG mice transferred with dNK-RPL efficiently rescued the exacerbated pregnancy outcomes and fetal/placental development. Collectively, this study established a novel humanized mouse model featuring functional human dNK cells homing into the uteri of recipients and uncovered the pivotal role of M-CSF in fetal-supporting function of CD56+CD39+ dNK cells during early pregnancy, highlighting that M-CSF may be a previously unappreciated therapeutic target for intervening RPL.

Keywords: CD56+CD39+ dNK subset; M-CSF; NOG mice; adoptive transfer; placental trophoblast cell fate; recurrent pregnancy loss.


Figures

Figure 1.
Figure 1.
The cell properties of human dNK cells derived from normal pregnant women (dNK-NOR) and RPL patients (dNK-RPL) during gestational weeks 6–9. (A and B) Representative flow cytometry plots (A) and corresponding statistical analyses (B) demonstrating the frequency of functional receptors, including CD161, CD158, and CD11b in dNK-NOR (n = 6) and dNK-RPL (n = 6). (C) Quantitative real-time PCR analyses showing expression levels of pro-inflammatory cytokines (IFNG and TNFA) and growth factors (HGF and VEGFC) in freshly isolated dNK-NOR (n = 4) and dNK-RPL (n = 4). (D and E) Mass spectrometry analyses (D) and protein array analyses (E) showing levels of granule exocytosis proteins and cytokines/growth factors in the supernatants of dNK-NOR (n = 4) and dNK-RPL (n = 4) after in vitro culture for 48 hours. (F) Cytotoxicity assay showing the cytotoxic capacity of dNK-NOR and dNK-RPL against JEG3 cells. E: T, effector cell: target cell. The results are based on three independent experiments. All data are presented as mean ± SEM, with statistical analyses conducted using unpaired Student's t-test for panels B and E, multiple t-test for panels C and D, and two-way ANOVA with Fisher's LSD post-hoc test for panel F. Compared to dNK-NOR, *, P < 0.05; **, P < 0.01.
Figure 2.
Figure 2.
The pregnancy outcomes of NOG mice that received adoptive transfer of human dNK cells from normal pregnant women and RPL patients. (A) Schematic diagram illustrating experimental design of the adoptive transfer of 5 × 106 human dNK cells isolated from normal pregnant women (NOR group) or RPL patients (RPL group), or an equal volume of sterile PBS (Vehicle group), into pregnant NOG mice at E6.5 via tail vein injection. (B and C) Representative flow cytometry plots (B) and corresponding statistical analysis results (C) demonstrating the distribution of transferred human dNK cells in multiple tissues of recipient mice at E7.5 (n = 2). (D) Representative images displaying implantation sites in recipient mice at E10.5 and E13.5, with aborted embryos indicated by black arrow. (E) Statistical analysis revealing abortion rates in recipient mice at E10.5 and E13.5. (F) Statistical results indicating fetal weight of surviving fetuses in recipient mice at E10.5. (G) Statistical analysis presenting fetal weight, placental weight, and ratio of fetal weight and placental weight of surviving fetuses in recipient mice at E13.5. Data presented in panels E–G are shown as mean ± SEM, and the statistical analyses were performed using unpaired Student's t-test. *, P < 0.05; **, P < 0.01.
Figure 3.
Figure 3.
The placental phenotypes in NOG mice that received adoptive transfer of human dNK cells from normal pregnant women and RPL patients. (A) Representative images of immunohistochemical staining for cytokeratin 7 (CK7) in the placentae at E13.5 from the Vehicle, NOR, and RPL groups. Pla, placenta; Dec, decidua. The scale bar is set at 100 μm (top row) and 20 μm (bottom row). (B and C) Statistical analysis revealing the number of invaded trophoblasts (B) and their maximum invasion distance (C) in decidual tissues from each group. (D) Representative images of H&E staining of placentae at E13.5 from the Vehicle, NOR, and RPL groups. Higher magnification in bottom panels correspond to top panels highlighting specific areas such as canal vessel in labyrinth layer, proximal decidua, and distal decidua labeled as areas 1, 2, and 3, respectively. Scale bar is set at 500 μm (top row) and 20 μm (bottom three rows). (E) Quantitative real-time PCR analysis demonstrating marker gene expression related to trophoblast invasion in placentae at E13.5 from the Vehicle, NOR, and RPL groups. (F) Representative images depicting immunohistochemistry for laminin (top row) and immunofluorescence for MCT1 (red) and MCT4 (green) (bottom row) in the placentae at E10.5 from the Vehicle, NOR, and RPL groups, with DAPI (blue) indicating nuclei. Scale bar is set at 50 μm. (G and H) Statistical results representing the area of fetal blood vessels (FBV; G) and maternal blood sinuses (MBS; H) in the placentae at E10.5 from the Vehicle, NOR, and RPL groups. (I) Quantitative real-time PCR analysis showing expression of marker genes associated with trophoblast syncytialization in the placentae at E10.5 from the Vehicle, NOR, and RPL groups. Data are shown as mean ± SEM for panels B, C, E, and G–I. Statistical analyses were performed by one-way ANOVA with Fisher's LSD post-hoc test for panels B, C, G, and H; and multiple t-test for panels E and I based on number of the placentae n = 6 in the Vehicle group, n = 5 in the NOR group, n = 7 in the RPL group. For B, C, G, and H, one or two views from each placenta were analyzed. *, P < 0.05; **, P < 0.01.
Figure 4.
Figure 4.
Transcriptomic assay and cell property analysis of human dNK subsets. (A) Heatmap with dendrogram analyses of Smart-seq2 RNA sequencing data showing the clustering characteristics of four flow-sorted dNK subsets from normal pregnant women at gestational week 6–9 (n = 5) using specific antibodies against CD3, CD16, CD56, CD39, and CD103. The CD3CD16CD56+ dNK cells were classified into four clusters based on the expression of CD39 and CD103: cluster A (CD39CD103), cluster B (CD39+CD103), cluster C (CD39+CD103+), and cluster D (CD39CD103+). (B) Two-by-two comparisons revealing differentially expressed genes among the four dNK clusters. (C) Two-by-two comparison-based KEGG enrichment analyses indicating signaling pathways associated with the differentially expressed genes among the four dNK clusters. (D–F) Heatmap displaying relative expressions (Z-score) of transcription factors (D), functional receptors (E), cytokines and chemokines (F) in the four dNK clusters. (G) Flow cytometric histograms demonstrating the expression of selected functional receptors and inflammation-associated cytokines in two subsets of dNK cells: CD16CD56+CD39+ dNK subset (CD39+ dNK) and CD16CD56+CD39 dNK subset (CD39 dNK). These subsets were isolated from five normal pregnant women. (H–I) Cytotoxicity assay showing the cytotoxic capacity of CD39+ dNK and CD39 dNK cells against K562 (H) and JEG3 (I) target cells. The experiment was independently repeated three times using dNK cells from five normal pregnant women. (J) Flow cytometry results showing a difference in proportions of CD39+dNK cells between normal pregnant women (Normal; n = 10) and RPL patients (RPL patients; n = 10). Statistical analyses were performed by two-way ANOVA with Fisher's LSD post-hoc test for panels H–I and unpaired Student's t-test for panel J. *, P < 0.05; **, P < 0.01.
Figure 5.
Figure 5.
The pregnancy outcomes and placental phenotypes of NOG mice that received adoptive transfer of human dNK cells from RPL patients along with CD39+ dNK or CD39+ dNK from normal pregnancies. (A) Schematic diagram showing the experimental design of adoptive transfer of human dNK cells into NOG mice. 5 × 106 dNK cells from RPL patients (RPL group), or 1 × 106 CD39+ (RPL + CD39+) or CD39 dNK cells (RPL + CD39) from normal pregnancies along with 4 × 106 dNK cells from RPL patients, were injected into pregnant NOG mice via the tail vein at E6.5. (B) Statistical analysis revealing abortion rates in recipient mice at E10.5, including the number of dams (n) as well as the ratio of aborted/total embryos (r). RPL group had n = 6 with r = 9/54; RPL + CD39+ group had n = 6 with r = 3/56; RPL + CD39 group had n = 6 with r = 7/56. (C) Statistical analysis of fetal weight from surviving fetuses in recipient mice at E10.5. (D) Representative images of immunohistochemical staining for cytokeratin 7 (CK7, top two rows) and laminin (third row), as well as immunofluorescent staining for MCT1 (red) and MCT4 (green) (bottom row) in placentae at E10.5 from the RPL, RPL + CD39+, and RPL + CD39 groups. DAPI (blue) was used to label nuclei. A black dash line indicated the boundary between decidua and spongiotrophoblast layer. Dec, decidua; Pla, placenta. Scale bar, 100 μm (top row), 20 μm (second row), and 50 μm (bottom two rows). (E) Statistical results showing the number of invaded trophoblast cells in decidual tissues from the RPL, RPL + CD39+, and RPL + CD39 groups. (F and G) Statistical analysis revealing the area of fetal blood vessels (FBV; F) and maternal blood sinuses (MBS; G) in placentae at E10.5 from the RPL, RPL + CD39+, and RPL + CD39 groups. (H and I) Quantitative real-time PCR analysis showing differential expression of marker genes associated with trophoblast invasion (H) and syncytialization (I) in placentae at E10.5 from the RPL, RPL + CD39+, and RPL + CD39 groups. Data are shown as mean ± SEM for panels B, C, and E–I. Statistical analyses were performed by unpaired Student's t-test for panels B and C, one-way ANOVA with Fisher's LSD post-hoc test for panels E–G, and multiple t-test for panels H and I based on number of placentae n = 12 in the RPL group, n = 10 in the RPL + CD39+ group, n = 12 in the RPL + CD39 group. For E, F, and G, one or two views from each placenta were analyzed. *, P < 0.05; **, P < 0.01.
Figure 6.
Figure 6.
Effects of human dNK cells and M-CSF on mTSC differentiation and pregnancy outcomes. (A) Immunofluorescence staining for M-CSF (green), CD56 (red), and CK7 (white) at human maternal-fetal interface at gestational week 8. Middle panels represent higher magnification of the indicated region in left panels, and right panels represent higher magnification of the indicated region in middle panels. Regions 1 and 2 indicate decidual superficial layer and decidual compacta layer, respectively. The white arrows indicate CD56+M-CSF+ dNK cells. Scale bar, 100 μm (left panel), 25 μm (middle panels), and 25 μm (right panels). (B) Immunofluorescence staining for M-CSFR (red) and CK7 (green) at human maternal-fetal interface at gestational week 8. The white arrows indicate CK7+M-CSFR+ trophoblast cells. AV, anchoring villi; UL, uterine lumen; Dec, decidua. Scale bar, 25 μm. (C and D) Quantitative real-time PCR analysis showing expression of marker genes associated with trophoblast differentiation towards invasive pathway (C) or syncytial pathways (D) in mTSCs cells with various treatments as below. MOCK, mTSCs in differentiation media (inducing invasion in D–F, inducing syncytialization in G–H). CTRL, mTSCs in differentiation media supplemented with 50% dNK-free media. NOR-CM, mTSCs in differentiation media supplemented with 50% conditioned media of human dNK cells from normal pregnancies. NOR-CM-IgG, mTSCs in differentiation media supplemented with 50% conditioned media of human normal dNK cells that had been pre-incubated with pre-immune IgG. NOR-CM-αM-CSF, mTSCs in differentiation media supplemented with 50% conditioned media of human normal dNK cells that had been pre-incubated with neutralizing antibody against M-CSF. RPL-CM, mTSCs in differentiation media supplemented with 50% conditioned media of human dNK cells from RPL patients. RPL-CM-rhM-CSF, mTSCs in differentiation media supplemented with 50% conditioned media of RPL dNK cells and 1 ng/mL recombinant human M-CSF. (E and F) Pregnancy outcomes of NOG mice that were intravenously injected with 5 × 106 dNK cells from RPL patients at E6.5 followed by intraperitoneal administration of 0.5 mg/kg/day of rhM-CSF (RPL + rhM-CSF, n = 5) or equal volume of sterile PBS (RPL + Vehicle, n = 5) for 4 days (E6.5–E9.5). Statistical analysis showing the abortion rates (E) and the fetal weight of surviving fetuses (F) in the recipient mice at E10.5. For panel F, RPL + Vehicle group, n = 32; RPL + rhM-CSF, n = 42. (G and H) Quantitative real-time PCR analysis showing the expression of marker genes associated with trophoblast invasion (G) and syncytialization (H) in the placentae at E10.5 from RPL + Vehicle (n = 10, 2 placentae/dam) and RPL + rhM-CSF (n = 10, 2 placentae/dam) groups. Data are presented as mean ± SEM. Data in panels C and D are from three independent experiments. Statistical analyses are performed by one-way ANOVA with Fisher's LSD post-hoc test for panels C and D, unpaired Student's t-test for panels E and F, and multiple t-test for panels G and H. *, P < 0.05; **, P < 0.01.

Similar articles

Cited by

References

    1. Erlebacher A. Immunology of the maternal-fetal interface. Annu Rev Immunol 2013; 31: 387–411.10.1146/annurev-immunol-032712-100003 - DOI - PubMed
    1. Rai R, Regan L. Recurrent miscarriage. Lancet North Am Ed 2006; 368: 601–11.10.1016/s0140-6736(06)69204-0 - DOI - PubMed
    1. Quenby S, Gallos ID, Dhillon-Smith RK et al. Miscarriage matters: the epidemiological, physical, psychological, and economic costs of early pregnancy loss. Lancet 2021; 397: 1658–67.10.1016/S0140-6736(21)00682-6 - DOI - PubMed
    1. Strobel L, Vomstein K, Kyvelidou C et al. Different background: natural killer cell profiles in secondary versus primary recurrent pregnancy loss. J Clin Med 2021; 10: 194.10.3390/jcm10020194 - DOI - PMC - PubMed
    1. Koopman LA, Kopcow HD, Rybalov B et al. Human decidual natural killer cells are a unique NK cell subset with immunomodulatory potential. J Exp Med 2003; 198: 1201–12.10.1084/jem.20030305 - DOI - PMC - PubMed