. 2024 Jun 20:12:1429759.
doi: 10.3389/fcell.2024.1429759. eCollection 2024.

Aberrant evoked calcium signaling and nAChR cluster morphology in a SOD1 D90A hiPSC-derived neuromuscular model

Affiliations

Aberrant evoked calcium signaling and nAChR cluster morphology in a SOD1 D90A hiPSC-derived neuromuscular model

Nathalie Couturier et al. Front Cell Dev Biol. .

Abstract

Familial amyotrophic lateral sclerosis (ALS) is a progressive neuromuscular disorder that is due to mutations in one of several target genes, including SOD1. So far, clinical records, rodent studies, and in vitro models have yielded arguments for either a primary motor neuron disease, or a pleiotropic pathogenesis of ALS. While mouse models lack the human origin, in vitro models using human induced pluripotent stem cells (hiPSC) have been recently developed for addressing ALS pathogenesis. In spite of improvements regarding the generation of muscle cells from hiPSC, the degree of maturation of muscle cells resulting from these protocols has remained limited. To fill these shortcomings, we here present a new protocol for an enhanced myotube differentiation from hiPSC with the option of further maturation upon coculture with hiPSC-derived motor neurons. The described model is the first to yield a combination of key myogenic maturation features that are consistent sarcomeric organization in association with complex nAChR clusters in myotubes derived from control hiPSC. In this model, myotubes derived from hiPSC carrying the SOD1 D90A mutation had reduced expression of myogenic markers, lack of sarcomeres, morphologically different nAChR clusters, and an altered nAChR-dependent Ca2+ response compared to control myotubes. Notably, trophic support provided by control hiPSC-derived motor neurons reduced nAChR cluster differences between control and SOD1 D90A myotubes. In summary, a novel hiPSC-derived neuromuscular model yields evidence for both muscle-intrinsic and nerve-dependent aspects of neuromuscular dysfunction in SOD1-based ALS.

Keywords: acetylcholine receptors; amyotrophic lateral sclerosis; hiPSC; motor neurons; myogenesis; neuromuscular junction; skeletal muscle cells; stem cells.


Conflict of interest statement

The authors declare that the research was conducted in the absence of any commercial or financial relationships that could be construed as a potential conflict of interest.

Figures
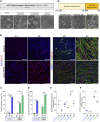
FIGURE 1
FIGURE 1
Evolution of marker protein expression along terminal myogenesis indicates differentiation of skeletal myotubes from hiPSC. hiPSC were determined and further differentiated for up to 60 days. (A-A′) Upper panels: schematic protocol timeline for hiPSC determination towards skeletal myogenic fate (A) and hiPSC-derived myoblast terminal differentiation (A′). Lower panels: representative brightfield images of cell populations at various determination and differentiation timepoints. Presomitic mesoderm cells, premyogenic progenitors and mixed cell population consisting of myoblasts and myotubes were imaged at d-45, d-40 and d-22, respectively. hiPSC-derived myoblasts were obtained after 50 days of hiPSC determination (A) and were further induced to terminally differentiate into myotubes after 6 days of proliferation and 4 days of differentiation in N2-based medium (A′). Scale bars, 100 µm. (B–F) hiPSC-derived myoblasts were differentiated according to the protocol shown in A-A′, fixed at different timepoints, and immunostained for myogenic markers. Skeletal muscle cells were derived from control and SOD1 D90A mutant hiPSC lines. (B) Representative confocal images of samples immunostained for myogenin (MyoG) and myosin heavy chain (MYH1) at timepoints as indicated. Scale bars, 100 µm. (C,D) Quantification of the percentage of MyoG positive nuclei (C) and of percentage of nuclei within MYH1 positive cells (differentiation index; D) as a function of differentiation time. Graphs depict mean ± SD. (E,F) Quantification of MyoG (E) and MYH1 (F) mean fluorescence intensity of positive cells. At least three biological replicates were analyzed per condition. *p < 0.05, **p < 0.01, ***p < 0.001, ****p < 0.0001.
FIGURE 2
FIGURE 2
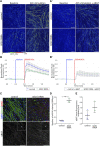
Control and SOD1 D90A mutant hiPSC-derived myotubes show differential nAChR-dependent Ca2+ responses. (A,B′) hiPSC-derived myotube cultures differentiated for 50 + 4 days were subjected to Fluo4-mediated Ca2+ imaging in the presence of acetylcholine [ACh; (500 nM0)] ± α-bungarotoxin [αBGT; (3 μg/mL)]. (A) Representative confocal pseudocolored images for all conditions at baseline (left panels) and peak upon ACh (right panels). Myotubes were stimulated with ACh either directly (A) or after pre-treatment with αBGT (A′). The pseudocolor scale bar shows the color distribution corresponding to Fluo4 fluorescence ratios. Blue and green-red cues indicate low and high values of Fluo4 fluorescence, respectively. Scale bars, 100 µm. (B-B′) ΔF/F0 Fluo4 kinetics for control and SOD1 D90A mutant myotubes upon ACh stimulation, without (B) and with (B′) αBGT pre-treatment. Fluo4 fluorescence was normalized to corresponding baseline values. Curves depict mean ± SE of at least three biological replicates. (C) Representative confocal images of control and mutant myotubes showing fluorescence signals of nuclei (blue), αBGT-stained nAChR clusters (red), and MYH1 (green). Inserts in right panels depict higher zooms of nAChR clusters. Scale bars, 100 µm. (D,E) Quantification of nAChR clusters per 1000 µm2 of myotubes (D) and of αBGT integrated density (E) in control and mutant conditions. n = 3 independent experiments. **p < 0.01.
FIGURE 3
FIGURE 3
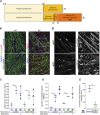
Optimized culture conditions enhance myotube maturation and highlight a lack of marker expression and sarcomeric organization in SOD1 D90A myotubes. Myoblasts were expanded for 6 days (d-6 to d0) and then further differentiated for 4 or 8 days (d0 to d4/d8). In some conditions, maturating myotubes were cocultured with control iMN, as indicated. (A) Comparison of protocols and timelines leading to newly differentiated myotubes (d4-protocol) and more mature myotubes (d8-protocol). (B) Representative confocal fluorescence images of control and SOD1 D90A mutant myotubes as obtained with the d4 and d8 protocols (indicated) in the absence of iMN. Fluorescence signals show nuclei (blue), αBGT-stained nAChR clusters (red), and MYH1 or α-actinin (green). Scale bars, 100 µm. Dashed rectangles outline higher magnification areas shown in B’. (B′) Gray-scaled zooms of αBGT and α-actinin staining in d8-differentiated control and mutant myotubes are shown. Scale bars, 50 µm. Inserts in right panels depict higher zooms of individual myotube striations. (C–E) Quantification of myonuclear domain area (C), nAChR clusters per 1000 µm2 of muscle cell area (D) and α-actinin mean fluorescence intensity (E) comparing d4 and d8 myotubes in mono- (-iMN) and co-culture with control iMN ( + iMN). Graphs depict mean ± SD and were generated from data obtained from at least three individual experiments. *p < 0.05, **p < 0.01, ***p < 0.001, ****p < 0.0001.
FIGURE 4
FIGURE 4
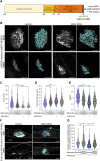
Differences in morphological parameters and stability of nAChR clusters between control and SOD1 D90A mutant myotubes are reduced upon coculture with control iMN. Myoblasts were expanded for 6 days (d-6 to d0) and then further differentiated for 8 days (d0 to d8). In some conditions, maturating myotubes were cocultured with control iMN, as indicated. At d7 and d8, αBGT-AF488 and αBGT-AF647, respectively, were added to live cultures for 15 min. Then, samples were washed, fixed, and visualized with confocal microscopy. (A) Schematic protocol timeline to assess nAChR cluster turnover through a sequential αBGT living cells staining. (B) Gray-scaled pictures of αBGT-AF647-stained nAChR clusters (left panels) and their corresponding segmentation masks obtained by thresholding-based segmentation in ImageJ for all conditions (right panels). Scale bars, 5 µm. (C–E) Quantification of cluster area (C), perimeter/area (D), and solidity (E). Red lines, mean values for each condition. (F) Representative images of d8 control and SOD1 D90A myotubes cultured as mono- (upper panel; -iMN) or iMN co-cultures (lower panel; + iMN). Dotted lines outline myotubes. Scale bars, 5 µm. (G) Quantification of αBGT-AF488 positive puncta per 1,000 μm3 of muscle cell volume. Red lines, mean values for each condition. At least 50 nAChR clusters were analyzed per condition, and three independent experiments were performed. *p < 0.05, **p < 0.01, ***p < 0.001, ****p < 0.0001.

Similar articles

References

    1. Abrunhosa V. M., Soares C. P., Batista Possidonio A. C., Alvarenga A. V., Costa-Felix R. P. B., Costa M. L., et al. (2014). Induction of skeletal muscle differentiation in vitro by therapeutic ultrasound. Ultrasound Med. Biol. 40, 504–512. 10.1016/j.ultrasmedbio.2013.10.013 - DOI - PubMed
    1. Adler M., Manley H. A., Purcell A. L., Deshpande S. S., Hamilton T. A., Kan R. K., et al. (2004). Reduced acetylcholine receptor density, morphological remodeling, and butyrylcholinesterase activity can sustain muscle function in acetylcholinesterase knockout mice. Muscle Nerve 30, 317–327. 10.1002/mus.20099 - DOI - PubMed
    1. Afonso G. J. M., Cavaleiro C., Valero J., Mota S. I., Ferreiro E. (2023). Recent advances in extracellular vesicles in amyotrophic lateral sclerosis and emergent perspectives. Cells 12, 1763. 10.3390/cells12131763 - DOI - PMC - PubMed
    1. Aguilar-Agon K. W., Capel A. J., Martin N. R. W., Player D. J., Lewis M. P. (2019). Mechanical loading stimulates hypertrophy in tissue-engineered skeletal muscle: molecular and phenotypic responses. J. Cell. Physiol. 234, 23547–23558. 10.1002/jcp.28923 - DOI - PMC - PubMed
    1. Ahlers J., Althviz Moré D., Amsalem O., Anderson A., Bokota G., Boone P., et al. (2023). napari: a multi-dimensional image viewer for Python. Zenodo. 10.5281/zenodo.3555620 - DOI