. 2024 Sep 9;52(16):9431-9449.
doi: 10.1093/nar/gkae586.

Small RNA-mediated genetic switches coordinate ALG-3/4 small RNA pathway function

Affiliations

Small RNA-mediated genetic switches coordinate ALG-3/4 small RNA pathway function

Trilotma Sen et al. Nucleic Acids Res. .

Abstract

Coordination of gene regulatory networks is necessary for proper execution of cellular programs throughout development. RNA interference (RNAi) is an essential regulatory mechanism in all metazoans. Proper RNAi-mediated gene regulation requires coordination of several RNAi branches to ensure homeostasis. For example, in Caenorhabditis elegans, the Argonautes, ALG-3 and ALG-4, are expressed specifically during spermatogenesis (L4 stage) and bind small interfering RNAs (siRNAs) complementary to sperm-enriched genes. We find that alg-3 and alg-4 are regulated by siRNAs. Our work shows that gene switches are operated via these siRNAs to regulate the Argonautes' expression in a temporal manner. This RNAi-to-RNAi regulatory cascade is essential for coordinating ALG-3/4 pathway function, particularly during heat stress, to provide thermotolerant sperm-based fertility. This work provides insight into one regulatory motif used to maintain RNAi homeostasis, across developmental stages, despite environmental stressors. As RNAi pathways are evolutionarily conserved, other species likely use similar regulatory architectures to maintain RNAi homeostasis.


Figures

Graphical Abstract
Graphical Abstract
Figure 1.
Figure 1.
Differentially expressed genes in heat stressed mut-16 mutant L4s are enriched for sperm genes. (A) Box plots depicting mRNA expression change for published enriched gene sets, in log2(fold change), for comparisons between wild-type L4 hermaphrodites cultured at 20ºC and 25ºC (gray), wild-type and mut-16 mutant L4 hermaphrodites cultured at 20ºC (green), and mut-16 mutant L4 hermaphrodites cultured at 20ºC and 25ºC (blue). Notches indicate the 95% confidence interval of the median, bolded midline indicates median value, box indicates the first and third quartiles, and whiskers represented the most extreme data points within 1.5 times the interquartile range, excluding outliers. Wilcoxon tests were performed to determine statistical significance between the log2(fold change) upon heat stress in wild-type L4s compared to the log2(fold change) due to the mut-16 mutation and due to the mut-16 mutation at 25°C, and p values were adjusted for multiple comparisons. (B) Percentage of gonad-specific and non-gonad-specific genes represented in the genes down-regulated exclusively in mut-16 mutant L4s at 25°C. (C) Enrichment analysis for spermatogenesis, oogenesis, sex-neutral genes, and muscle-specific and neuronal-specific genes amongst the genes down-regulated during heat stress in mut-16 mutants. Two-tailed p values for enrichment or depletion were calculated using the Fisher's exact test function in R. -INF indicates there were no down-regulated genes overlapping with the gene list. (D) Tissue enrichment analysis was performed using WormExp (log10Q ≥ 2 and FDR < 0.05) for genes down-regulated exclusively in mut-16 mutants at 25°C. (E) mRNA transcripts mapping to spermatogenesis-enriched genes are counted, in reads per million (RPMs), for wild-type and mut-16 mutant L4 animals cultured at 20°C and 25°C. (F) Shown is difference in expression (log2(fold change)) for genes in mut-16 mutants at 25ºC compared to mut-16 mutants at 20ºC plotted according to the average abundance of normalized reads (in transcripts per million (TPMs)) in libraries from mut-16 mutant L4 hermaphrodites grown at 25ºC. Each dot represents a gene, with sperm-enriched genes highlighted in blue, oogenesis-enriched genes highlighted in pink, sex-neutral germline genes highlighted in yellow, and muscle and neuronal genes highlighted in green. (G) 22G-RNAs mapping to spermatogenesis-enriched genes are counted, in reads per million (RPMs), for wild-type and mut-16 mutant L4 hermaphrodites cultured at 20°C and 25°C. (A–G) For each genotype and condition, two biological replicates were sequenced. (E, G) Bar graphs represent the mean with dots representing summed RPMs for biological replicates and error bars indicating standard deviation. Two-tailed Welch's t-tests were performed to determine statistical significance. (A, C, E, G) n.s. denotes not significant and indicates a P-value > 0.05, * indicates a P-value ≤ 0.05, ** indicates a P-value ≤ 0.01, *** indicates a P-value ≤ 0.001, and **** indicates a P-value ≤ 0.0001.
Figure 2.
Figure 2.
ALG-3/4 pathway targets are enriched amongst genes down-regulated in heat stressed mut-16 mutant L4s. (A) Enrichment analysis for ALG-3/4, ERGO-1, CSR-1 and piRNA pathway targets amongst the genes down-regulated during heat stress in mut-16 mutants is shown. Two-tailed p values for enrichment or depletion were calculated using the Fisher's exact test function in R. -INF indicates there were no down-regulated genes overlapping with the gene list. (B) Comparison of expression changes in wild-type L4s cultured at 20ºC compared to wild-type L4s cultured at 25ºC (gray), wild-type L4s cultured at 20ºC compared to mut-16 mutant L4s cultured at 20ºC (green), and mut-16 mutant L4s cultured at 20ºC compared to mut-16 mutant L4s cultured at 25ºC (blue) for published ALG-3/4 pathway and CSR-1 pathway target gene lists. Notches indicate the 95% confidence interval of the median, bolded midline indicates median value, box indicates the first and third quartiles, and whiskers represented the most extreme data points within 1.5 times the interquartile range, excluding outliers. Wilcoxon tests were performed to determine statistical significance between the log2(fold change) upon heat stress in wild-type L4s compared to the log2(fold change) due to the mut-16 mutation and due to the mut-16 mutation at 25°C, and P values were adjusted for multiple comparisons. (C) Shown is difference in expression (log2(fold change)) for genes in mut-16 mutants at 25ºC compared to mut-16 mutants at 20ºC plotted according to the average abundance of normalized reads (in transcripts per million (TPMs)) in libraries from mut-16 mutant L4 hermaphrodites grown at 25ºC. Each dot represents a gene, with negatively regulated ALG-3/4 pathway targets (green), positively regulated ALG-3/4 pathway targets (blue), and other ALG-3/4 pathway targets (gold) highlighted. (D) 22G-RNAs mapping to CSR-1 pathway target genes, (E) 22G-RNAs mapping to negatively regulated, positively regulated, and other ALG-3/4 pathway target genes, and (F) 26G-RNAs mapping to negatively regulated, positively regulated, and other ALG-3/4 pathway target genes are counted, in reads per million (RPMs), for wild-type and mut-16 mutant L4 hermaphrodites cultured at 20°C and 25°C. (A–F) For each genotype and condition, two biological replicates were sequenced. (D–F) Bar graphs represent the mean with dots representing summed RPMs for biological replicates and error bars indicating standard deviation. Two-tailed Welch's t-tests were performed to determine statistical significance. n.s. denotes not significant and indicates a P-value > 0.05, * indicates a P-value ≤ 0.05, ** indicates a P-value ≤ 0.01, *** indicates a P-value ≤ 0.001 and **** indicates a P-value ≤ 0.0001.
Figure 3.
Figure 3.
Mutator complex-dependent small RNAs are required for alg-3 and alg-4 expression during heat stress in L4s. (A) Strip plot showing the change in expression of ALG-3/4 pathway factors. Circles represent the log2(fold change) for each gene, as determined by DESeq2, for comparisons between wild-type L4 hermaphrodites cultured at 20ºC and 25ºC (gray) and mut-16 mutant L4 hermaphrodites cultured at 20ºC and 25ºC (blue). Filled circles indicate a significant p value as determined by DESeq2 (P-value ≤ 0.05). (B) qRT-PCR assay of alg-3 and alg-4 expression, normalized to rpl-32 expression, in mut-16 mutant L4 hermaphrodites cultured at 25ºC normalized to expression levels in mut-16 mutant L4 hermaphrodites cultured at 20ºC. n = 3 biological replicates. (C) Total small RNA reads per million (RPMs) mapping to alg-3 and alg-4 in wild-type and mut-16 mutant L4 hermaphrodites cultured at 20°C and 25°C. (D) Shown is the percentage of 22-nt and 26-nt reads mapping to alg-3 and alg-4 with A, T, C or G represented in the first position of the read in wild-type L4 animals cultured at 20ºC. (E) Shown are size profiles of all reads mapping to the alg-3 genomic locus in wild-type and mut-16 mutant L4 animals cultured at 20°C and 25°C. (F) Shown are size profiles of all reads mapping to the alg-4 genomic locus in wild-type and mut-16 mutant L4 animals cultured at 20°C and 25°C. (A–F) For each genotype and condition, two biological replicates were sequenced. (B, C, E, F) Bar graphs represent the mean with dots representing each biological replicate and error bars indicating standard deviation. For (B, C) two-tailed student t-tests were performed to determine statistical significance. n.s. denotes not significant and indicates a P-value > 0.05, * indicates a P-value ≤ 0.05 and ** indicates a P-value ≤ 0.01.
Figure 4.
Figure 4.
alg-3 and alg-4 expression is developmentally dysregulated in heat stressed mut-16 mutants. Bar graphs depicting mRNA transcripts mapping to (A) alg-3 and (B) alg-4, normalized to the expression level of rpl-32, in reads per million (RPMs), for L4 and adult wild-type and mut-16 mutant hermaphrodites cultured at 20°C and 25°C.(A, B) Bar graphs represent the mean with dots representing summed RPMs for biological replicates and error bars indicating standard deviation. (C) Representative fluorescence microscopy images of germline nuclei from the proximal end of gonads of L4 and young adult stage animals expressing GFP::3XFLAG::ALG-3 or GFP::3XFLAG::ALG-4 in the wild-type and mut-16 mutant background grown at 25ºC. Scale bars indicate 10 μm. Representative western blots for (D) GFP::3XFLAG::ALG-3 and (E) GFP::3XFLAG::ALG-4 in L4 and young adult stage animals expressing GFP::3XFLAG::ALG-3 or GFP::3XFLAG::ALG-4 in the wild-type and mut-16 mutant background grown at 20ºC and 25ºC are shown. Also shown are bar graphs representing the quantification of biological replicates of the (F) GFP::3XFLAG::ALG-3 and (G) GFP::3XFLAG::ALG-4 western blots. (A, B) For each genotype and condition, two biological replicates were sequenced for L4-stage animals and three biological replicates were sequenced for adult-stage animals. (D–G) For each genotype, development stage, and condition, n = 3. (F, G) Bar graphs represent the mean with dots representing the relative density for biological replicates and error bars indicating standard deviation. For (A, B, F, G) one-tailed student t-tests were performed to determine statistical significance. n.s. denotes not significant and indicates a P-value > 0.05, * indicates a P-value ≤ 0.05, ** indicates a P-value ≤ 0.01, *** indicates a P-value ≤ 0.001, and **** indicates a P-value ≤ 0.0001.
Figure 5.
Figure 5.
Sperm-enriched genes are developmentally dysregulated in heat stressed mut-16 mutants. Bar graphs depicting mRNA transcripts mapping to (A) spermatogenesis-enriched genes and (B) oogenesis genes, normalized to the expression level of rpl-32, in reads per million (RPMs), for L4 and adult wild-type and mut-16 mutant hermaphrodites cultured at 20°C and 25°C. Bar graphs depicting 22G-RNAs mapping to (C) spermatogenesis-enriched genes and (D) oogenesis-enriched genes, and 26G-RNAs mapping to (E) spermatogenesis-enriched genes and (F) oogenesis-enriched genes, normalized to all reads mapping to the mir-35 family, in reads per million (RPMs), for L4 and adult wild-type and mut-16 mutant hermaphrodites cultured at 20°C and 25°C. For (A–F) Bar graphs represent the mean with dots representing summed RPMs for biological replicates and error bars indicating standard deviation. For each genotype and condition, two biological replicates were sequenced for L4-stage animals and three biological replicates were sequenced for adult-stage animals. One-tailed student t-tests were performed to determine statistical significance. n.s. denotes not significant and indicates a P-value > 0.05, * indicates a P-value ≤ 0.05, ** indicates a P-value ≤ 0.01, *** indicates a P-value ≤ 0.001, and **** indicates a P-value ≤ 0.0001.
Figure 6.
Figure 6.
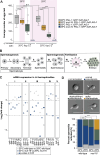
Spermiogenesis defects that trigger the onset of temperature-sensitive sperm-based sterility in mut-16 mutants. (A) Box plots depicting average number of eggs laid for fog-2(oz40) hermaphrodites cultured at 20ºC or 25ºC mated with pgl-1::GFP::3xFLAG males grown at 20ºC (gray), pgl-1::GFP::3xFLAG males grown at 25ºC (gold), mut-16(pk710); pgl-1::GFP::3xFLAG males grown at 20ºC (green), or mut-16(pk710); pgl-1::GFP::3xFLAG males grown at 25ºC (blue). Circles represent number of GFP-expressing eggs counted for individual hermaphrodites after mating. Bolded midline indicates median value, box indicates the first and third quartiles, and whiskers represented the most extreme data points within 1.5 times the interquartile range, excluding outliers. N = 10. (B) Schema of stages of sperm development critical for male reproductive potential. I) primary spermatocyte division to form secondary spermatocytes, II) spermatid formation, III) spermatid activation during spermiogenesis, IV) spermatozoa enter the oocyte during fertilization, and V) post-fertilization viability of the embryo (C) Strip plot showing the change in expression of genes essential for each stage of sperm development (corresponding to schema in B). Circles represent the log2(fold change) for each gene, as determined by DESeq2, for comparisons between wild-type L4 hermaphrodites cultured at 20ºC and 25ºC (gray) and mut-16 mutant L4 hermaphrodites cultured at 20ºC and 25ºC (blue). Filled circles indicate a significant p value as determined by DESeq2 (P-value ≤ 0.05). For each genotype and condition, two biological replicates were sequenced. (D) Shown are representative images of spermatids isolated from male adult animals after exposure to pronase E. White arrows indicate pseudopods and scale bars indicate 10 μm. Below, percent of pronase E-treated spermatids that are not activated (gray), have normal pseudopod formation (blue), atypical pseudopod formation (green), or arrest as spiky intermediates (gold) are shown for wild-type and mut-16 adult males grown at 20ºC and 25ºC. n = 200 per genotype for each condition. For (A, D) two-tailed Welch's t-tests were performed to determine statistical significance. n.s. denotes not significant and indicates a P-value > 0.05, * indicates a P-value ≤ 0.05, ** indicates a P-value ≤ 0.01, *** indicates a P-value ≤ 0.001, and **** indicates a P-value ≤ 0.0001.
Figure 7.
Figure 7.
MUT-16-dependent small RNAs are required to restrict ALG-3/4 pathway function to the L4 developmental stage. Model of the small RNA-mediated regulatory network in which MUT-16-dependent 22G-RNAs are required to counterbalance the effects of heat stress and control expression of alg-3 and alg-4 to maintain developmental stage-specific ALG-3/4 pathway (green) function that, with the CSR-1 pathway (yellow) and piRNA pathway (purple), regulates expression of spermatogenesis genes to maintain sperm-based fertility. Dashed lines with question marks indicate hypothetical regulation of alg-3 and alg-4 by different RNAi pathways.

Similar articles

References

    1. Riddle D.L., Blumenthal T., Meyer B.J., Priess J.R.. C. elegans II. 1997; Cold Spring Harbor Laboratory Press. - PubMed
    1. Klass M., Wolf N., Hirsh D.. Development of the male reproductive system and sexual transformation in the nematode Caenorhabditis elegans. Dev. Biol. 1976; 52:1–18. - PubMed
    1. Villeneuve A.M., Meyer B.J.. sdc-1: a link between sex determination and dosage compensation in C. elegans. Cell. 1987; 48:25–37. - PubMed
    1. Miller L.M., Plenefisch J.D., Casson L.P., Meyer B.J.. xol-1: a gene that controls the male modes of both sex determination and X chromosome dosage compensation in C. elegans. Cell. 1988; 55:167–183. - PubMed
    1. DeLong L., Plenefisch J.D., Klein R.D., Meyer B.J.. Feedback control of sex determination by dosage compensation revealed through Caenorhabditis elegans sdc-3 mutations. Genetics. 1993; 133:875–896. - PMC - PubMed

MeSH terms