. 2024 Jul 23;43(7):114436.
doi: 10.1016/j.celrep.2024.114436. Epub 2024 Jul 4.

Interface-guided phenotyping of coding variants in the transcription factor RUNX1

Affiliations

Interface-guided phenotyping of coding variants in the transcription factor RUNX1

Kivilcim Ozturk et al. Cell Rep. .

Abstract

Single-gene missense mutations remain challenging to interpret. Here, we deploy scalable functional screening by sequencing (SEUSS), a Perturb-seq method, to generate mutations at protein interfaces of RUNX1 and quantify their effect on activities of downstream cellular programs. We evaluate single-cell RNA profiles of 115 mutations in myelogenous leukemia cells and categorize them into three functionally distinct groups, wild-type (WT)-like, loss-of-function (LoF)-like, and hypomorphic, that we validate in orthogonal assays. LoF-like variants dominate the DNA-binding site and are recurrent in cancer; however, recurrence alone does not predict functional impact. Hypomorphic variants share characteristics with LoF-like but favor protein interactions, promoting gene expression indicative of nerve growth factor (NGF) response and cytokine recruitment of neutrophils. Accessible DNA near differentially expressed genes frequently contains RUNX1-binding motifs. Finally, we reclassify 16 variants of uncertain significance and train a classifier to predict 103 more. Our work demonstrates the potential of targeting protein interactions to better define the landscape of phenotypes reachable by missense mutations.

Keywords: CP: Genomics; CP: Molecular biology; Perturb-seq; RNA-seq; cancer; coding variant; interface; protein-protein interaction; single-cell; transcription factor.


Conflict of interest statement

Declaration of interests P.M. is a scientific co-founder of Shape Therapeutics, Navega Therapeutics, Boundless Biosciences, and Engine Biosciences. The terms of these arrangements have been reviewed and approved by the University of California, San Diego in accordance with its conflict-of-interest policies.

Figures

Figure 1.
Figure 1.. Interface-guided Perturb-seq assay for coding variant phenotyping of RUNX1
(A) The 3D crystal structure of transcription factor CBF, consisting of RUNX1 Runt domain (purple) and CBFB (blue), interacting with DNA (yellow and pink strands) (PDB: 1h9d). (B) Amino acid residue map of RUNX1 Runt domain (columns). In each row, RUNX1 interface residues involved in interaction with each protein partner (rows) are highlighted by black. Rows are hierarchically clustered. Top: residue 3D location annotations (core, intermediate, surface), VEST and FoldX scores of the most damaging mutations targeting each residue. Color darkness indicates mutation impact: damaging (VEST) or destabilizing (FoldX). (C) Lentiviral ORF vector containing RUNX1 variant (WT, mutated, or GFP) and 12-bp variant-specific barcode sequence. (D) Experimental and computational overview: ORF variant library design, transduction, scRNA-seq of all 117 library elements, bulk RNA-seq, and ATAC-seq of 12 selected elements; computational analysis.
Figure 2.
Figure 2.. Unsupervised analysis of RUNX1 variant transcriptional effects informs WT-like, LoF-like, and hypomorphic variants
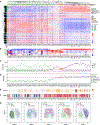
(A and B) UMAP embedding of single cells, colored by (A) unsupervised clusters and (B) variant classes. Cell-cycle effects are regressed out. (C and D) UMAP embedding of variants, constructed from mean expression across cells, colored by (C) unsupervised clusters and (D) variant classes. (E and F) UMAP embedding of (E) variants or (F) single cells carrying those variants, colored by variant functional designations (phenotype: WT-like, LoF-like, or hypomorphic) for unsupervised clusters in (C). (G) Enrichment of single cells with assigned phenotypes from (F) for unsupervised clusters in (A). Positive and negative values indicate enrichment and depletion, respectively. (H) Variant T2 scores when compared to WT (x axis) or LoF (y axis) controls. (I) Variant fitness scores from 2 biological replicates (R1: replicate 1, R2: replicate 2; Pearson’s r = 0.94, p = 5.3e-55).
Figure 3.
Figure 3.. Mapping phenotypic consequences of RUNX1 variants with transcriptomic analysis
(A) Hierarchical clustering of variants (columns: 5 clusters) by mean expression profiles of top 2,000 variable genes (rows: 10 clusters). Variant dendrogram leaves are ordered by increasing T2WT scores. Gene expression values are Z scored. (B) Top 5 PCs of variants. Rows are scaled to have a mean of zero and unit variance. (C) Variant T2 scores when compared to the WT (circle) or LoF (cross) control, colored by phenotypes. Dotted line equals 178.79, median of T2WT scores for all WT-like and LoF-like variants. (D) Variant mean fitness scores. (E and F) Variant (E) FoldX and (F) VEST scores. Variants that could not be scored (WT and LoF controls, or combination mutations) are grayed out and marked with an X. (G) Kernel density estimates comparing UMAP embedding of single cells belonging to each assigned phenotype (density lines) and to cells overexpressing the WT (green shade) or LoF controls (purple shade).
Figure 4.
Figure 4.. Mapping oncogenic variants onto the RUNX1 regulatory landscape
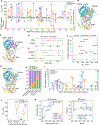
(A) Sequence-based phenotypic profiling of 79 RUNX1 perturbation variants. Top: variant T2WT scores; bottom: mutation frequency in cancer (COSMIC) (log2 scaled). (B, C, and G) Structure-based phenotypic profiling of RUNX1 perturbation variants. The 3D crystal structure of transcription factor CBF, consisting of RUNX1 Runt domain (gray) and CBFB (blue), interacting with DNA (yellow and pink strands) (PDB: 1h9d). Amino acid residues corresponding to (B) all 79 perturbation variants and (C) variants targeting DNA (red) or CBFB interaction (purple), or (G) observed in cancer (COSMIC), colored by phenotypic designations. The 4 most frequent mutations are annotated. (D and E) ORs with 95% confidence intervals. Enrichment of WT-like vs. functional (LoF-like or hypomorphic) impact variants (D) for DNA- or CBFB-binding residues, or (E) in cancer vs. non-cancer genome databases. OR >1 indicates enrichment for functional variants, while OR <1 means depletion (*p < 0.05, **p < 0.001). (F) T2WT scores vs. mutation frequency (log2 scaled) of library variants present in cancer (COSMIC). (H) Percent distribution of variant phenotypic annotations across tumors observed in different primary tissues. Sample size for each tissue is displayed on top. The 4 most frequent tissue types are shown. (I) Frequency of mutations in MLL overlapping variants in the RUNX1 library (log2 scaled). (J) T2WT scores of germline variants, grouped according to clinical significance and colored by variant phenotypic annotations. (K) Performance of “RUNX1-model” classifier vs. VEST and FoldX, summarized by the AUROC and AUPR scores.
Figure 5.
Figure 5.. Bulk RNA-seq, ATAC-seq, and western blot analysis of 12 validation variants
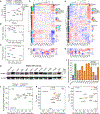
(A) Overview of validation variants: T2WT and fitness scores (from scRNA-seq analysis), and mutation frequency in cancer (COSMIC). (B and C) PCA of variants, in bulk (B) RNA-seq (using top 2,000 variable genes of scRNA-seq analysis) or (C) ATAC-seq using top 500 variable peaks. Gene expression and DNA accessibility are averaged across replicates. (D and E) Unsupervised hierarchical clustering of variants (columns) and (D) genes (rows) in bulk RNA, or (E) peaks (rows) in ATAC-seq. Gene expression and DNA accessibility are averaged across replicates and mean centered. Leaves of variant dendrograms are ordered by increasing T2WT scores. (F and G) Top 5 PCs of variants based on mean (F) gene expression or (G) DNA accessibility across replicates. Rows are Z scored. (H) Western blot quantifying RUNX1 protein levels in K562 cells transduced with a validation variant (columns), with β-actin acting as a loading control. Here, endogenous RUNX1 was not knocked down; therefore, the GFP/LoF construct represents endogenous RUNX1 expression. (I) Variant protein expression normalized to β-actin control and to endogenous RUNX1 levels captured by the GFP/LoF construct (dashed line). (J) Variant distribution of normalized RUNX1 RNA vs. protein expression (Pearson’s r = 0.13, p = 0.69). (K and L) Variant distribution of T2WT scores vs. normalized RUNX1 (K) RNA (Pearson’s r = 0.26, p = 0.41), or (L) protein expression (Pearson’s r = −0.62, p = 0.032).
Figure 6.
Figure 6.. Regulatory consequences of hypomorphic RUNX1 variants
(A and B) Hierarchical clustering of variants (columns) in bulk RNA-seq for genes (rows) with ATAC peaks and RUNX1 motifs in their promoters that are (A) upregulated (n = 63) or (B) downregulated (n = 27) in at least 1 hypomorphic variant against both WT and LoF controls. Gene expression is averaged across replicates and Z scored. (C and D) Overrepresentation of Reactome pathways for genes in (A) and (B), respectively. Top 10 pathways, ordered by p values, are displayed. (E–G) RNA-seq and ATAC-seq tracks of 3 example genes demonstrating distinct hypomorphic effects: (E) PTPN22 shows partial LoF, while (F) CXCL2 and (G) FGFR1 display gain of function or LoF against both WT and LoF. Tracks are displayed for WT and LoF controls along with the hypomorphic G100V variant. ATAC peaks are annotated with ChromHMM states, with asterisks indicating RUNX motifs. Gene exons and UTRs are represented with blue and gray bands.

Update of

Similar articles

Cited by

References

    1. Vogelstein B, Papadopoulos N, Velculescu VE, Zhou S, Diaz LA, and Kinzler KW (2013). Cancer Genome Landscapes. Science 339, 1546–1558. 10.1126/science.1235122. - DOI - PMC - PubMed
    1. Stratton MR, Campbell PJ, and Futreal PA (2009). The cancer genome. Nature 458, 719–724. 10.1038/nature07943. - DOI - PMC - PubMed
    1. Weinstein JN, Collisson EA, Mills GB, Shaw KRM, Ozenberger BA, Ellrott K, Shmulevich I, Sander C, Stuart JM, and Stuart JM (2013). The Cancer Genome Atlas Pan-Cancer analysis project. Nat. Genet. 45, 1113–1120. 10.1038/ng.2764. - DOI - PMC - PubMed
    1. Garraway LA, and Lander ES (2013). Lessons from the Cancer Genome. Cell 153, 17–37. 10.1016/j.cell.2013.03.002. - DOI - PubMed
    1. Roock WD, De Roock W, Jonker DJ, Di Nicolantonio F, Sartore-Bianchi A, Tu D, Siena S, Lamba S, Arena S, Frattini M, et al. (2010). Association of KRAS p.G13D Mutation With Outcome in Patients With Chemotherapy-Refractory Metastatic Colorectal Cancer Treated With Cetuximab. JAMA 304, 1812–1820. 10.1001/jama.2010.1535. - DOI - PubMed

Substances