. 2024 Jul 23;43(7):114423.
doi: 10.1016/j.celrep.2024.114423. Epub 2024 Jul 4.

Competition and synergy of Arp2/3 and formins in nucleating actin waves

Affiliations

Competition and synergy of Arp2/3 and formins in nucleating actin waves

Xiang Le Chua et al. Cell Rep. .

Abstract

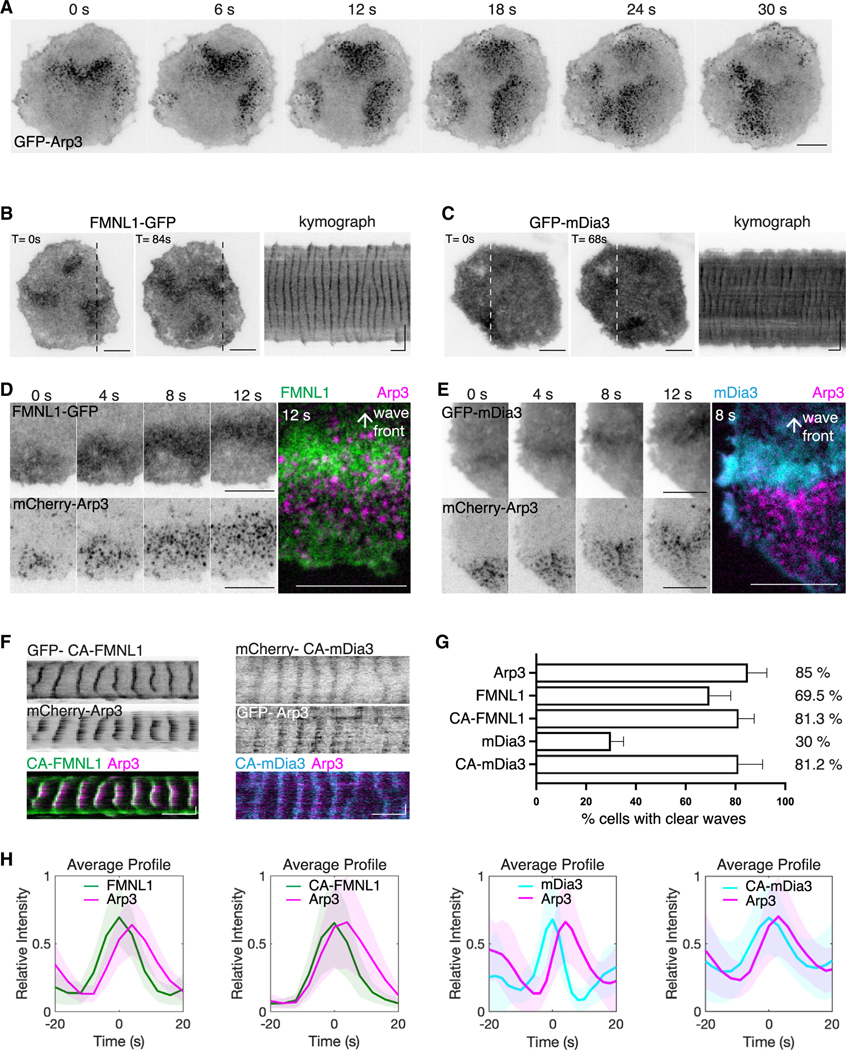
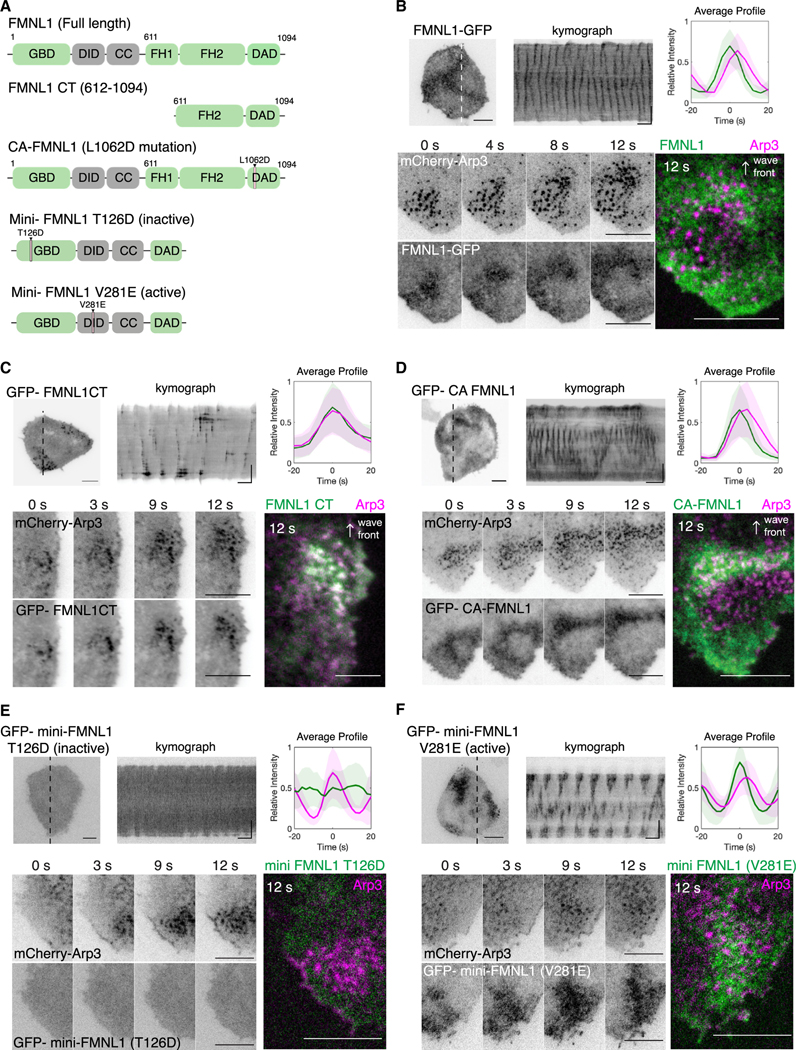
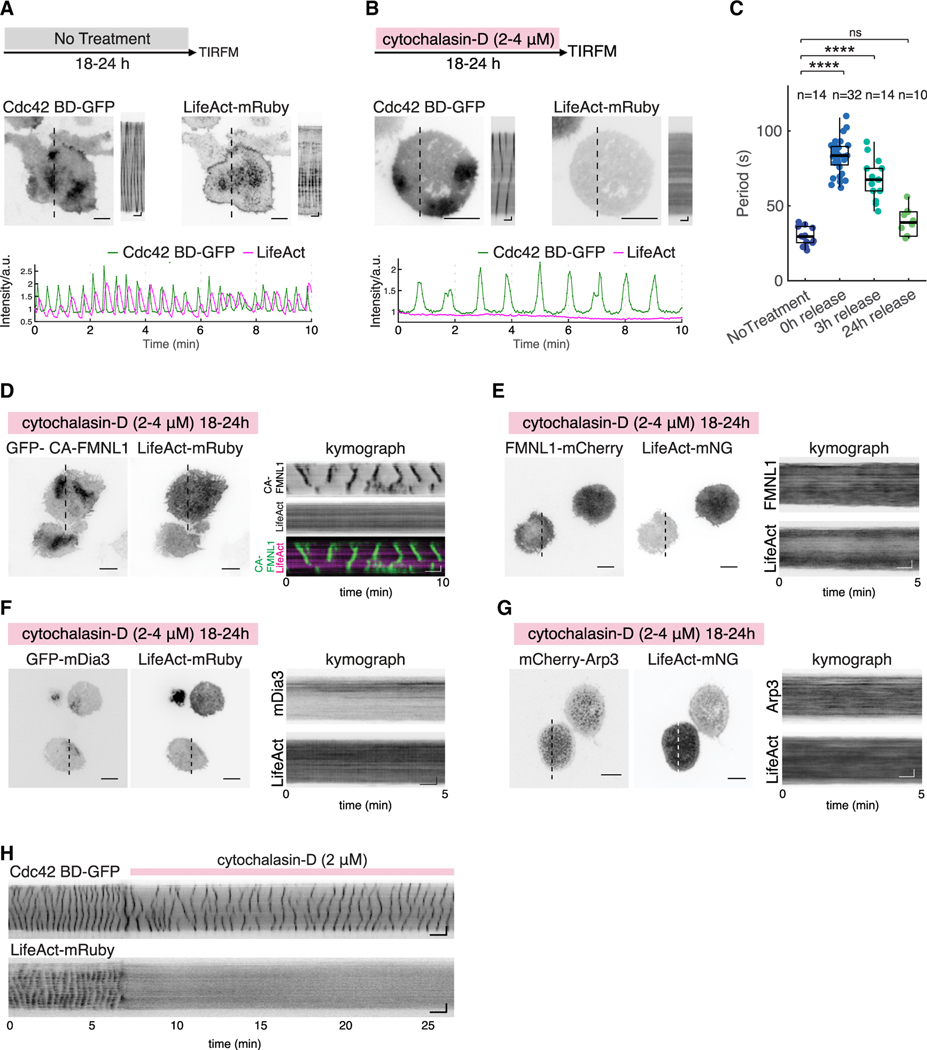
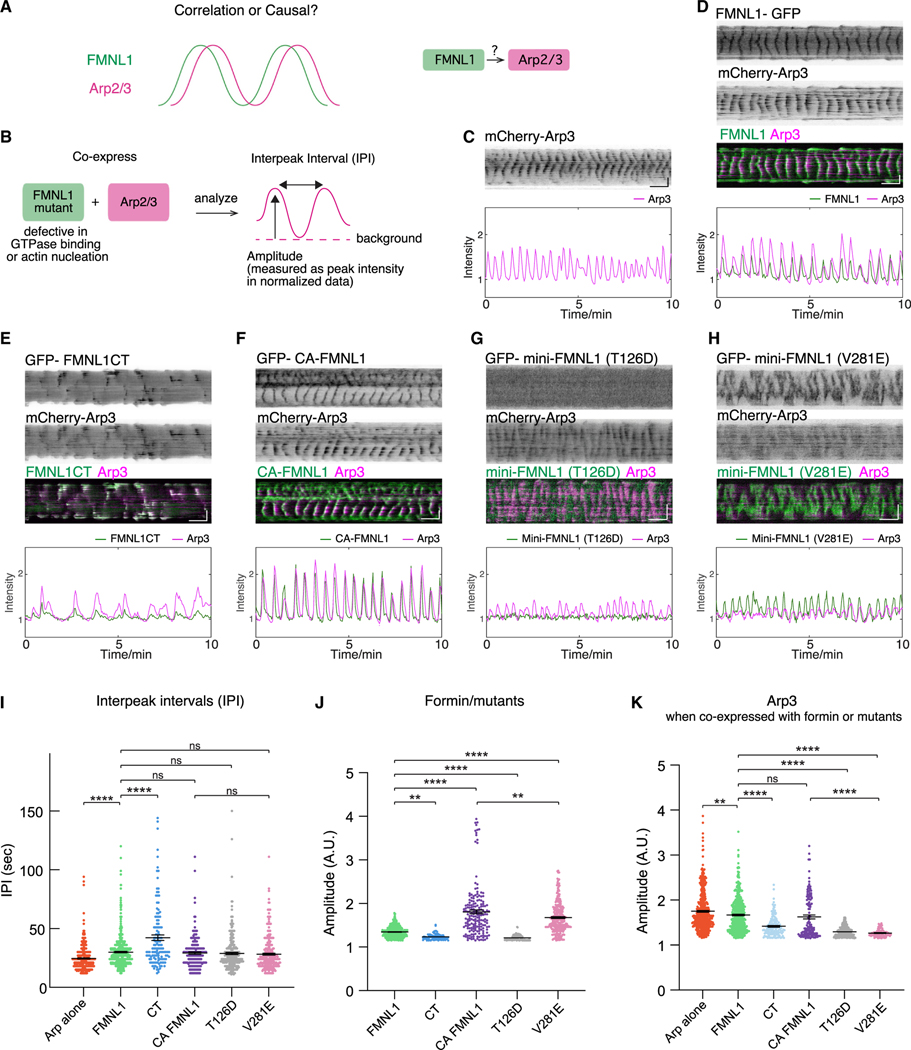
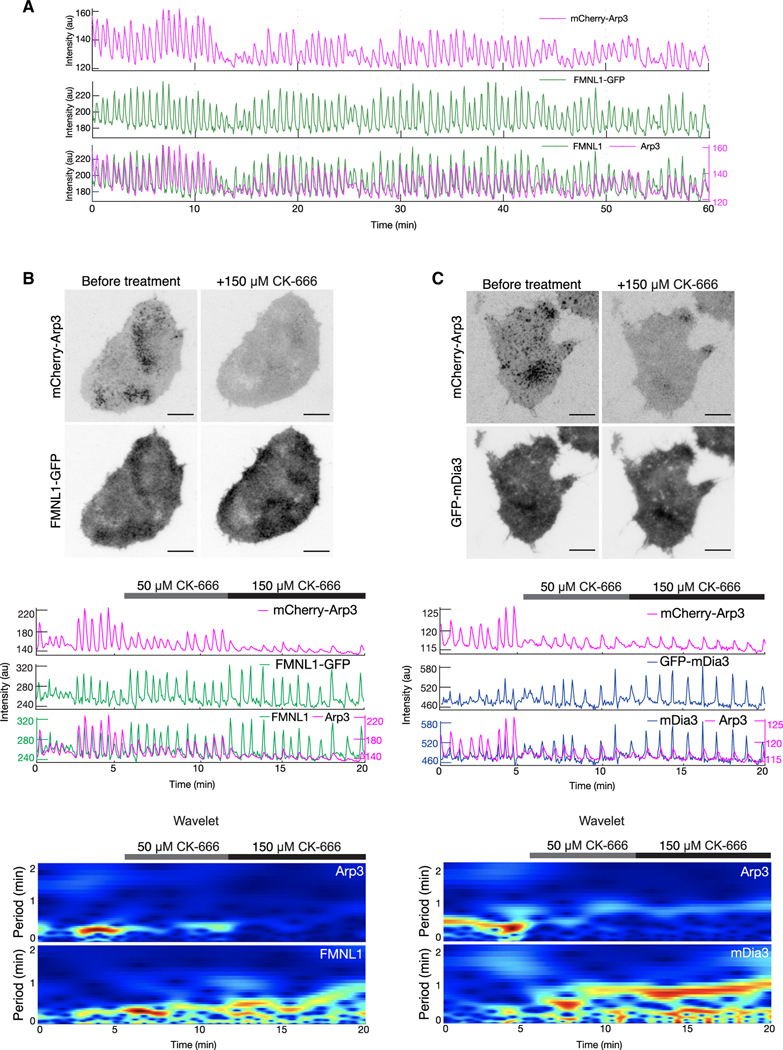
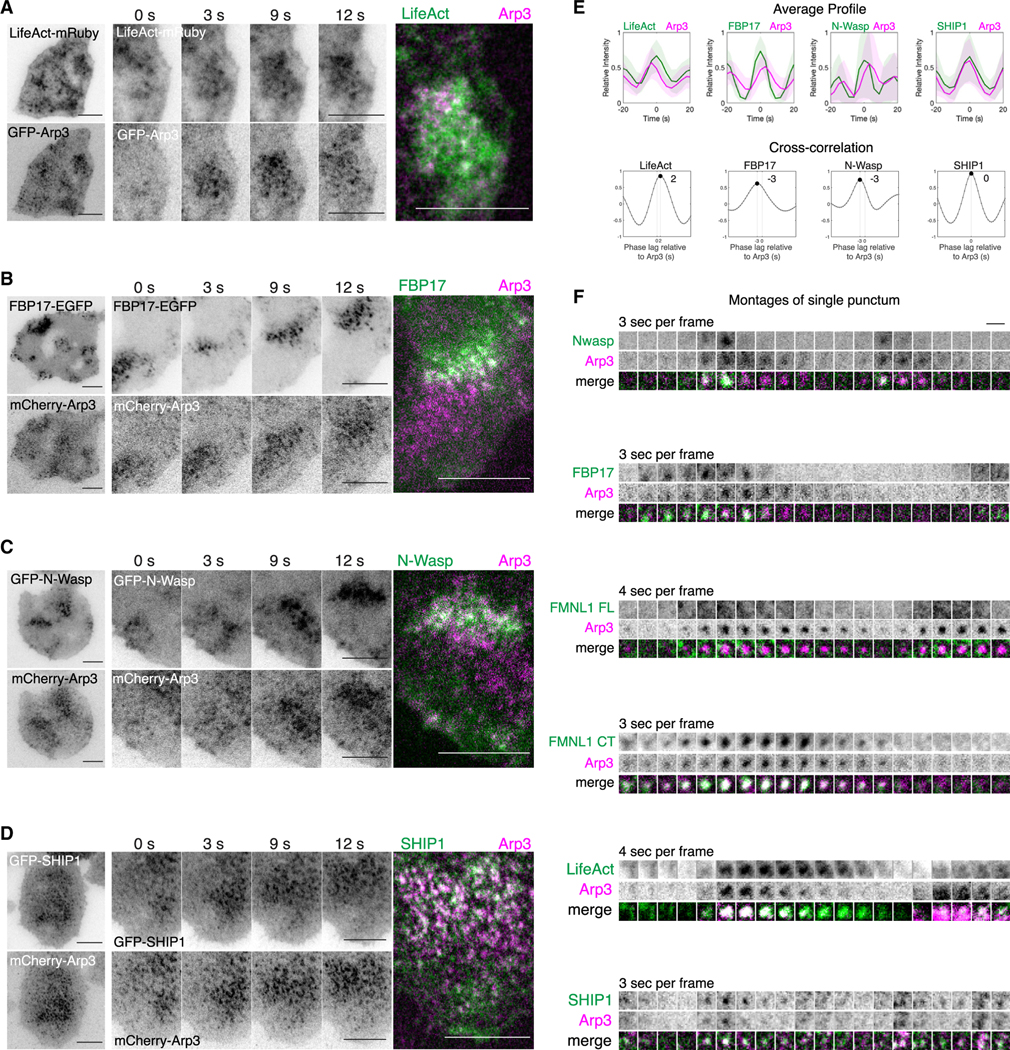
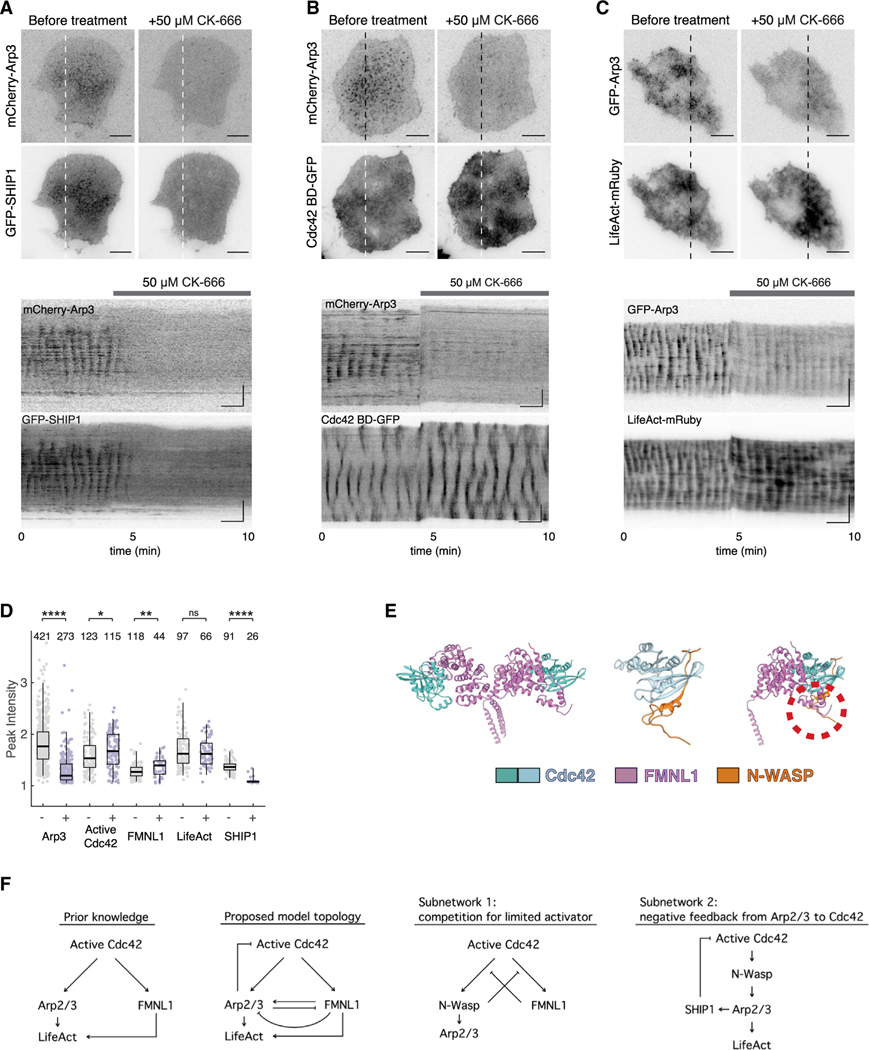
Actin assembly and dynamics are crucial for maintaining cell structure and changing physiological states. The broad impact of actin on various cellular processes makes it challenging to dissect the specific role of actin regulatory proteins. Using actin waves that propagate on the cortex of mast cells as a model, we discovered that formins (FMNL1 and mDia3) are recruited before the Arp2/3 complex in actin waves. GTPase Cdc42 interactions drive FMNL1 oscillations, with active Cdc42 and the constitutively active mutant of FMNL1 capable of forming waves on the plasma membrane independently of actin waves. Additionally, the delayed recruitment of Arp2/3 antagonizes FMNL1 and active Cdc42. This antagonism is not due to competition for monomeric actin but rather for their common upstream regulator, active Cdc42, whose levels are negatively regulated by Arp2/3 via SHIP1 recruitment. Collectively, our study highlights the complex feedback loops in the dynamic control of the actin cytoskeletal network.

Keywords: CP: Cell biology; actin waves; dynamical systems; limited pool model.


Conflict of interest statement

Declaration of interests The authors declare no competing interests.

Figures

Figure 1.
Figure 1.. Localization of Arp3, FMNL1, and mDia3 in cortical traveling waves
(A) Representative TIRFM time-lapse montage of 6 frames (6-s interval) of a cell expressing GFP-Arp3. (B and C) Representative micrographs and kymographs of a cell expressing FMNL1-GFP (B) or GFP-mDia3 (C). (D and E) Sequential montage of 4 frames (4-s interval) of a region of a representative cell co-expressing FMNL1-GFP and mCherry-Arp3 (D), or GFP-mDia3 and mCherry-Arp3 (E), followed by a 2-color merge micrograph. (F) Representative kymographs of a cell co-expressing (left) GFP-CA-FMNL1 and mCherry-Arp3, or (right) mCherry-CA-mDia3 and GFP-Arp3. (G) Bar plot indicating the percentage of cells exhibiting oscillations when different constructs were expressed (Arp3: 17/19 cells; FMNL1: 17/26 cells; CA-FMNL1: 10/12 cells, 5/19 cells; CA-mDia3: 20/25 cells). Cells were chosen in an unbiased manner from n ≥ 2 experiments). Error bars represent the SEM. (H) Representative average profiles of Arp3 aligned with respect to FMNL1-GFP, CA-FMNL1, mDia3, and CA-mDia3. Horizontal scale bars in micrographs: 10 μm. Vertical scale bars in kymographs: 10 μm. Horizontal scale bars in kymographs: 1 min. All grayscale micrographs, kymographs and montages in this paper are shown in the inverted lookup table.
Figure 2.
Figure 2.. Recruitment of FMNL1 and FMNL1 mutants relative to Arp3 in cortical traveling waves
(A) Domain schematics of various FMNL1 constructs used in this study. (B–F) Representative micrographs, kymographs, intensity profiles, and sequential montage of 4 frames (3- to 4-s interval) of a region of a cell co-expressing mCherry-Arp3 and (B) FMNL1-GFP, (C) GFP-FMNL1CT, (D) CA-FMNL1, (E) GFP-mini-FMNL1-T126D (inactive mutant), or (F) GFP-mini-FMNL1-V281E (active mutant). Horizontal scale bars in micrographs: 10 μm. Horizontal scale bars in kymographs: 1 min. Vertical scale bars in kymographs: 10 μm. Representative average profiles of mCherry-Arp3 aligned with respect to FMNL1 constructs.
Figure 3.
Figure 3.. Cortical waves of active Cdc42, formins, and Arp3 in response to cytochalasin-D treatment
(A and B) Representative micrographs, kymographs, and intensity plot of a cell stably expressing Cdc42 BD-GFP co-transfected with LifeAct-mRuby under (A) untreated condition or (B) F-actin depleted condition with cytochalasin-D. (C) Box and whisker plots comparing the periodicities of active Cdc42 oscillations in cytochalasin-D-pretreated cells of different release periods are shown. n indicates number of cells imaged. Box: 1st/3rd quartiles; whisker: 2nd and 98th percentile. Statistical differences: ****p < 0.0001; ns, not significant, 1-way ANOVA, Tukey’s multiple comparison tests. (D–G) Representative micrographs and kymographs of cells treated with cytochalasin-D (2–4 μM) over 18–24 h co-expressing LifeAct-mRuby or LifeAct-mNeonGreen with (D) GFP-CA-FMNL1, (E) FMNL1-mCherry, (F) GFP-mDia3, or (G) mCherry-Arp3. (H) Kymograph of a cell before and after treatment with cytochalasin-D (2 μM). Horizontal scale bars in micrographs: 10 μm. Vertical scale bars in kymographs: 10 μm. Horizontal scale bars in kymographs: 1 min. Cytochalasin-D inhibitor experiments were performed in normal growth medium.
Figure 4.
Figure 4.. Effects of expressing FMNL1 and FMNL1 mutants on Arp3 waves
(A) Illustration of the relative phases of FMNL1 and Arp2/3 and whether an upstream role of FMNL1 relative to Arp2/3 exists. (B) Schematic illustrating the analysis of average peak amplitudes and IPI exhibited by the co-expression of FMNL1 or different FMNL1 mutants with mCherry-Arp3. (C) Representative kymograph and intensity profile of a cell expressing mCherry-Arp3. (D–H) Representative kymograph and intensity profile of a cell co-expressing mCherry-Arp3 and (D) FMNL1-GFP, (E) GFP-FMNL1CT, (F) GFP-CA-FMNL1, (G) GFP-mini-FMNL1-T126D (inactive mutant), or (H) GFP-mini-FMNL1-V281E (active mutant). (I) Quantifications for the average IPI of cells expressing mCherry-Arp3 alone or co-expressing mCherry-Arp3 with different formins. (J) Quantifications for the average peak amplitudes of formin constructs. (K) Quantifications for the average peak amplitudes of Arp3 when cell expresses mCherry-Arp3 or co-expresses mCherry-Arp3 with formin constructs. Sample sets for (J) and (K): single expression of mCherry-Arp3: 15 cells. Co-expression of mCherry-Arp3 with the following: FMNL1-GFP: 22 cells; GFP-FMNL1CT: 16 cells; GFP-CA-FMNL1: 9 cells; GFP-mini-FMNL1-T126D (inactive mutant): 16 cells; GFP-mini-FMNL1-V281E (active mutant): 14 cells. Statistical significance: ****p < 0.0001; ns, not significant; **p < 0.012–0.0055, 1-way ANOVA, Dunnett’s multiple comparison test. Error bars represent mean ± SEM.
Figure 5.
Figure 5.. Effects of Arp2/3 inhibition on formin waves
(A) Representative intensity profile of a cell co-expressing mCherry-Arp3 and FMNL1-GFP over an acquisition period of 1 h. (B) (B and C) Representative micrographs (top), intensity plots (center), and wavelet analysis (bottom) of a cell co-expressing mCherry-Arp3 and FMNL1-GFP (B), or mCherry-Arp3 and GFP-mDia3 (C) before and after treatment with CK-666. Scale bars: 10 μm. CK-666 inhibitor experiments were performed in Tyrode’s imaging buffer.
Figure 6.
Figure 6.. Cluster formation of Arp2/3 puncta and other actin-associated proteins in traveling waves
(A–D) Representative micrographs, sequential montage of 4 frames (3-s interval) of a region of a cell co-expressing either GFP-Arp3 or mCherry-Arp3 with (A) LifeAct-mRuby, (B) FBP17-EGFP, (C) GFP-N-WASP, or (D) GFP-SHIP1. (E) Representative average profiles of Arp3 aligned with respect to LifeAct, FBP17, N-WASP, and SHIP1, and the corresponding cross-correlation analyses. (F) Sequential montages of a single punctum of 20 frames (3- to 4-s interval) of a cell co-expressing either GFP-Arp3 or mCherry-Arp3 with LifeAct-mRuby, FBP17-EGFP, GFP-N-WASP, and GFP-SHIP1. Scale bars in (A)–(D): 10 μm. Scale bar in (F): 2 μm.
Figure 7.
Figure 7.. Cortical waves of F-actin, active Cdc42, and SHIP1 in response to Arp2/3 inhibition
(A–C) Representative micrographs (top) and kymographs (bottom) of a cell co-expressing either GFP-Arp3 or mCherry-Arp3 with (A) GFP-SHIP1, (B) Cdc42 BD-GFP, or (C) LifeAct-mRuby before and after treatment with 50 μM CK-666. (D) Box and whisker plots for the average peak oscillatory amplitudes exhibited by either Arp3 (57 cells) with active Cdc42 (19 cells), FMNL1 (17 cells), LifeAct (14 cells), or SHIP1 (7 cells) before (−) and after (+) treatment with 50 μM CK-666 are shown with the number of data points shown above each plot. n indicates the number of peaks. Box: 1st/3rd quartiles; whisker: 2nd and the 98th percentile. Statistical significance: ****p < 0.0001; **p = 0.0011; *p = 0.0246; ns, not significant, t test. Error bars represent mean ± SEM. CK-666 inhibitor experiments were performed in Tyrode’s imaging buffer. (E) Structure of the dimeric Cdc42/FMNL1 complex (PDB: 4ydh), Cdc42/N-WASP complex (PDB: 1cee), and Cdc42/N-WASP complex aligned with Cdc42/FMNL1 complex on the basis of Cdc2 using chimera. Models of Cdc42 are shown in light blue and turquoise, model of the GTPase binding domain of N-WASP is shown in orange, and the model of the N-terminal domain of FMNL1 is shown in purple. Red dashed circle shows the region where FMNL1 and N-WASP clash. (F) Prior and updated model on the crosstalk and feedback mechanisms in the Cdc42-mediated actin wave network.

Update of

Similar articles

Cited by

References

    1. Campellone KG, and Welch MD (2010). A nucleator arms race: Cellular control of actin assembly. Nat. Rev. Mol. Cell Biol 11, 237–251. - PMC - PubMed
    1. Lappalainen P, Kotila T, Jégou A, and Romet-Lemonne G. (2022). Biochemical and mechanical regulation of actin dynamics. Nat. Rev. Mol. Cell Biol 23, 836–852. - PubMed
    1. Chhabra ES, and Higgs HN (2007). The many faces of actin: matching assembly factors with cellular structures. Nat. Cell Biol 9, 1110–1121. - PubMed
    1. Vicker MG (2002). Eukaryotic cell locomotion depends on the propagation of self-organized reaction-diffusion waves and oscillations of actin filament assembly. Exp. Cell Res 275, 54–66. - PubMed
    1. Bretschneider T, Diez S, Anderson K, Heuser J, Clarke M, Müller-Taubenberger A, Köhler J, and Gerisch G. (2004). Dynamic Actin Patterns and Arp2/3 Assembly at the Substrate-Attached Surface of Motile Cells. Curr. Biol 14, 1–10. - PubMed

LinkOut - more resources