. 2024 Jul 9;121(28):e2403442121.
doi: 10.1073/pnas.2403442121. Epub 2024 Jul 5.

Flp/ FRT-mediated disruption of ptex150 and exp2 in Plasmodium falciparum sporozoites inhibits liver-stage development

Affiliations

Flp/ FRT-mediated disruption of ptex150 and exp2 in Plasmodium falciparum sporozoites inhibits liver-stage development

Robyn McConville et al. Proc Natl Acad Sci U S A. .

Abstract

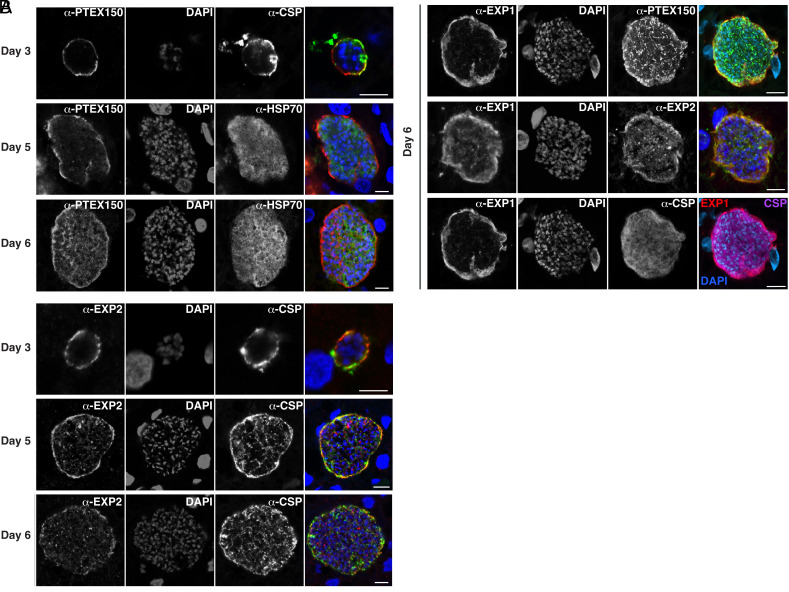
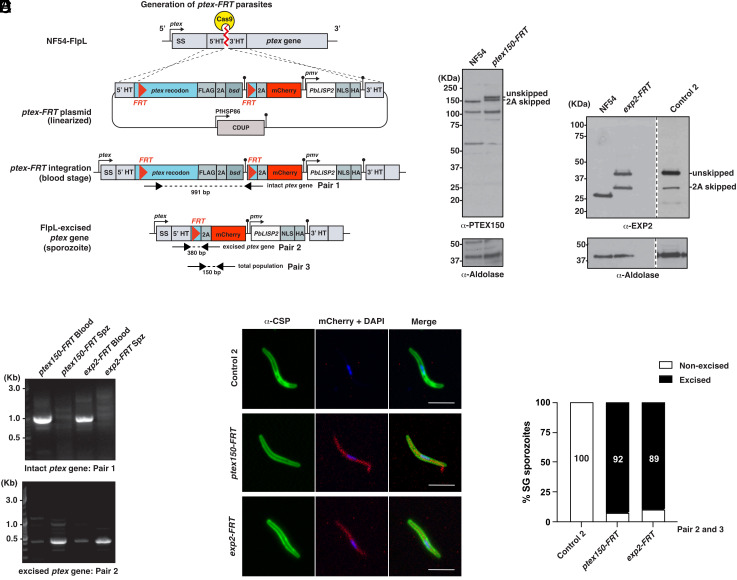
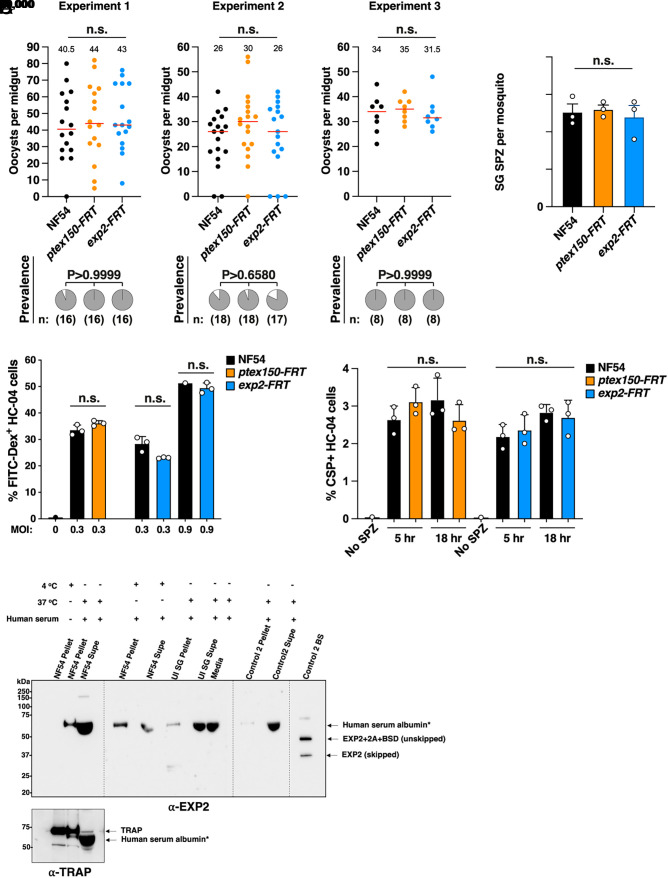
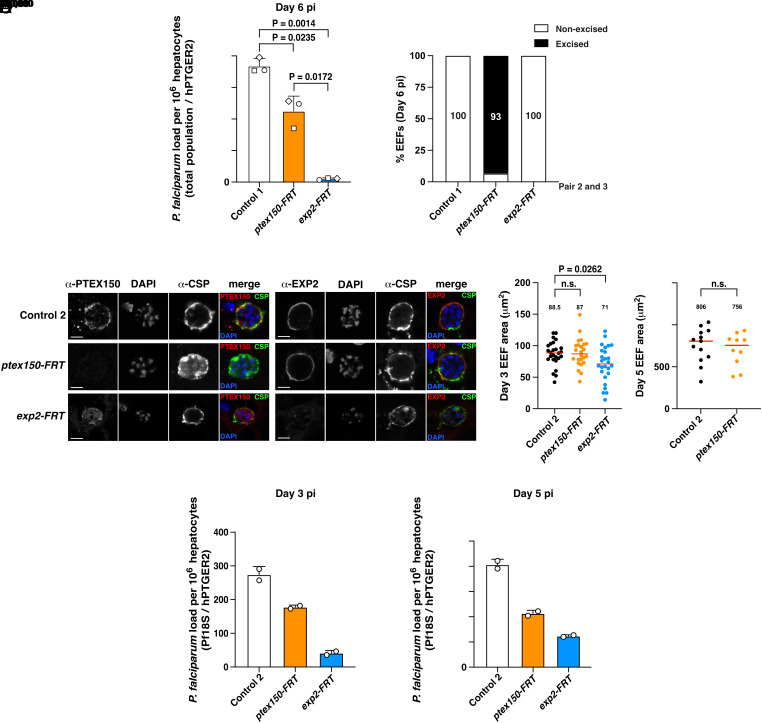
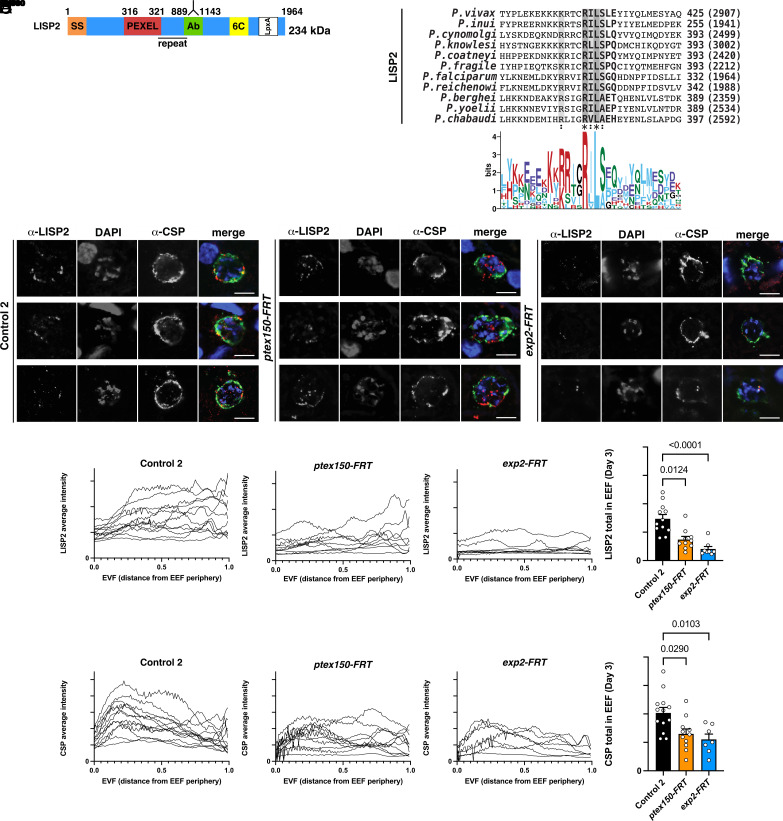
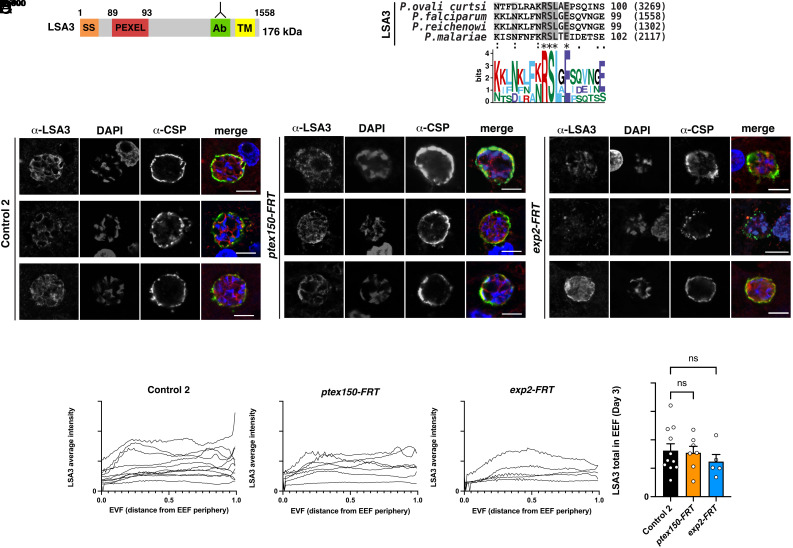
Plasmodium falciparum causes severe malaria and assembles a protein translocon (PTEX) complex at the parasitophorous vacuole membrane (PVM) of infected erythrocytes, through which several hundred proteins are exported to facilitate growth. The preceding liver stage of infection involves growth in a hepatocyte-derived PVM; however, the importance of protein export during P. falciparum liver infection remains unexplored. Here, we use the FlpL/FRT system to conditionally excise genes in P. falciparum sporozoites for functional liver-stage studies. Disruption of PTEX members ptex150 and exp2 did not affect sporozoite development in mosquitoes or infectivity for hepatocytes but attenuated liver-stage growth in humanized mice. While PTEX150 deficiency reduced fitness on day 6 postinfection by 40%, EXP2 deficiency caused 100% loss of liver parasites, demonstrating that PTEX components are required for growth in hepatocytes to differing degrees. To characterize PTEX loss-of-function mutations, we localized four liver-stage Plasmodium export element (PEXEL) proteins. P. falciparum liver specific protein 2 (LISP2), liver-stage antigen 3 (LSA3), circumsporozoite protein (CSP), and a Plasmodium berghei LISP2 reporter all localized to the periphery of P. falciparum liver stages but were not exported beyond the PVM. Expression of LISP2 and CSP but not LSA3 was reduced in ptex150-FRT and exp2-FRT liver stages, suggesting that expression of some PEXEL proteins is affected directly or indirectly by PTEX disruption. These results show that PTEX150 and EXP2 are important for P. falciparum development in hepatocytes and emphasize the emerging complexity of PEXEL protein trafficking.

Keywords: hepatocyte; humanized mice; malaria; protein export; translocon.


Conflict of interest statement

Competing interests statement:The authors declare no competing interest.

Figures

Fig. 1.
Fig. 1.
Expression of PTEX150 and EXP2 during P. falciparum liver infection in humanized mice. Sections were co-stained with (A) PTEX150, EXP2, CSP (periphery) or HSP70 (cytoplasm); and (B) PTEX150, EXP2, EXP1 (PVM) or CSP (periphery). Scale bar, 10 um.
Fig. 2.
Fig. 2.
Conditional disruption of ptex150 and exp2 genes in P. falciparum sporozoites. (A) Strategy to integrate each ptex-FRT plasmid (ptex150-FRT or exp2-FRT) into NF54 trap-FlpL parasites by double cross-over homologous recombination. Constructs contained blasticidin deaminase (bsd) for positive selection and cytosine deaminase (CDUP) for negative selection. HT, homology target. (B) Immunoblot confirming integration of ptex150-FRT and exp2-FRT plasmids into the endogenous locus in NF54 trap-FlpL parasites. Aldolase loading control is ~40 kDa. (C) PCR analyses confirming integration of ptex150-FRT and exp2-FRT plasmids in blood-stage parasites (Blood) and excision of both loci in sporozoites (Spz) after mosquito transmission. (D) Immunofluorescence microscopy shows excision of ptex150-FRT and exp2-FRT in sporozoites, determined by mCherry expression. (Scale bar, 5 mm.) (E) Efficiency of trap-FlpL excision of ptex150-FRT and exp2-FRT quantified by qRT-PCR with primer pairs 2 and 3 (refer to panel A).
Fig. 3.
Fig. 3.
Development and infectivity of P. falciparum PTEX mutant sporozoites. (A) Mosquito oocyst intensity (Top) and infection prevalence (Bottom) following standard membrane feeding assays. The mean oocyst number is indicated by a red bar and small number. The mosquito sample size (n:) is shown. Oocysts were compared using the Kruskal–Wallis one-tailed test with Dunn’s correction, and prevalence was compared using the chi-square test (Fisher’s exact test). Data are from three independent experiments. P values are indicated; n.s., not significant. (B) Salivary gland sporozoite (SG SPZ) counts per mosquito. Data are from three independent experiments. (C) HC-04 cell traversal by P. falciparum sporozoites at multiplicity of infection (MOI) 0.3 and 0.9, measured by FITC-Dextran uptake. (D) HC-04 invasion by P. falciparum sporozoites measured after incubation for 5 and 18 h, using CSP-positive antibody staining of fixed permeabilized cells. Data in panels (BD) are mean ± SEM from n = 3 experiments analyzed by one-way ANOVA (Kruskal–Wallis test). n.s., not significant. (E) Immunoblot of P. falciparum sporozoites and Control 2 BS for EXP2 expression. The overexposure is to demonstrate the absence of EXP2. Sporozoites (1 million per condition) were incubated under the designated conditions and probed with anti-EXP2 and anti-TRAP control antibodies (Left blot). *Cross-reactivity of human serum albumin in the media in numerous lanes is indicated at circa 65 kDa. “EXP2+2A + BSD (unskipped)” is a size control of unskipped EXP2 fused to 2A and Blasticidin S Deaminase (BSD) if EXP2 was expressed in Control 2 sporozoites. “EXP2 (skipped)” is a size control of 2A skipped EXP2 if it was expressed in NF54 or Control 2 sporozoites. Uninfected salivary glands (UI SG) were treated as above as a negative control. Lysates from Control 2 BS were used as a positive control for EXP2 expression.
Fig. 4.
Fig. 4.
PTEX150 and EXP2 are required for P. falciparum liver-stage development. (A) Quantification of parasite liver load coinfected into mice with chimeric human livers 6 d postinfection. Three mice received equal numbers of Control 1, ptex150-FRT, and exp2-FRT sporozoites in the same i.v. injection. Control 1 was used due to its unique genotype relative to ptex-FRT lines, allowing quantification of each parasite line in the coinfected mice. Each mouse is indicated by a different shape. Parasite liver load determined by qRT-PCR, analyzed by one-way ANOVA (Kruskal–Wallis test). (B) Genotyping of EEFs on day 6 from 3 coinfected mice from panel A shows excision of ptex150-FRT and exp2-FRT loci quantified by qRT-PCR using primer pairs 2 and 3. (C) Immunofluorescence microscopy of liver sections from individually infected humanized mice on day 3 postinfection. Mice were infected separately with Control 2, ptex150-FRT, or exp2-FRT sporozoites. (Scale bar, 5 mm.) (D) Area of P. falciparum EEFs on day 3 (Left) or day 5 (Right) postinfection. Data are median, indicated with a number and a red bar within each condition, from n = 23 to 26 (day 3) or n = 10 to 13 (day 5) individual EEFs analyzed by Mann–Whitney t test. P values are shown; n.s., not significant. (E) Quantification of parasite liver load in each humanized mice that were individually infected with Control 2, ptex150-FRT, or exp2-FRT sporozoites in separate injections on day 3 (Left) and day 5 (Right) postinfection by qRT-PCR. Shown are n = 2 technical qRT-PCR replicates as mean ± SEM from one mouse per condition (three mice for day 3, three mice for day 5; six mice total) Values were normalized to a series of pretested DNA standards.
Fig. 5.
Fig. 5.
Localization of PEXEL proteins LISP2 and CSP in P. falciparum EEFs. (A) Schematic of P. falciparum LISP2 and LSA3 including SS, PEXEL, antibody binding region (Ab), 6C domain, LpxA domain, transmembrane domain (TM). (B) Multiple sequence alignment of LISP2 from Plasmodium species shows the PEXEL motif is conserved. (C) Immunofluorescence microscopy of LISP2 in P. falciparum Control 2, ptex150-FRT, and exp2-FRT EEFs on day 3 postinfection. (Scale bar, 5 mm.) (D) Quantification of LISP2 (Top) and CSP (Bottom) pixel intensity over distance from the parasite periphery in P. falciparum Control 2, ptex150-FRT, and exp2-FRT EEFs on day 3 postinfection. Data are mean ± SEM from n = 7 to 13 individual EEFs per condition analyzed by one-way ANOVA (Kruskal–Wallis test). P values are shown; ns, not significant.
Fig. 6.
Fig. 6.
Localization of PEXEL protein LSA3 in P. falciparum EEFs. (A) Schematic of P. falciparum LSA3 including SS, PEXEL, Ab region, TM domain. (B) Multiple sequence alignment of LSA3 from Plasmodium species shows the PEXEL motif is conserved. (C) Immunofluorescence microscopy of LSA3 in P. falciparum Control 2, ptex150-FRT, and exp2-FRT EEFs on day 3 postinfection. (Scale bar, 5 mm.) (D) Quantification of LSA3 distance from the parasite periphery in P. falciparum Control 2, ptex150-FRT, and exp2-FRT EEFs on day 3 postinfection. Data are mean ± SEM from n = 5 to 11 individual EEFs per condition analyzed by one-way ANOVA (Kruskal–Wallis test). P values are shown; ns, not significant.

References

    1. WHO, World malaria report 2023 (Geneva, 2023). https://www.who.int/teams/global-malaria-programme/reports/world-malaria.... Accessed 1 February 2024.
    1. de Koning-Ward T. F., Dixon M. W., Tilley L., Gilson P. R., Plasmodium species: Master renovators of their host cells. Nat. Rev. Microbiol. 14, 494–507 (2016). - PubMed
    1. Marti M., Good R. T., Rug M., Knuepfer E., Cowman A. F., Targeting malaria virulence and remodeling proteins to the host erythrocyte. Science 306, 1930–1933 (2004). - PubMed
    1. Hiller N. L., et al. , A host-targeting signal in virulence proteins reveals a secretome in malarial infection. Science 306, 1934–1937 (2004). - PubMed
    1. Chang H. H., et al. , N-terminal processing of proteins exported by malaria parasites. Mol. Biochem. Parasitol. 160, 107–115 (2008). - PMC - PubMed

Substances

LinkOut - more resources