. 2024 Jul 9;121(28):e2403581121.
doi: 10.1073/pnas.2403581121. Epub 2024 Jul 5.

SARS-CoV-2 pathogenesis in an angiotensin II-induced heart-on-a-chip disease model and extracellular vesicle screening

Affiliations

SARS-CoV-2 pathogenesis in an angiotensin II-induced heart-on-a-chip disease model and extracellular vesicle screening

Qinghua Wu et al. Proc Natl Acad Sci U S A. .

Abstract

Adverse cardiac outcomes in COVID-19 patients, particularly those with preexisting cardiac disease, motivate the development of human cell-based organ-on-a-chip models to recapitulate cardiac injury and dysfunction and for screening of cardioprotective therapeutics. Here, we developed a heart-on-a-chip model to study the pathogenesis of SARS-CoV-2 in healthy myocardium established from human induced pluripotent stem cell (iPSC)-derived cardiomyocytes and a cardiac dysfunction model, mimicking aspects of preexisting hypertensive disease induced by angiotensin II (Ang II). We recapitulated cytopathic features of SARS-CoV-2-induced cardiac damage, including progressively impaired contractile function and calcium handling, apoptosis, and sarcomere disarray. SARS-CoV-2 presence in Ang II-treated hearts-on-a-chip decreased contractile force with earlier onset of contractile dysfunction and profoundly enhanced inflammatory cytokines compared to SARS-CoV-2 alone. Toward the development of potential therapeutics, we evaluated the cardioprotective effects of extracellular vesicles (EVs) from human iPSC which alleviated the impairment of contractile force, decreased apoptosis, reduced the disruption of sarcomeric proteins, and enhanced beta-oxidation gene expression. Viral load was not affected by either Ang II or EV treatment. We identified MicroRNAs miR-20a-5p and miR-19a-3p as potential mediators of cardioprotective effects of these EVs.

Keywords: SARS-CoV-2; cardiomyocyte; induced pluripotent stem cell; myocardium; organ-on-a-chip.


Conflict of interest statement

Competing interests statement:Y.Z., G.V.-N., B.Z., and M.R. are inventors on patents for cardiac tissue cultivation that are licensed to Valo Health. Q.W., Y.Z., and M.R. have a filed patent application on thermoplastic polymer composition for micro 3D printing and uses thereof. B.Z. holds equity in OrganoBiotech.

Figures
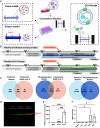
Fig. 1.
Fig. 1.
Establishing heart-on-a-chip models to recapitulate SARS-CoV-2 pathogenesis in healthy and diseased myocardium for therapeutic screening. (A) Schematics of the healthy and Ang II–induced diseased cardiac tissue models in a multiwell platform that allows for SARS-CoV-2 application. Human iPSC-derived EVs were used for therapeutic screening. (B) The timeline shows the process of tissue formation, infection of tissue models with or without Ang II treatment and functional assessment, EVs treatment of the infected tissues without Ang II, functional readouts, and the analysis of cytokine release and mRNAseq. (C) Venn diagram of SARS-CoV-2 interactors identified in human iPSC-CM BJ1D cardiac Biowire II proteomic and phosphoproteomic datasets. (D) Western blot analysis of SARS-CoV-2 nucleoprotein in a cardiac monolayer culture using BJ1D human iPSC-CM (n = 3). Loading control is β-actin. (E) The intensity of SARS-CoV-2 N protein bands from western blot was measured by arbitrary units (AU) in mock and SARS-CoV-2 infected monolayer cultures at 24 h and 48 h after infection. (n = 3) *** indicates P < 0.001, and **** indicates P < 0.0001, one-way ANOVA. (F) qPCR performed on RNA extracted from SARS-CoV-2 (MOI 1)-infected tissues at various time points after infection. n = 3, * indicates P < 0.01 with control, one-way ANOVA. (Data are shown as average ± SD; n = 3, * indicates P < 0.05, and ** indicates P < 0.01 between Ang II–treated tissues and control by one-way ANOVA.)
Fig. 2.
Fig. 2.
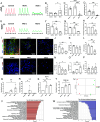
SARS-CoV-2-induced functional decline of cardiac tissues. Noninfected controls and SARS-CoV-2-infected tissues at MOI 1 and 5 before and 1 wk after infection (A) Representative force traces recorded under 1 Hz electrical pacing. (B) The normalized ET. (C) The active force. (D) Active force to passive tension ratio, normalized to baseline values before infection for each tissue (n = 5 to 8). (E) Representative calcium traces (n = 3). Quantification of (F) calcium amplitude and (G) fraction of the tissue area with detectable Ca2+ transients (n = 3). (H) Percentage of beating tissues (three batches). (I) Immunostaining for sarcomeric-F-actin (green) and cardiac troponin-T (cTNT, red). Nuclei are counterstained with DAPI (blue) (n = 3). Quantification of eccentricity and density for (J and K) F-actin and (L) the eccentricity of cTNT. (M) Confocal images for nuclei DAPI (blue) and TUNEL (red) and (O) quantification of DNA fragmentation (TUNEL/DAPI) (n = 3). (P) LDH release in culture media (n = 3 to 7). Cytokine release: (Q) IL-6, (R) IL-9, (S) MCP-1, and (T) PDGF-AA, with values normalized to the control tissue (n = 3 to 4). (U) PCA of noninfected samples (control) and SARS-CoV-2 infected tissues (MOI 5) (n = 3/group). Pathway enrichment and activity analysis for control tissues compared with MOI5 infected tissues, showing top Z-scores (V) activated and (W) inhibited pathways via the Ingenuity Pathway Analysis (IPA) (n = 3/group). (All data from BJ1D human iPSC-derived cardiac tissues. Data are presented as mean ± SD; *P < 0.05, **P < 0.01, ***P < 0.001, and ****P < 0.0001 indicate significant differences between each group, one-way ANOVA).
Fig. 3.
Fig. 3.
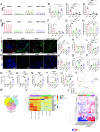
Angiotensin II treatment leads to increased inflammation upon SARS-CoV-2 infection. Noninfected tissues (control), infected tissues at MOI 5 (MOI 5), noninfected tissue with Ang II treatment (Ang II), and infected tissues at MOI 5 with Ang II treatment (MOI 5 + Ang II) before and 2 wk after infection (A) Representative force traces recorded under 1 Hz electrical pacing. (B) The ET. (C) The active force normalized for each tissue to the baseline before infection. (D) The normalized active force to passive tension ratio (n = 5 to 9). (E) Representative calcium traces. Quantification of (F) calcium amplitude and (G) fraction of the tissue area with detectable Ca2+ transients. (H) Percentage of beating tissues (three batches). (I) Immunostaining for sarcomeric-F-actin (green) and cardiac troponin-T (cTNT, red). Nuclei are counterstained with DAPI (blue) (n = 3). Quantification of eccentricity and density for (J and K) F-actin and (L and M) cTNT was analyzed from the immunofluorescent images (n = 3). (M) Confocal fluorescent image stained for DAPI (blue) and TUNEL (red) (n = 3). Quantification of (N) the cTNT density and (O) DNA fragmentation (TUNEL/DAPI) (n = 3). (P) LDH release in culture media (n = 3 to 5). Cytokine release: (Q) IL-6, (R) IL-9, (S) MCP-1, and (T) PDGF-AA, with values normalized to the control group values (n = 3). (U) ACE2 from RNA sequencing (*P < 0.05 and **P < 0.01 indicate a significant difference between each group, one-way ANOVA, n = 3 to 4). (V) PCA. (W) Venn diagram of comparison of differentially expressed genes in control, MOI 5, Ang II, and MOI 5 + Ang II. (X) Gene expression heatmaps of differentially expressed genes associated with Ang II treatment of infected tissues, i.e., MOI 5 compared with MOI 5 + Ang II. n = 3. (Y) Gene expression heatmaps containing differentially expressed genes related to Ang II activation (BioCarta_AT1R_pathway) in control, MOI 5, Ang II, and MOI 5 + Ang II (n = 3). All data from BJ1D human iPSC-derived cardiac tissues. Data are shown as average ± SD; *P < 0.05, **P < 0.01, ***P < 0.001, and ****P < 0.0001 indicate significant differences between each group, one-way ANOVA.
Fig. 4.
Fig. 4.
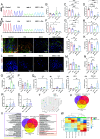
Properties and miRNA composition of iPSC- and iPSC-CM-derived EVs. (A) TEM images of isolated CM- and iPSC-EVs. (Scale bar: 100 nm.) (B) Representative size distribution curves for EVs derived from BJ1D cardiomyocytes (CM-EVs) and stem cells (iPSC-EVs), measured via nanoparticle tracking analysis (NTA). (C) Particle concentration and (D) mean size of EVs. N = 10 for CM EVs and n = 7 for iPSC-EVs, Welch’s t test. (E) Western blot detection of CD63 and ALIX, displayed alongside target detection in corresponding 2D cell culture lysates. (F) Comparison of the number of distinct vs. overlapping miRNA species detected in sequenced samples. (G) PCA. (H) Differential expression of miRNAs in iPSC-EVs, compared to CM-EVs, plotted against their relative abundance in iPSC-EVs. The top 12 most significantly up-regulated and most abundant miRNAs detected in iPSC-EVs are highlighted in the gray box and were selected for downstream target prediction and gene ontology analyses. (I) Top 25 significantly up-regulated and down-regulated miRNAs in iPSC-EVs with respect to CM-EVs. (J) Top 20 enriched gene ontology (GO) terms from the PANTHER GO-Slim biological process statistical overrepresentation test on predicted target genes derived from 9,812 abundant, up-regulated miRNAs in iPSC-EVs. Enriched GO terms represent potential processes that are significantly suppressed by iPSC-EVs miRNA cargo. (K) Fraction of total counts of different miRNA in iPSC-EVs, selected based on the total abundance and differential expression compared with those miRNAs in CM-EVs. (L) Heat map of the KEGG pathways in pathway enrichment analysis. For all miRNA sequencing figures: n = 3 for CM-EVs and n = 4 for iPSC-EVs. FDR-adjusted P < 0.05; FDR, false discovery rate.
Fig. 5.
Fig. 5.
Cardioprotective effects of iPSC-EVs in heart-on-a-chip. The figure shows the following groups: noninfected tissues without iPSC-EVs treatment (control group) and those with iPSC-EVs treatment (EVs group) as well as the infected tissues at MOI 5 without iPSC-EV treatment (MOI 5 group) and those with iPSC-EVs treatment (MOI 5 + EVs), 1 wk after infection. (A) Representative force traces recorded under 1 Hz stimulation. (B) Normalized ET. (C) The active force normalized for each tissue to the baseline before infection. (D) The normalized active force to passive tension ratio (n = 4 to 8). *P < 0.05, **P < 0.01, ***P < 0.001, and ****P < 0.0001 indicate significant differences between groups, one-way ANOVA. #P < 0.05 indicates a t test between MOI 5 and MOI 5 +EVs groups. (E) Representative calcium traces (n = 3). Quantification of (F) calcium amplitude and (G) fraction of the tissue area with detectable Ca2+ transients. (H) Percentage of beating tissues (three batches). (I) Immunostaining of sarcomeric-F-actin (green) and cardiac troponin-T (cTNT, red) 2 wk after infection. Nuclei are counterstained with DAPI (blue) (n = 3). Quantification of (J) F-actin eccentricity, (K) cTNT eccentricity (n = 3), (L) confocal fluorescent images stained for DAPI (blue) and TUNEL (red) (n= 3). Quantification of (M) F-actin density, and (N) cTNT density analyzed from the immunofluorescent images (n = 3). (O) Quantification of DNA fragmentation (TUNEL/DAPI) 2 wk after infection (n = 3). (P) LDH release in culture media (n ≥ 3). (Q) Cytokine release measured 1 wk after infection: i) IL-6, ii) IL-9, iii) MCP-1, and iv) PDGF-AA (n = 3). Normalized (R) active force and (S) AF/PT ratio compared among groups of infected tissues without (MOI 5) and with iPSC-EVs treatment from a single dose [MOI 5 + EVs (SD)] and multiple dose [MOI 5 + EVs (MD)] 1 wk after infection, normalized for each tissue to the baseline before infection (n = 6 to 7). (T) PCA of control, MOI 5, and MOI 5 + EVs 2 wk after infection (n = 3/group). (U) Venn diagram of differentially expressed genes and (V) activated pathways via IPA in control, MOI 5, and MOI 5 + EVs groups. (W) Gene expression heatmaps of differentially expressed genes for MOI 5 compared with MOI 5 + EVs groups. All data from BJ1D human iPSC-derived cardiac tissues. Data are shown as average ± SD; *P < 0.05, **P < 0.01, ***P < 0.001, and ****P < 0.0001 indicate significant differences between each group, one-way ANOVA.
Fig. 6.
Fig. 6.
Single miRNAs from iPSC-EVs can enhance cardiac recovery in the presence of SARS-CoV-2. (A) Experimental timeline. (B) Interaction among miR-20a-5p-target genes. (C) Target miRNA abundance in iPSC-EVs, their differential expression compared to those in CM-EVs, and their known effect in CM systems. iPSC-CM monolayers were transfected with miRNA mimic control (miR-mimic), miR-19a-3p, miR-20a-5p, and miR-302d-5p at MOI 0.1, exposed to SARS-CoV-2 and assessed at 2 dpi. (D) Representative contractility and calcium curves, contractility measured in AU. (E) Normalized contractility (n = 4 to 6). (F) Calcium amplitude (n = 4 to 6). [G (i)] Immunostaining for F-actin (green) and cardiac troponin T (red). Nuclei are counterstained with DAPI, (n = 3). Quantification of (H) F-actin density. [G (ii)] Confocal images with immunostaining of DAPI (blue) and TUNEL (red) and (I) quantification of DNA fragmentation (TUNEL/DAPI) (n = 3). The dashed lines in all bar figures indicate the corresponding values from the noninfected monolayer, without miRNA transfection. Data are shown as mean ± SD; *P < 0.05 among those four groups, one-way ANOVA.

References

    1. Clerkin K. J., et al. , COVID-19 and cardiovascular disease. Circulation 141, 1648–1655 (2020). - PubMed
    1. Bugert C. L., Kwiat V., Valera I. C., Bugert J. J., Parvatiyar M. S., Cardiovascular injury due to SARS-CoV-2. Curr. Clin. Microbiol. Rep. 8, 167–177 (2021). - PMC - PubMed
    1. Xie Y., Xu E., Bowe B., Al-Aly Z., Long-term cardiovascular outcomes of COVID-19. Nat. Med. 28, 583–590 (2022). - PMC - PubMed
    1. Bao L., et al. , The pathogenicity of SARS-CoV-2 in hACE2 transgenic mice. Nature 583, 830–833 (2020). - PubMed
    1. Muñoz-Fontela C., et al. , Animal models for COVID-19. Nature 586, 509–515 (2020). - PMC - PubMed

LinkOut - more resources