. 2024 Sep 26;144(13):1399-1411.
doi: 10.1182/blood.2023021705.

Single-cell genomics details the maturation block in BCP-ALL and identifies therapeutic vulnerabilities in DUX4-r cases

Affiliations

Single-cell genomics details the maturation block in BCP-ALL and identifies therapeutic vulnerabilities in DUX4-r cases

Hanna Thorsson et al. Blood. .

Abstract

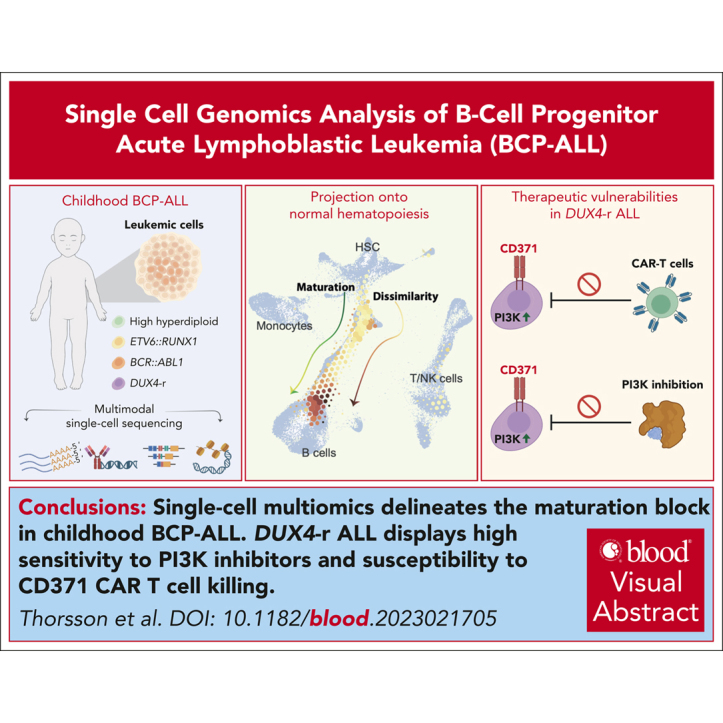
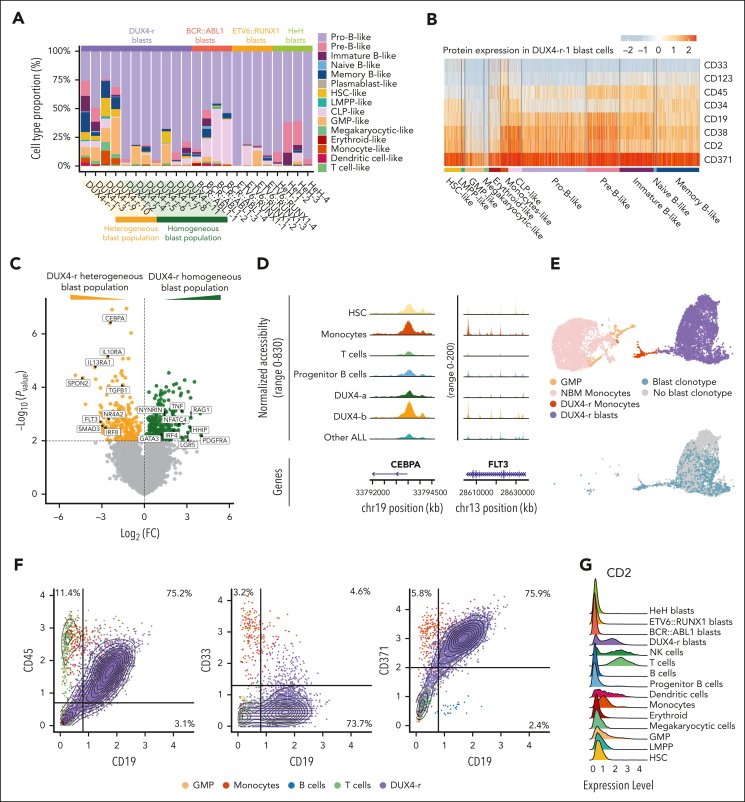
B-cell progenitor acute lymphoblastic leukemia (BCP-ALL) is the most common childhood malignancy and is driven by multiple genetic alterations that cause maturation arrest and accumulation of abnormal progenitor B cells. Current treatment protocols with chemotherapy have led to favorable outcomes but are associated with significant toxicity and risk of side effects, highlighting the necessity for highly effective, less toxic, targeted drugs, even in subtypes with a favorable outcome. Here, we used multimodal single-cell sequencing to delineate the transcriptional, epigenetic, and immunophenotypic characteristics of 23 childhood BCP-ALLs belonging to the BCR::ABL1+, ETV6::RUNX1+, high hyperdiploid, and recently discovered DUX4-rearranged (DUX4-r) subtypes. Projection of the ALL cells along the normal hematopoietic differentiation axis revealed a diversity in the maturation pattern between the different BCP-ALL subtypes. Although the BCR::ABL1+, ETV6::RUNX1+, and high hyperdiploidy cells mainly showed similarities to normal pro-B cells, DUX4-r ALL cells also displayed transcriptional signatures resembling mature B cells. Focusing on the DUX4-r subtype, we found that the blast population displayed not only multilineage priming toward nonhematopoietic cells, myeloid, and T-cell lineages, but also an activation of phosphatidylinositol 3-kinase (PI3K)/AKT signaling that sensitized the cells to PI3K inhibition in vivo. Given the multilineage priming of DUX4-r blasts with aberrant expression of myeloid marker CD371 (CLL-1), we generated chimeric antigen receptor T cells, which effectively eliminated DUX4-r ALL cells in vivo. These results provide a detailed characterization of BCP-ALL at the single-cell level and reveal therapeutic vulnerabilities in the DUX4-r subtype, with implications for the understanding of ALL biology and new therapeutic strategies.


Conflict of interest statement

Conflict-of-interest disclosure: The authors declare no competing financial interests.

Figures

None
Graphical abstract
Figure 1.
Figure 1.
Multimodal single-cell sequencing reveals a severely altered leukemic BM. (A) Schematic illustration of multiomic profiling of BCP-ALL (n = 23) and NBM (n = 9) samples. Illustration created with BioRender.com. (B) UMAP visualization of scRNA-seq gene expression data representing 188 546 cells from the BCP-ALL and NBM samples. Each cell is colored according to the cell type. (C) UMAP visualization of scATAC-seq data representing 41 892 nuclei from the BCP-ALL and NBM samples. (D) Cell composition based on scRNA-seq data in DUX4-r, BCR::ABL1+, ETV6::RUNX1+, and HeH ALL samples, as well as mononuclear cells (MNC), CD34+-enriched cells, and CD19+-enriched cells from NBM samples. ALL blast cells, regardless of subtype, are marked in gray. (E) Protein expression by scADT-seq of CD10, CD19, CD22, CD34, CD20, and CD45 on BCP-ALL blast cells and nonleukemic cells from BCP-ALL and NBM samples, visualized using ridge plots. (F) TF footprinting of the DUX4-binding motif shows that DUX4 is exclusively active in DUX4-r blast cells (marked in purple). The annotation “all other cell types” denotes all other detected cell types using the color legend from C. (G) UMAP visualization of T cells extracted from the larger scRNA-seq data set colored by sample type (upper) and predicted cell type (lower) showing a specific cell cluster of an accumulation of CD4+ T cells exclusively from DUX4-r ALL. (H) Gene set enrichment scores using defined gene sets from dysfunctional CD4+ T cells in cancer by Li et al (left) and Zheng et al (right)., The gene set enrichment scores are based on differentially expressed genes between memory CD4+ T cells in DUX4-r ALL and NBM-MNC. GMP, granulocyte-macrophage progenitors; LMPP, lympho-myeloid primed progenitor; NK, natural killer; scBCR-seq, single-cell BCR sequencing; scRNA-seq, single-cell RNA sequencing; UMAP, uniform manifold approximation and projection.
Figure 2.
Figure 2.
Projection of blast cells onto normal B-cell maturation trajectory shows variable maturation blocks between different subtypes of BCP-ALL. (A) A force–directed knn graph of cells involved in B-cell maturation from NBM samples, based on scRNA-seq data, colored by cell type with an accompanying cell density plot of numbers of cells along the trajectory. Inferred time points (t0.0-t1.0) are indicated along the trajectory. The 3 most common annotations are visualized at the top of the cell density plot. This force–directed knn graph was used as a reference for the projection of ALL blast cells in (C-F). (B) The force–directed knn graph of NBM B-cell trajectory colored by BCR chain status with an accompanying cell density plot of numbers of cells along the trajectory. The minus sign (−) indicates a feature that is not detected, the plus sign (+) indicates a feature that is detected, and a plus/minus sign (±) indicates that this category does not rely on the detection of this feature (ie, it can be either detected or not detected). The colors for the 3 most common annotations are visualized at the top of the color-coded cell density plots. (C-F) Single-cell projections of blast cells from all patients representing BCR::ABL1+ (n = 4), ETV6::RUNX1+ (n = 4), HeH (n = 4), and DUX4-r ALL (n = 11) onto the NBM reference. The density of the projected cells is visualized by hexagon size. Gene expression differences compared with the NBM reference, based on the local outlier factor, are highlighted by the color gradient. Cell density plots below the projection illustrate the number of cells along the trajectory and are color-coded by cell type (upper) and BCR chain status (lower). The color for the 3 most common annotations is visualized on the top of the color-coded cell density plots. (G) Three cell density plots illustrating the numbers of DUX4-r blast cells along the trajectory color-coded by cell types, presenting 3 cellular differentiation patterns observed within DUX4-r ALL denoted Pattern-1 (upper), Pattern-2 (middle), and Pattern-3 (lower). The color for the 3 most common annotations is visualized on the top of the color-coded cell density plots. (H) NBM reference knn graph projection of blast cells from all DUX4-r ALL samples, with time point path (t0.0-t1.0) indicated in gray, and an associated heat map showing the gradual gene expression changes along the path (with genes selected by variance filtering and linear regression). The genes marked in red represent lineage-defining genes for B cells. CLP, common lymphoid progenitor; IGH, heavy chain; IGLL1, surrogate light chain; IGL/K, light chain; p, productive; np, nonproductive.
Figure 2.
Figure 2.
Projection of blast cells onto normal B-cell maturation trajectory shows variable maturation blocks between different subtypes of BCP-ALL. (A) A force–directed knn graph of cells involved in B-cell maturation from NBM samples, based on scRNA-seq data, colored by cell type with an accompanying cell density plot of numbers of cells along the trajectory. Inferred time points (t0.0-t1.0) are indicated along the trajectory. The 3 most common annotations are visualized at the top of the cell density plot. This force–directed knn graph was used as a reference for the projection of ALL blast cells in (C-F). (B) The force–directed knn graph of NBM B-cell trajectory colored by BCR chain status with an accompanying cell density plot of numbers of cells along the trajectory. The minus sign (−) indicates a feature that is not detected, the plus sign (+) indicates a feature that is detected, and a plus/minus sign (±) indicates that this category does not rely on the detection of this feature (ie, it can be either detected or not detected). The colors for the 3 most common annotations are visualized at the top of the color-coded cell density plots. (C-F) Single-cell projections of blast cells from all patients representing BCR::ABL1+ (n = 4), ETV6::RUNX1+ (n = 4), HeH (n = 4), and DUX4-r ALL (n = 11) onto the NBM reference. The density of the projected cells is visualized by hexagon size. Gene expression differences compared with the NBM reference, based on the local outlier factor, are highlighted by the color gradient. Cell density plots below the projection illustrate the number of cells along the trajectory and are color-coded by cell type (upper) and BCR chain status (lower). The color for the 3 most common annotations is visualized on the top of the color-coded cell density plots. (G) Three cell density plots illustrating the numbers of DUX4-r blast cells along the trajectory color-coded by cell types, presenting 3 cellular differentiation patterns observed within DUX4-r ALL denoted Pattern-1 (upper), Pattern-2 (middle), and Pattern-3 (lower). The color for the 3 most common annotations is visualized on the top of the color-coded cell density plots. (H) NBM reference knn graph projection of blast cells from all DUX4-r ALL samples, with time point path (t0.0-t1.0) indicated in gray, and an associated heat map showing the gradual gene expression changes along the path (with genes selected by variance filtering and linear regression). The genes marked in red represent lineage-defining genes for B cells. CLP, common lymphoid progenitor; IGH, heavy chain; IGLL1, surrogate light chain; IGL/K, light chain; p, productive; np, nonproductive.
Figure 3.
Figure 3.
DUX4-r ALL cells are dependent on the PI3K/AKT pathway. (A) Volcano plot representing genes significantly overexpressed in DUX4-r blast cells (green) and normal progenitor B cells (yellow). Top genes based on fold changes are indicated with a label. P value cutoff is 0.01 (B) Chromatin accessibility of the gene regions of AGAP1, ANGPT2, GATA3, S100A16, and MCAM, the top 5 expressed genes based on fold change in DUX4-r blast cells. (C) Top 10 cell-type marker gene sets from GSEA of differentially expressed genes between DUX4-r blast cells and normal progenitor B cells. (D) Network plot visualizing GSEA of reactome pathways when comparing DUX4-r blast cells and progenitor B cells. (E) In vitro viability of BCP-ALL cell lines treated with a selective p110α (PIK3CA) inhibitor, alpelisib, with half-maximal inhibitory concentration (IC50) and 95% CI. (F) Experimental design for in vivo treatment of the DUX4-r-13 PDX sample in immunodeficient mice using alpelisib (35 mg/kg, 5 days on/2 days off for 3 weeks). (G) Number of human DUX4-r blast cells (ALL cells) in the BM after treatment. (H) Phosphorylation of AKT (pS473) in human DUX4-r blast cells in the mouse BM after treatment. (I) Phosphorylation of mammalian target of rapamycin (mTOR) (pS2448) in human DUX4-r blast cells in the mouse BM after treatment. CI, confidence interval.
Figure 4.
Figure 4.
Lineage infidelity with an emphasis toward myeloid lineages detected in the DUX4-r blast population. (A) Cell type classification of the BCP-ALL blast cell population. DUX4-r ALL cases with only a minority of cells classified as pro-B cells (heterogeneous blast population) are grouped together on the left. (B) Cell surface protein expression in the predicted cell types, as determined by scADT-seq within the blast population of DUX4-r-1. (C) Volcano plot representing differentially expressed genes between the blast population of DUX4-r ALL samples with heterogeneous blast population (yellow) and homogeneous blast population (green). The P value cutoff is .01. (D) Chromatin accessibility of the gene regions of FLT3 and CEBPA in monocytes, progenitor B cells, DUX4-a, DUX4-b, and other ALL subtype blast cells (BCR::ABL1+, ETV6::RUNX1+, and HeH ALL). (E) (Upper figure) UMAP visualization of normal GMPs, normal monocytes, monocyte-like blast cells, and lymphoid blast cells from the samples NBM-MNCs and DUX4-r-1, respectively, colored by cell type. (Lower figure) UMAP visualization of GMPs, monocyte-like blast cells, and lymphoid blast cells from the sample DUX4-r-1 only, colored by the presence of the blast cell clonotypic V(D)J rearrangement. (F) Expression of the cell surface markers CD45, CD33, and CD371 vs CD19 on all single cells in the individual case of DUX4-1 ALL, as determined by scADT-seq. Cells are colored by cell type. (G) T-cell–associated cell surface marker CD2 expression on BCP-ALL blast cells and other cell types, as determined by scADT-seq.
Figure 5.
Figure 5.
DUX4-r ALL is susceptible to killing by CAR T cells directed against the myeloid–associated marker CD371. (A) Cell surface marker CD371 expression in BCP-ALL blast cells and residual nonleukemic hematopoiesis as determined by scADT-seq. (B) Open chromatin in the gene region of the CLEC12A gene (that encodes CD371) is visualized in BCP-ALL blast cells and other cell types. (C) Schematic illustration of targeting of DUX4-r ALL blast cells expressing CD371 and CD19 on the cell surface by CD19 and CD371 CAR T cells, respectively. (D) Coincubation with wild-type NALM6 displayed antitumor activity against CD371 and CD19 CAR T cells. Only CD19 CAR T cells retained the cytotoxic activity in NALM6-CD371-KO lacking CD371 expression. (E) Effective ex vivo targeting of DUX4-r ALL blast cells in 3 independently derived DUX4-r PDX samples. The proportion of live PDX cells after CAR T cell treatment. (F) Experimental design for in vivo targeting of the DUX4-r-13 PDX sample in immunodeficient mice using CD371-CAR (44544) T cells, CD19-CAR T cells, or untransduced T cells. (G) The number of human DUX4-r blast cells (ALL cells) in BM at the end point. (H) Number of human DUX4-r blast cells (ALL cells) in PB at the end point. (I) Spleen weight at the end point. PB, peripheral blood.

Comment in

References

    1. Iacobucci I, Mullighan CG. Genetic basis of acute lymphoblastic leukemia. J Clin Oncol. 2017;35(9):975–983. - PMC - PubMed
    1. Pui CH, Relling MV, Downing JR. Acute lymphoblastic leukemia. N Engl J Med. 2004;350(15):1535–1548. - PubMed
    1. Brady SW, Roberts KG, Gu Z, et al. The genomic landscape of pediatric acute lymphoblastic leukemia. Nat Genet. 2022;54(9):1376–1389. - PMC - PubMed
    1. Inaba H, Mullighan CG. Pediatric acute lymphoblastic leukemia. Haematologica. 2020;105(11):2524–2539. - PMC - PubMed
    1. Bhojwani D, Yang JJ, Pui CH. Biology of childhood acute lymphoblastic leukemia. Pediatr Clin North Am. 2015;62(1):47–60. - PMC - PubMed

Publication types

MeSH terms