. 2024 Jul 5;20(7):e1012258.
doi: 10.1371/journal.pcbi.1012258. eCollection 2024 Jul.

Estimating error rates for single molecule protein sequencing experiments

Affiliations

Estimating error rates for single molecule protein sequencing experiments

Matthew Beauregard Smith et al. PLoS Comput Biol. .

Abstract

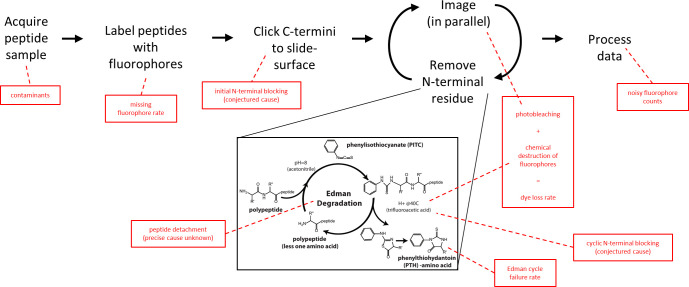
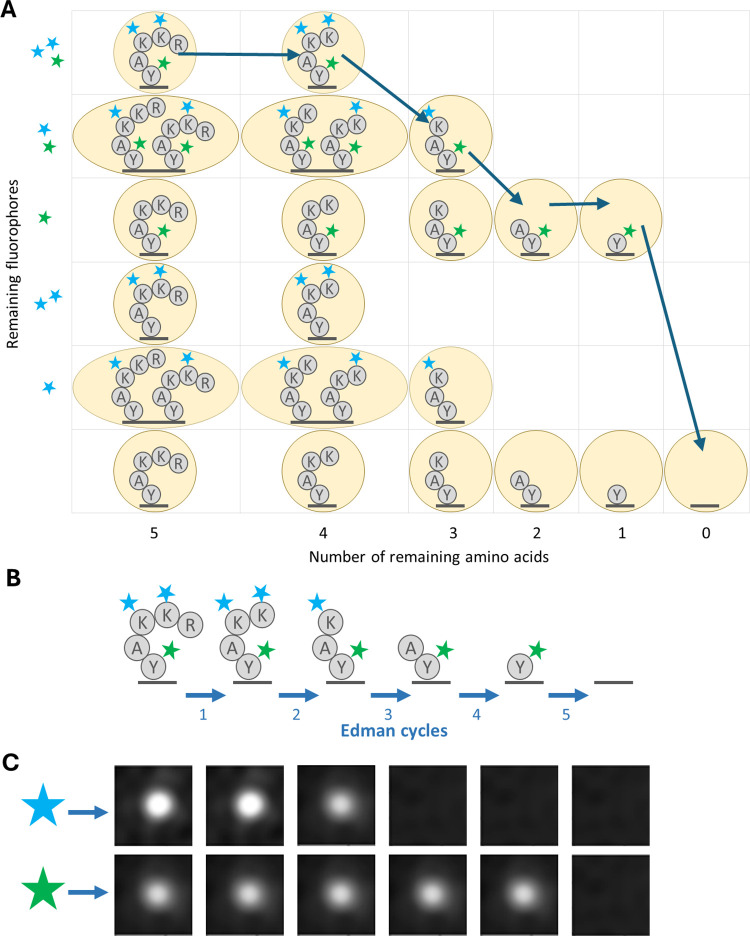
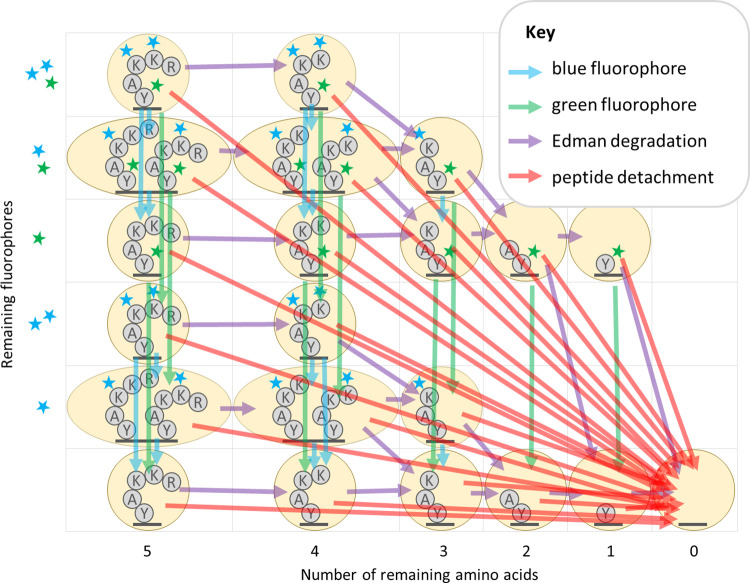
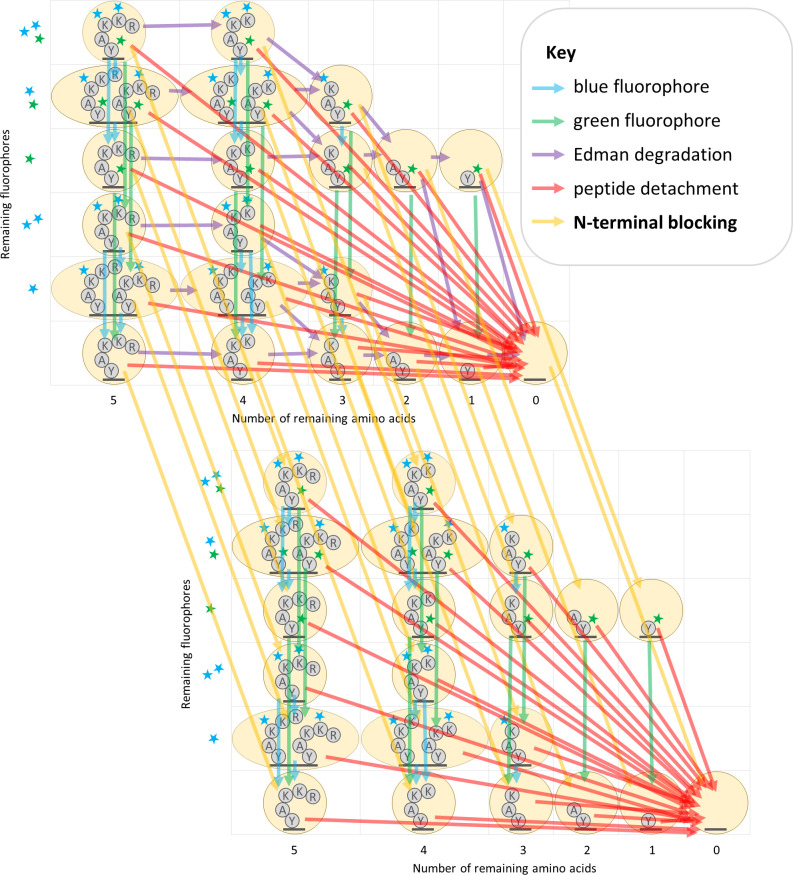
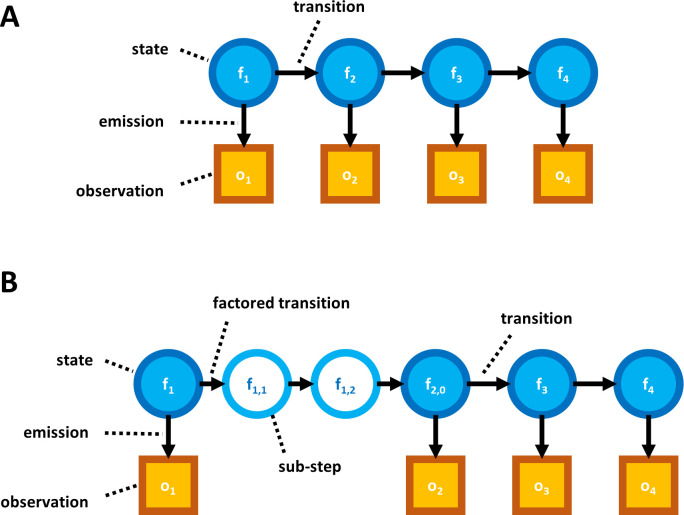
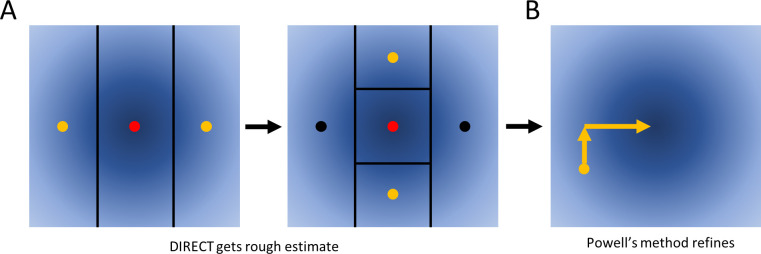
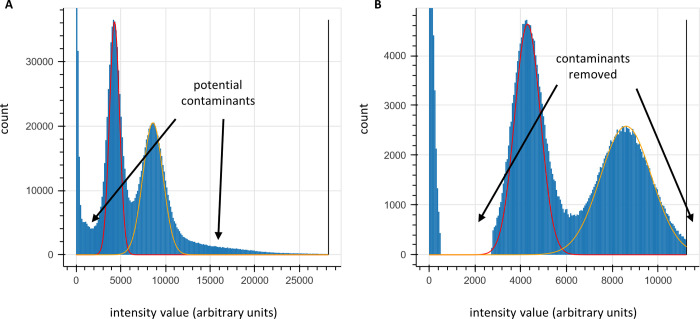
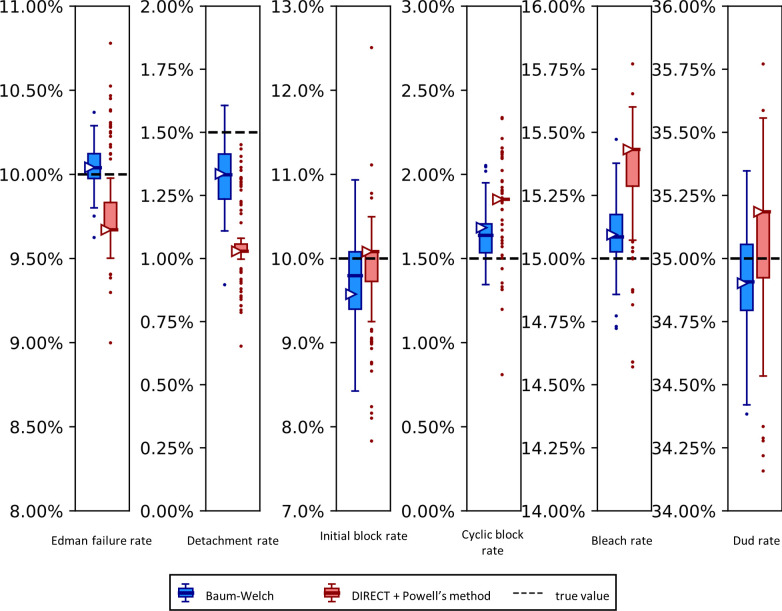
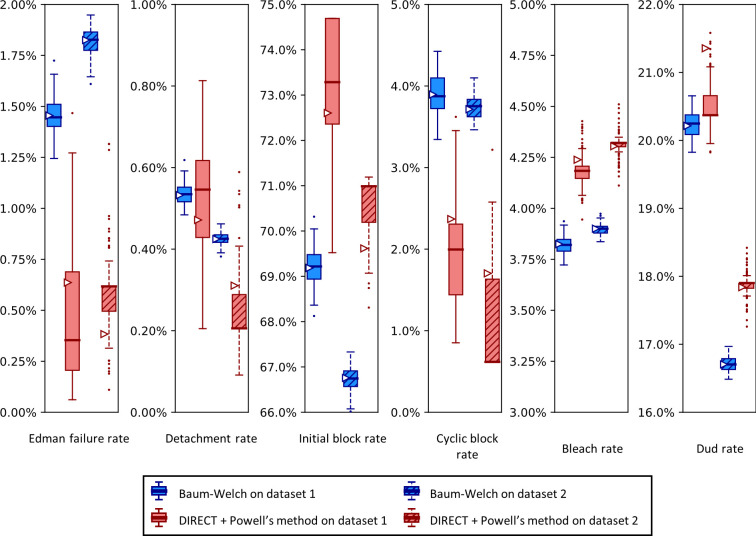
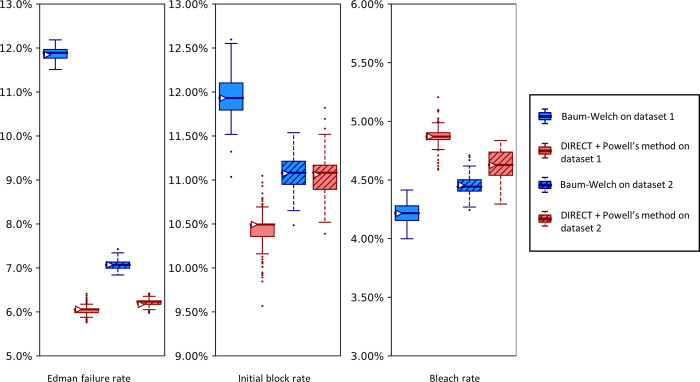
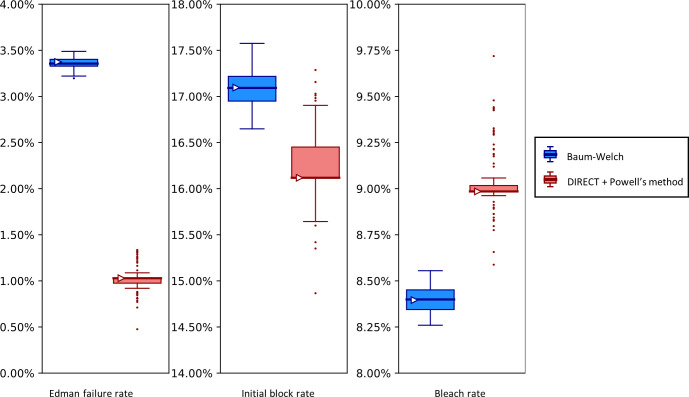
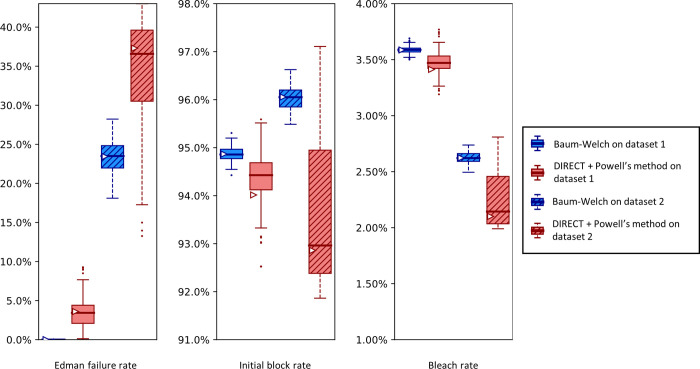
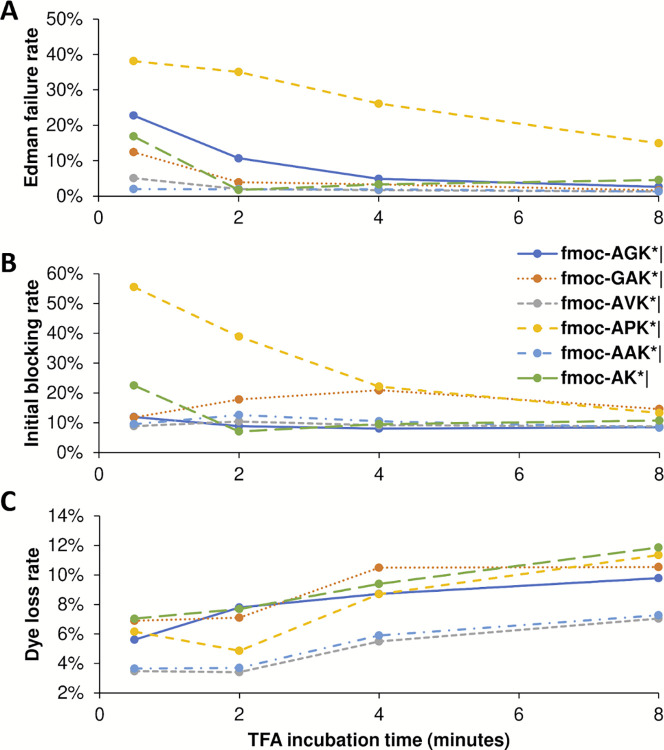
The practical application of new single molecule protein sequencing (SMPS) technologies requires accurate estimates of their associated sequencing error rates. Here, we describe the development and application of two distinct parameter estimation methods for analyzing SMPS reads produced by fluorosequencing. A Hidden Markov Model (HMM) based approach, extends whatprot, where we previously used HMMs for SMPS peptide-read matching. This extension offers a principled approach for estimating key parameters for fluorosequencing experiments, including missed amino acid cleavages, dye loss, and peptide detachment. Specifically, we adapted the Baum-Welch algorithm, a standard technique to estimate transition probabilities for an HMM using expectation maximization, but modified here to estimate a small number of parameter values directly rather than estimating every transition probability independently. We demonstrate a high degree of accuracy on simulated data, but on experimental datasets, we observed that the model needed to be augmented with an additional error type, N-terminal blocking. This, in combination with data pre-processing, results in reasonable parameterizations of experimental datasets that agree with controlled experimental perturbations. A second independent implementation using a hybrid of DIRECT and Powell's method to reduce the root mean squared error (RMSE) between simulations and the real dataset was also developed. We compare these methods on both simulated and real data, finding that our Baum-Welch based approach outperforms DIRECT and Powell's method by most, but not all, criteria. Although some discrepancies between the results exist, we also find that both approaches provide similar error rate estimates from experimental single molecule fluorosequencing datasets.


Conflict of interest statement

I have read the journal’s policy and the authors of this manuscript have the following competing interests: A.M.B. and E.M.M. are co-founders and shareholders of Erisyon, Inc., and are co-inventors on granted patents or pending patent applications related to single-molecule protein sequencing. A.M.B. serves on the board of directors and E.M.M. serves on the scientific advisory board. M.B.S., K.V., T.B., H.D.S., J.H.M., T.M.F., C.M., and A.M.B. are affiliated with Erisyon, Inc., as employees or shareholders. H.D.S. is currently employed by UT Austin with funding from a Sponsored Research Agreement from Erisyon, Inc.

Figures

Fig 1
Fig 1. Overview of single molecule protein fluorosequencing with various potential sources of errors highlighted in red.
Fig 2
Fig 2. Demonstration of the relationship between fluorosequencing data and the theoretical model.
(A) Illustration of a potential path through the states in the model, in this case the path represents perfect sequencing with no errors. (B) Illustration of the same peptide being sequenced with successive Edman cycles, aligned with the images in (C) the raw data we wish to analyze, i.e. the light emitted from a single molecule measured across two fluorescent channels (rows) for 5 Edman cycles (columns).
Fig 3
Fig 3. Diagram of factored hidden Markov model for fluorosequencing of an example peptide with three labeled amino acids.
Fig 4
Fig 4. Factored transition matrix diagram including N-terminal blocking.
Fig 5
Fig 5. Illustration of HMM factorization.
(A) Diagram of a non-factored HMM model. Arrows represent a conditional probability relationship. The transitions between states determine how a state at one time step is probabilistically related to the state at the preceding time step. Emissions represent how the observable data is probabilistically determined by the associated state. (B) Diagram including a factored transition. Breaking a transition into a factored product of sub-transitions introduces “sub-steps”; though not accurate models of any physical states of an actual peptide, these sub-steps prove useful for algorithmic purposes.
Fig 6
Fig 6. Data is lost due to missing fluorophores.
Fig 7
Fig 7. Illustration of DIRECT and Powell’s method.
Fig 8
Fig 8. Determination of fluorescence intensity distribution parameters and filtering of likely contaminants.
(A) unaltered histogram of intensity values for a NH2-G{azK}*AG{azK}*| peptide sequencing experiment with superimposed normal distributions (red, fit to peak max (μ) and half-width; yellow, expectation from 2*μ). We typically observe some deviation from a normal distribution that can cause challenges with fitting the distribution, often solved in practice either by fitting the max and peak half-width (as in the red curve) or by trial-and-error using expert judgment. (B) clipped data for the same experiment, removing ranges of intensity values likely to be caused by contaminants or signal bleed over from adjacent peaks. Typically, reads are removed from subsequent analyses if any of their intensity values fall in that range.
Fig 9
Fig 9. The Baum-Welch and DIRECT + Powell’s methods agree within 0.5% error on simulated data.
Fig 10
Fig 10. Simulated datasets with more reads exhibit tighter distributions of parameter estimates.
Fig 11
Fig 11. A comparison of Baum-Welch and DIRECT + Powell’s method on experimental sequencing data for a two-fluorophore peptide shows general agreement between the methods.
Fig 12
Fig 12. A higher Edman failure rate is observed for a proline-containing peptide, with general agreement between the estimation methods.
Fig 13
Fig 13. Analysis of experimental fluorosequencing data from a peptide similar to that in Fig 12 but containing no proline residues exhibits lower Edman failure rates and shows agreement between the methods.
Fig 14
Fig 14. Both parameter estimators correctly recognize high initial block rates (>91%) in an intentionally N-terminally blocked peptide.
Fig 15
Fig 15. Longer TFA incubation times reduce the Edman failure rate but increase the dye loss rate.

Update of

References

    1. Floyd BM, Marcotte EM. Protein Sequencing, One Molecule at a Time. Annu Rev Biophys. 2022;51: 181–200. doi: 10.1146/annurev-biophys-102121-103615 - DOI - PMC - PubMed
    1. Alfaro JA, Bohländer P, Dai M, Filius M, Howard CJ, van Kooten XF, et al.. The emerging landscape of single-molecule protein sequencing technologies. Nat Methods. 2021;18: 604–617. doi: 10.1038/s41592-021-01143-1 - DOI - PMC - PubMed
    1. Restrepo-Pérez L, Joo C, Dekker C. Paving the way to single-molecule protein sequencing. Nat Nanotechnol. 2018;13: 786–796. doi: 10.1038/s41565-018-0236-6 - DOI - PubMed
    1. Tullman J, Marino JP, Kelman Z. Leveraging nature’s biomolecular designs in next-generation protein sequencing reagent development. Appl Microbiol Biotechnol. 2020;104: 7261–7271. doi: 10.1007/s00253-020-10745-2 - DOI - PubMed
    1. Zhao Y, Iarossi M, De Fazio AF, Huang J-A, De Angelis F. Label-Free Optical Analysis of Biomolecules in Solid-State Nanopores: Toward Single-Molecule Protein Sequencing. ACS Photonics. 2022;9: 730–742. doi: 10.1021/acsphotonics.1c01825 - DOI - PMC - PubMed

LinkOut - more resources