. 2024 Jul 5;10(27):eadk1174.
doi: 10.1126/sciadv.adk1174. Epub 2024 Jul 5.

Neural progenitor-derived Apelin controls tip cell behavior and vascular patterning

Affiliations

Neural progenitor-derived Apelin controls tip cell behavior and vascular patterning

Julian Malchow et al. Sci Adv. .

Abstract

During angiogenesis, vascular tip cells guide nascent vascular sprouts to form a vascular network. Apelin, an agonist of the G protein-coupled receptor Aplnr, is enriched in vascular tip cells, and it is hypothesized that vascular-derived Apelin regulates sprouting angiogenesis. We identify an apelin-expressing neural progenitor cell population in the dorsal neural tube. Vascular tip cells exhibit directed elongation and migration toward and along the apelin-expressing neural progenitor cells. Notably, restoration of neural but not vascular apelin expression in apelin mutants remedies the angiogenic defects of mutants. By functional analyses, we show the requirement of Apelin signaling for tip cell behaviors, like filopodia formation and cell elongation. Through genetic interaction studies and analysis of transgenic activity reporters, we identify Apelin signaling as a modulator of phosphoinositide 3-kinase and extracellular signal-regulated kinase signaling in tip cells in vivo. Our results suggest a previously unidentified neurovascular cross-talk mediated by Apelin signaling that is important for tip cell function during sprouting angiogenesis.


Figures

Fig. 1.
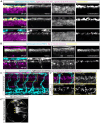
Fig. 1.. During sprouting of the ISVs, apln is expressed in a subpopulation of cells in the dorsal neural tube.
(A) Still images taken from a time-lapse video of TgBAC(apln:Venus-PEST); Tg(kdrl:HsHRAS-mCherry) embryos. apln:Venus-PEST expression is detectable in cells in the neural tube. Arrowheads point toward apln:Venus-PEST expression in ECs. (B) Confocal projections of Tg(aplnrb:aplnrb-tagRFP-sfGFP); Tg(kdrl:HsHRAS-mCherry) embryos at indicated time points. aplnrb:aplnrb-tagRFP-sfGFP expression is detectable in ECs. (C) Confocal projections of TgBAC(apln:Venus-PEST); Tg(kdrl:HsHRAS-mCherry). Tip cells contact apln:Venus-PEST–expressing neural cells (arrows). Yellow lines indicate transverse (1 and 2) or frontal sections (3). Scale bars: 30 μm [(A) and (B)], 20 μm (C), and 10 μm [magnifications 1 to 3 in (C)].
Fig. 2.
Fig. 2.. During sprouting of the ISVs, apln is expressed in dorsal neural progenitors in the neural tube.
(A) Confocal projections of TgBAC(gfap:GAL4FF); Tg(UAS-E1B:NTR-mCherry); TgBAC(apln:Venus-PEST) transgenic embryos. apln:Venus-PEST expression is detectable in gfap:GAL4FF; UAS-E1B:NTR-mCherry–expressing cells (colocalization channel). Only gfap:GAL4FF–expressing cells retain apln:Venus-PEST signal until 56 hpf. (B) Confocal projections of TgBAC(apln:Venus-PEST); Tg(−2.1zic2b:mCherry) double transgenic embryos. apln:Venus-PEST expression is detectable in zic2b:mCherry–expressing cells (colocalization channel). (C) Confocal projection of a Tg(kdrl:TagBFP); TgBAC(apln:Cre-ERT2); Tg(−3.5ubb:loxP-EGFP-loxP-mCherry) transgenic embryo at 120 hpf. Recombination was induced from 25 to 30 hpf by adding 4-OHT. Regions for magnification are marked by the yellow dashed box. N = 6 embryos. (C′) Arrowheads point toward mCherry-expressing ECs. Note the positive neurons in the margin and the positive progenitors in the center of the neural tube. (C″) Transverse section of the neural tube of a TgBAC(apln:Cre-ERT2); Tg(−3.5ubb:loxP-EGFP-loxP-mCherry) embryo at 120 hpf. Arrows point to projections of radial glia cells; arrowhead marks ventrally extending projection of radial glia-like roof plate cells; asterisks mark neurons. Scale bars: 30 μm [(A) and (B)], 20 μm (C), and 10 μm [(C′) and (C″)].
Fig. 3.
Fig. 3.. Neural progenitor cell–derived Apelin drives tip cell elongation and DLAV formation.
(A) Schematic model of the tissue-specific apln expression rescue experiment. (B and E) Confocal projections of Tg(kdrl:gfp) (B) or Tg(fli1a:EGFP) (E) embryos. (B) apln overexpression in Tg(hsp70l:apln) leads to defects in the formation of the DLAV (asterisks) and is unable to rescue DLAV formation in apln mutants (asterisks) at 32 hpf. The heat shock was performed at 24 hpf. (C) Percentage of ISVs that formed at least one DLAV connection. P values calculated by ANOVA with Kruskal-Wallis test. (D) Percentage of ISVs displaying one of the three indicated vessel phenotypes. P values calculated by ANOVA with Tukey’s test can be found in fig. S7I. [(C) and (D)] Sibling control, N = 35 embryos; aplnmu267/mu2677 control, N = 15 embryos; sibling hsp70l:apln, N = 33 embryos; aplnmu267/mu2677 hsp70l:apln, N = 14 embryos; six ISVs per embryo from four experiments (E). Vascular expression of apln, by using Tg(fli1a:GAL4FF); Tg(UAS:LIFEACT-EGFP); Tg(UAS:apln) embryos, only partially rescues the dorsal migration of tip cells but not DLAV formation (asterisks) in apln mutants. Neural expression of apln, by using Tg(zic2b:GAL4-VP16); Tg(UAS:apln) embryos, rescues the dorsal migration of tip cells and DLAV formation (asterisks) in apln mutants. (F) Percentage of ISVs that formed at least one DLAV connection. P values calculated by ANOVA with Kruskal-Wallis test. (G) Percentage of ISVs displaying one of the three indicated vessel phenotypes. P values calculated by ANOVA with Tukey’s test can be found in fig. S7I. [(F) and (G)] Control, N = 19 embryos; neural overexpression, N = 10 embryos; vascular overexpression, N = 19 embryos; six ISVs per embryo from ≥2 experiments. Scale bars: 30 μm.
Fig. 4.
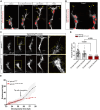
Fig. 4.. Apelin signaling drives endothelial tip cell elongation.
(A to C) Confocal maximum intensity projections of sprouting ISVs. (A) Still images taken from a time-lapse video of Tg(fli1a:GAL4FF); Tg(UAS:LIFEACT-EGFP); Tg(kdrl:NLS-mCherry) embryos. During sprouting, the tip cells exhibit four characteristic morphological stages (I to IV). Arrows point toward the leading edge/dominant filopodium; arrowheads mark the nucleus of the tip cell. (B) High-resolution image of stage II of an embryo expressing Tg(kdrl:EGFP-CAAX) and Tg(kdrl:NLS-mCherry). Arrows point toward long filopodia. (C) Still images of time-lapse videos comparing sprouting of tip cells in wild-type and aplnrbmu281/mu281 ISVs expressing Tg(kdrl:EGFP-CAAX). Regions for magnification are marked by the yellow dashed box. (C′ and C″) Arrows point to filopodia. (D) Filopodia length in aplnrbmu281/mu281 in comparison to siblings in dorsal (45° to 90° relative to the DA) and lateral (0° to 45° relative to the DA) directions. Siblings, n = 111 filopodia from N = 13 embryos; aplnrbmu281/mu281, n = 39 filopodia from N = 9 embryos. (E) Dorsal displacement of tip cells from 23 to 28 hpf in wild-type and aplnrbmu281/mu281 embryos. Wild-type, n = 10 ISVs; aplnrbmu281/mu281, n = 7 ISVs. Outline is the SD. Scale bars: 20 μm [(A) and (C)] and 10 μm [(B), (C′), and (C″)].
Fig. 5.
Fig. 5.. Tip cells elongate by the transformation of the long filopodia into the cell body.
(A) Still images taken from a time-lapse video of a sprouting ISV expressing Tg(kdrl:EGFP-CAAX); Tg(kdrl:NLS-mCherry) depicting tip cell elongation by filopodia widening. Regions for magnification are marked by the yellow dashed box. N = 3 embryos. (B) Confocal projections of aplnrbwt/wt or aplnrbmu281/mu281 embryos expressing Tg(fli1a:ARPC1B-mVenus) and Tg(kdrl:Hsa.HRAS-mCherry). ARPC1B-mVenus localization in dominant long filopodia (arrows). aplnrbwt/wt, N = 4 embryos; aplnrbmu281/mu281, N = 4 embryos. (C) Still images taken from a time-lapse video of a sprouting tip cells expressing Tg(fli1a:GAL4FF); Tg(UAS:LIFEACT-EGFP; Tg(kdrl:NLS-mCherry). Arrows point toward protrusions. Protrusions of tip cells in aplnrb mutants retract. (D) Quantification of protrusions formed and retracted by tip cells in embryos from confocal time-lapse movies recorded between 23 and 30 hpf (control) or 30 and 39 hpf (aplnrbmu281/mu281). Control, N = 4 embryos; aplnrbmu281/mu281, N = 3 embryos; four ISVs per embryo. (E) Still images taken from a time-lapse video of Tg(kdrl:myl9a-EGFP) embryos in wild-type and aplnrbmu281/mu281 embryos. Arrows point toward the protrusions of the tip cell. aplnrbmu281/mu281 embryos exhibit a high myl9a-EGFP localization in retracting protrusions. Wild-type, n = 8 ISVs of N = 4 embryos; aplnrbmu281/mu281, n = 9 ISVs of N = 3 embryos. Regions for magnification are marked by the yellow dashed box. Scale bars: 20 μm [(A), (B), (C), and (E)], 10 μm [magnification in (E′) and (E″)], and 5 μm [magnification in (A)].
Fig. 6.
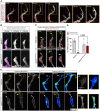
Fig. 6.. Apelin signaling induces tip-stalk cell asymmetry.
(A) Tip cell division in aplnrbwt/wt and aplnrbmu281/mu281; Tg(kdrl:NLS-mCherry); Tg(kdrl:HsHRAS-mCherry) embryos. (B) Plasmid design. (C) Single labeled tip cells in siblings and aplnrbmu281/mu281 embryos. Color-coded for cell volume. (D) Postdivision cell volumes of daughter tip and stalk cells. Siblings, n = 3 tip cells of N = 3 embryos; aplnrbmu281/mu281, n = 4 tip cells of N = 4 embryos; P value calculated by two-tailed t test. (E) Still images of a time-lapse video of Tg(fli1aep:ERK-KTR-Clover); Tg(kdrl:NLS-mCherry) embryos, comparing ERK activity in tip cells of aplnrbwt/wt and aplnrbmu281/mu281 embryos during cell division. Arrows point to nuclei. Color-coded for nuclear intensity. (F) Nuclear ERK-KTR intensity during tip cell divisions. n = 7 tip cell divisions of N = 4 embryos; aplnrbmu281/mu281, n = 9 tip cell divisions of N = 6 embryos. (F) Relative postdivision intensity of daughter tip/stalk cells. P value calculated by two-tailed t test. (F′) Absolute nuclear ERK-KTR intensities postdivision normalized to predivision intensity. P values calculated by ANOVA with Tukey’s test. (G) Still images taken from a time-lapse video of sprouting ISVs from wild-type or aplnrbmu281/mu281 embryos expressing Tg(kdrl:EGFP-CAAX); Tg(kdrl:NLS-mCherry). Numbers indicate initial cell nuclei order (1: tip cell nucleus). (H) Frequency that the tip cell is overtaken by a stalk cell at least once during ISV sprouting. Siblings, n = 3 embryos; aplnrbmu281/mu281, n = 6 embryos; four to six ISVs per embryo. P value calculated by Mann-Whitney test. The division plane is marked by white line [(A) and (C)]. Scale bars: 20 μm [(C), (E), and (H)] and 10 μm (A).
Fig. 7.
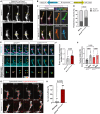
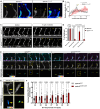
Fig. 7.. Apelin signaling drives sprouting via PI3K and ERK in vivo.
(A) Confocal projections of the ISVs of Tg(fli1a:PH-AKT-EGFP) aplnrbwt/wt or aplnrbmu281/mu281 embryos. Yellow lines indicate regions for line graph measurements (B), and arrows point toward the cell edge. (B) Line graph measurements comparing the PH-AKT-EGFP signal in aplnrbwt/wt and aplnrbmu281/mu281 embryos. The relative intensity was normalized to the average intensity across the line. Lines display the mean value; the faint outlines the SDs. aplnrbwt/wt, n = 4 tip cells of N = 3 embryos; aplnrbmu281/mu281 embryos, n = 3 tip cells of N = 2 embryos. (C) Confocal projections of Tg(fli1a:EGFP) aplnrbwt/wt and aplnrbwt/mu281 embryos treated from 20 to 42 hpf with 15 μM LY294002 or DMSO. Asterisks mark missing DLAV segments. (D) Quantification of the vascular phenotype of (C). DMSO aplnrbwt/wt, N = 15 embryos; aplnrbwt/mu281, N = 24 embryos; P values determined by ANOVA with Tukey’s test. (E) Still images taken from time-lapse videos of a sprouting ISV of Tg(fli1aep:ERK-KTR-Clover); Tg(kdrl:NLS-mCherry) aplnrbwt/wt and aplnrbmu281/mu281 embryos. Arrows point to the nuclei of the tip cell. Masked nuclei channel color-coded for intensity. Regions for magnification are marked by the yellow dashed box (E′). (F) Quantification of nuclear ERK intensity aplnrbwt/wt mutants and aplnrbmu281/mu281 mutants from 24 to 30 hpf. aplnrbwt/wt, n = 21 tip cells of N = 7 embryos; aplnrbmu281/mu281 embryos, n = 37 tip cells of N = 11 embryos. P values determined by ANOVA with Bonferroni correction. Scale bars: 30 μm (C) and 20 μm [(A), (E), and (E′)].
Fig. 8.
Fig. 8.. Model of Apelin signaling–mediated neurovascular cross-talk that controls tip cell behavior.

References

    1. Gerhardt H., Golding M., Fruttiger M., Ruhrberg C., Lundkvist A., Abramsson A., Jeltsch M., Mitchell C., Alitalo K., Shima D., Betsholtz C., VEGF guides angiogenic sprouting utilizing endothelial tip cell filopodia. J. Cell Biol. 161, 1163–1177 (2003). - PMC - PubMed
    1. Jakobsson L., Franco C. A., Bentley K., Collins R. T., Ponsioen B., Aspalter I. M., Rosewell I., Busse M., Thurston G., Medvinsky A., Schulte-Merker S., Gerhardt H., Endothelial cells dynamically compete for the tip cell position during angiogenic sprouting. Nat. Cell Biol. 12, 943–953 (2010). - PubMed
    1. Phng L. K., Stanchi F., Gerhardt H., Filopodia are dispensable for endothelial tip cell guidance. Development 140, 4031–4040 (2013). - PubMed
    1. Nasevicius A., Larson J., Ekker S. C., Distinct requirements for zebrafish angiogenesis revealed by a VEGF-A morphant. Yeast 1, 294–301 (2000). - PMC - PubMed
    1. Bussmann J., Bos F. L., Urasaki A., Kawakami K., Duckers H. J., Schulte-Merker S., Arteries provide essential guidance cues for lymphatic endothelial cells in the zebrafish trunk. Development 137, 2653–2657 (2010). - PubMed

Publication types

MeSH terms

LinkOut - more resources