. 2024 Aug 22;187(17):4713-4732.e19.
doi: 10.1016/j.cell.2024.06.012. Epub 2024 Jul 4.

Progestogen-driven B7-H4 contributes to onco-fetal immune tolerance

Affiliations

Progestogen-driven B7-H4 contributes to onco-fetal immune tolerance

Jiali Yu et al. Cell. .

Abstract

Immune tolerance mechanisms are shared in cancer and pregnancy. Through cross-analyzing single-cell RNA-sequencing data from multiple human cancer types and the maternal-fetal interface, we found B7-H4 (VTCN1) is an onco-fetal immune tolerance checkpoint. We showed that genetic deficiency of B7-H4 resulted in immune activation and fetal resorption in allogeneic pregnancy models. Analogously, B7-H4 contributed to MPA/DMBA-induced breast cancer progression, accompanied by CD8+ T cell exhaustion. Female hormone screening revealed that progesterone stimulated B7-H4 expression in placental and breast cancer cells. Mechanistically, progesterone receptor (PR) bound to a newly identified -58 kb enhancer, thereby mediating B7-H4 transcription via the PR-P300-BRD4 axis. PR antagonist or BRD4 degrader potentiated immunotherapy in a murine B7-H4+ breast cancer model. Thus, our work unravels a mechanistic and biological connection of a female sex hormone (progesterone) to onco-fetal immune tolerance via B7-H4 and suggests that the PR-P300-BRD4 axis is targetable for treating B7-H4+ cancer.

Keywords: B7-H4; BRD4; T cell exhaustion; cancer; enhancer; immune checkpoint; immunotherapy; onco-fetal immune tolerance; pregnancy; progesterone.


Conflict of interest statement

Declaration of interests W.Z. has served as a scientific advisor or consultant for Cstone, NextCure, and Hanchorbio. S. Wang is a co-founder and paid consultant of Ascentage Pharma Group International and owns stock in Ascentage. L.C. has been a scientific founder, consultant, and/or board observer for NextCure, Normunity, Tayu, Zai Lab, Tpioneer, Vcanbio, OncoC4, and GenomiCare and has sponsored research funds from NextCure, Normunity, and DynamiCure. This research is conducted independently and has not received resources from and is unrelated to the scientific and commercial pursuits of these industrial entities, including NextCure.

Figures
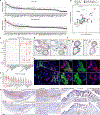
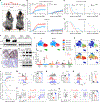
Figure 1.
Figure 1.. B7-H4 is an onco-fetal immune tolerance checkpoint.
(A and B) Gene expression score (Z-score) of B7 family members, TNF family members, Major Histocompatibility Complex (MHC) molecules, and other typical inhibitory and co-stimulatory molecules in tumor and trophoblast cells (Datasets see STAR Methods). Average scores from multiple datasets were shown in (B). (C) Gene expression of VTCN1 and CD274 in different immune cell subsets across different cancers (TISCH2). (D) Gene expression of VTCN1 across different cancers in The Cancer Genome Atlas (TCGA) data. (E-G) Representative immunohistochemistry (IHC) (E and F) and multiplex IHC (G) staining of CDH1, B7-H4, SDC1, and HLA-G in human first-trimester products of conception (POCs). Scale bar, 50 μm. (H) Representative IHC staining of B7-H4 in mouse placenta. Scale bar, 1 mm. Data are presented as mean ± SD (A). Each dot represents a dataset (C) or a tumor sample (D) for violin plots. See also Figure S1.
Figure 2.
Figure 2.. B7-H4 supports maternal-fetal immune tolerance.
(A and B) Allogenic mating strategy for WT (n = 34) and B7-H4−/− C57BL/6 (n = 32) with male BALB/c mice. Representative images of healthy and absorbed fetuses (A, arrows), and statistical data (B). (C) The number of surviving pups from setup in (A). WT, n = 29 litters; B7-H4−/−, n = 31 litters. (D-F) Representative IHC staining of CD8 (D and E) and immune phenotyping of CD8+ T cells (F) at the maternal-fetal interface of healthy and resorbed fetuses from the B7-H4−/− mating group. (E) Healthy, n = 16; resorbed, n = 16. (F) Healthy, n = 32; resorbed, n = 9. Scale bar, 1 mm. (G) IFN-γ+CD8+ T cells in uterus-draining lymph nodes from pregnant WT (n = 8) and B7-H4−/− (n = 8) mice. (H and I) Frequency of Ly49D+ and Ly49H+ NK cells in placental and decidual tissues from pregnant WT (n = 26) and B7-H4−/− (n = 11) mice. (J) Mating strategy and statistics for RAG1−/−B7H4+/+ (n = 17) and RAG1−/−B7H4−/− (n = 19) mice mated with male BALB/c mice. (K) Effect of CD4 and CD8 depletion on fetus resorption in female B7-H4−/− mice mated with male BALB/c mice. IgG (n = 27), anti-CD8 (n = 17) or anti-CD4 (n = 10). (L and M) Representative IHC (L) and multiplex IHC (M) staining of B7-H4, HLA-G, CD8, and CD3 in human first-trimester POCs. Arrow: CD8+CD3+ T cells. Scale bars, 20 μm. (N and O) Female CBA/J B7-H4−/ mice mated male C57BL/6 B7-H4+/− mice. Comparison of fetus resorption between B7-H4+/− and B7-H4−/− fetuses from the same uterus (O). (P and Q) Strategy for embryo transfer and representative images of the resorbed fetus (arrows) (P). Statistical data were pooled from 4 independent experiments (Q). WT embryos were collected from n=30 WT (B6) mice and transferred to n=9 recipient CBA/J mice. B7H4−/− embryos were collected from n=35 B7H4−/− (B6) mice and transferred to n=14 recipient CBA/J mice. Data are presented as violin plots (B-G, J, K, O), mean ± SD (H, I), min to max (Q). Each dot represents a litter (B, C, J, K, O, Q), a mouse (G), a fetus (E, F, H, I), or a high magnification field (M). ****p < 0.0001; ***p < 0.001; **p < 0.01; *p < 0.05; ns, not significant; by unpaired t test (B-J, Q), one-way ANOVA (K, compared to IgG) and paired t test (O). See also Figure S2.
Figure 3.
Figure 3.. Progesterone promotes B7-H4 expression in cancer and placenta.
(A) B7-H4 expression in T-47D treated with different hormones. FSH, follicle-stimulating hormone; LH, luteinizing hormone; hCG, human chorionic gonadotropin; hPL, human placental lactogen. (B and C) B7-H4 expression in T-47D cells treated with medroxyprogesterone acetate (MPA) and levonorgestrel (LNG). (D) Western blot of T-47D cells treated with progesterone (0, 1, 10, 100 nM) and the indicated concentrations of RU486. (E) Western blot of JEG-3 cells treated with progesterone from 0, 1, 10, 100, 500, 1000 nM. (F and G) B7-H4 expression in primary human endometrial epithelial cells (HEECs) and mouse endometrial epithelial cells (MEECs) treated with 100 nM progesterone. (H and I) B7-H4 protein levels in MEEC isolated from mice treated either with vehicle (n = 17) or RU486 (n = 13). (J) VTCN1 gene expression in breast cancer tissues from patients treated with RU486 (GSE212690). Cells were treated for 48 hours in vitro. Representative data from three independent experiments are shown (A-I). Each dot represents an individual mouse (I). **p < 0.01; by unpaired t test (I). See also Figure S3.
Figure 4.
Figure 4.. B7-H4 promotes breast cancer progression by inhibiting CD8+ T cells.
(A-G) The spontaneous breast cancer model induced by MPA plus DMBA (A). The number of evaluable tumor nodules per mouse (B), tumor growth curves (C), tumor-free survival (D), and overall survival (E) were presented. Western blot and IHC staining of B7-H4 from the indicated tumor samples (F and G). MFP, mammary fat pad; T, tumor. WT, MPA plus DMBA, n = 22; B7-H4−/−, MPA plus DMBA, n = 23; WT, DMBA, n = 14; B7-H4−/−, DMBA, n = 12. (H) Western blot of MPA-treated 4H11 and 3E10, clones derived from primary tumor cells from (A). (I-K) CyTOF analysis of cells isolated from tumors in WT or B7-H4−/− mice. Subsets of CD8+ T cells (I) and statistics are shown (J). UMAP plots showing PD-1 and TIM-3 expression in concatenated WT and B7-H4−/− samples (K). WT, n = 9 tumors; B7-H4−/−, n = 5 tumors. (L) The spontaneous breast cancer model in RAG1−/−B7-H4+/+ (n=9) and RAG−/−B7-H4−/− (n = 8) mice. (M-Q) Coculture of OT-I cells with B7-H4+/+ (sgCTRL) or B7-H4−/− (BKO) 4H11 tumor cells. The proliferation (M), transcription factor expression (N, O), cytokine expression (P, Q) of OT-I cells were examined by flow cytometry. Data are presented as mean ± SEM (B, C, L), violin plot (J) or mean ± SD (M-Q). ****p < 0.0001; ***p < 0.001; *p < 0.05; ns, not significant; by two-way ANOVA (B, C, L), log-rank test (D, E, L), unpaired t test (J), or one-way ANOVA (M-Q). See also Figure S4.
Figure 5.
Figure 5.. PR signaling promotes B7-H4 transcription via binding to the −58kb enhancer.
(A) mRNA level of B7-H4 in T-47D cells treated with 100 nM progesterone for 24 hours. (B and C) PR ChIP-seq signal tracks and enrichment scores at the indicated region in T-47D cells. (D) H3K27ac, H3K4me1, H3K4me3 ChIP-seq and ATAC-seq signal tracks in T-47D cells. (E) Hi-C and H3K27ac ChIP-seq signal tracks in T-47D cells treated with R5020. (F) 3C-qPCR for the promoter and putative enhancers in T-47D cells with or without progesterone treatment. P3 is the anchor primer. (G) Luciferase-reporter assay in HEK293T showing increased transcription by adding the putative enhancer to the promoter region. (H) B7-H4 expression after progesterone treatment (100 nM) in T-47D clones with or without −58 kb enhancer region. (I) H3K27ac and PR ChIP-seq signal tracks in ZR-75–1 cells. (J) H3K27ac ChIP-seq signal tracks in human cancer tissues. (K) H3K27ac and H3K4me1 ChIP-seq and ATAC-seq signal tracks in human placental tissues. (L) PR ChIP-seq in human endometrium. (M) ATAC-seq signal tracks in different human placental cells. Tracks are shown in the same data range. (N) Cicero analysis of co-accessibility score between −58 kb enhancer and the B7-H4 promoter region in trophoblast cells. All datasets used are listed in the STAR Method. ****p < 0.0001; by unpaired t test. See also Figure S5.
Figure 6.
Figure 6.. Progesterone promotes B7-H4 expression via the PR-P300-BRD4 axis.
(A-D) P300 (A and B) and H3K27ac (C and D) ChIP-seq signal tracks and enrichment scores in T-47D cells. (E-G) B7-H4 expression in T-47D cells with indicated treatments. 50 nM progesterone, 4 μM L002 and 500 nM CCS1477 were used in (G). (H) BRD4 ChIP-seq signal tracks in T-47D cells. (I-K) B7-H4 expression in T-47D cells. 50 nM progesterone, 1000 nM JQ1 and 1000 nM ARV-825 were used in (J). (L and M) B7-H4 expression in 4H11 cells. (N and O) B7-H4 expression in JEG-3 cells. (P and Q) B7-H4 expression in HEECs (RSRSR#01441) cells. Cells were treated for 48 hours. Representative data from three independent experiments are shown (E-G, and I-Q). Data are presented as mean ± SD (B). **p < 0.01; *p < 0.05; by one-way ANOVA. See also Figure S6.
Figure 7.
Figure 7.. Targeting the regulatory axis of B7-H4 potentiates ICB efficacy.
(A-C) Syngeneic tumors were established with primary tumor cells derived from MPA+DMBA breast cancer model. Mice were treated with RU486, anti-PD-L1, or their combination. Tumor growth curves (A and B) and mouse survival (C) were presented. n = 16 tumors per group. (D-L) Syngeneic tumors were established as in (A). Mice were treated with BD-9136, anti-PD-L1, or their combination. B7-H4 expression in tumors treated with or without BD-9136 (D and E). Tumor growth (F), CyTOF analysis of tumor-infiltrating immune cells (H and I), IHC staining of CD8 (J and K), and cytokine production of tumor-infiltrating CD8+ T cells (L) were presented. Data are presented as mean ± SEM (A, F and K) and violin plots (E, I and L). Each dot represents an individual tumor sample (E, I and L) or a high magnification filed (K). ****p < 0.0001; ***p < 0.001; **p < 0.01; *p < 0.05; ns, not significant; by two-way ANOVA (A, F), log-rank test (C), unpaired t test (E), and one-way ANOVA (I, K and L; compared to Vehicle + IgG). See also Figure S7.

References

    1. Topalian SL, Drake CG, and Pardoll DM (2015). Immune checkpoint blockade: a common denominator approach to cancer therapy. Cancer Cell 27, 450–461. 10.1016/j.ccell.2015.03.001. - DOI - PMC - PubMed
    1. Zou W, Wolchok JD, and Chen L (2016). PD-L1 (B7-H1) and PD-1 pathway blockade for cancer therapy: Mechanisms, response biomarkers, and combinations. Sci Transl Med 8, 328rv324. 10.1126/scitranslmed.aad7118. - DOI - PMC - PubMed
    1. Ribas A, and Wolchok JD (2018). Cancer immunotherapy using checkpoint blockade. Science 359, 1350–1355. 10.1126/science.aar4060. - DOI - PMC - PubMed
    1. Sharma P, Hu-Lieskovan S, Wargo JA, and Ribas A (2017). Primary, Adaptive, and Acquired Resistance to Cancer Immunotherapy. Cell 168, 707–723. 10.1016/j.cell.2017.01.017. - DOI - PMC - PubMed
    1. Zou W (2005). Immunosuppressive networks in the tumour environment and their therapeutic relevance. Nature Reviews Cancer 5, 263–274. 10.1038/nrc1586. - DOI - PubMed

MeSH terms

LinkOut - more resources