. 2024 Jul 5;15(7):483.
doi: 10.1038/s41419-024-06869-2.

Phase separation of RNF214 promotes the progression of hepatocellular carcinoma

Affiliations

Phase separation of RNF214 promotes the progression of hepatocellular carcinoma

Zheng-Jie He et al. Cell Death Dis. .

Abstract

Hepatocellular carcinoma (HCC) is one of the most common malignant tumors, and the expression and function of an uncharacterized protein RNF214 in HCC are still unknown. Phase separation has recently been observed to participate in the progression of HCC. In this study, we investigated the expression, function, and phase separation of RNF214 in HCC. We found that RNF214 was highly expressed in HCC and associated with poor prognosis. RNF214 functioned as an oncogene to promote the proliferation, migration, and metastasis of HCC. Mechanically, RNF214 underwent phase separation, and the coiled-coil (CC) domain of RNF214 mediated its phase separation. Furthermore, the CC domain was necessary for the oncogenic function of RNF214 in HCC. Taken together, our data favored that phase separation of RNF214 promoted the progression of HCC. RNF214 may be a potential biomarker and therapeutic target for HCC.


Conflict of interest statement

The authors declare no competing interests.

Figures
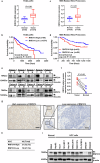
Fig. 1
Fig. 1. RNF214 is overexpressed in HCC and correlates with unfavorable prognosis.
a The mRNA levels of RNF214 between HCC and normal in the TCGA database were shown (normal n = 50, tumor n = 374, two-tailed Student’s t-test). b The overall survival curves for HCC patient groups with high and low RNF214 expression from TCGA databases were shown (n = 373, Kaplan–Meier survival curve analysis). c The protein levels of RNF214 between HCC and normal in HBV-related HCC proteome databases were shown (n = 150, two-tailed Student’s t-test). d The overall survival curves for HCC patient groups with high and low RNF214 expression from HBV-related HCC proteome databases were shown (n = 150, Kaplan–Meier survival curve analysis). e, f The protein levels and quantification of RNF214 in ten sets of HCC tissues and their paired normal tissues were displayed (n = 10, two-tailed Student’s t-test). g, h The protein levels and quantification of RNF214 were measured by IHC including 40 HCC patients, and representative images were presented. The scale bar is 100 μm. i The protein levels of RNF214 in normal hepatocyte MIHA and HCC cells (HepG2, Huh7, SK-HEP-1, Hep-3B, MHCC97H, MHCC97L, PLC/PRF/5, SNU387, and SNU449) were shown. The n represents the number in each group. The bar graph data are presented as the mean ± SD. The p value < 0.05 indicates statistical significance.
Fig. 2
Fig. 2. Knockout of RNF214 inhibits HCC proliferation.
a, b The protein levels in the corresponding cells were displayed. c, d Cell number growth of the selected cells was estimated with MTT assay (n = 3, one-way ANOVA). e, f The typical images and quantitative data of the displayed colony numbers were calculated by colony formation assay (n = 3, one-way ANOVA). gl The indicated subcutaneous tumors were shown as well as the quantification of tumor weight and volume (n = 5 for BALB/c nude mice, one-way ANOVA). The n represents the number of biologically independent experiments in each group. The bar graph data are presented as the mean ± SD. The p value < 0.05 indicates statistical significance.
Fig. 3
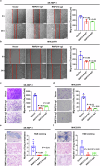
Fig. 3. Knockout of RNF214 inhibits HCC migration and metastasis.
a, b Graphical illustration and quantification of cell migration were taken via wound healing test. The scale bar is 250 μm (n = 3, one-way ANOVA). c, d Graphical illustration and quantification of cell migration were assessed by transwell assay. Scale bar is 100 μm (n = 4, one-way ANOVA). e, f Graphical illustration and quantitative analysis of pulmonary metastasis in the selected lung tissue sections were performed with hematoxylin and eosin staining. Scale bar is 100 μm (n = 5, one-way ANOVA). The n represents the number of biologically independent experiments in each group. The bar graph data are presented as the mean ± SD. The p value < 0.05 indicates statistical significance.
Fig. 4
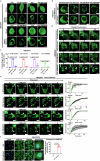
Fig. 4. RNF214 undergoes phase separation.
ac Venus and Venus-RNF214 transfected HEK293T cells were viewed and quantified after treatment with 0.4 M sorbitol, 10% sucrose, 10% PEG8000, or 125 mM NaCl for 10 min and 2% 1,6-hexanediol for another 3 min (n = 3, at least 100 cells, two-tailed Student’s t-test). d Observation of the puncta fusion. e Observation of the puncta after the fluorescence bleaching. Scale bar is 10 μm. f The endogenous RNF214 in MHCC97H cells was observed and quantified with immunofluorescence assay after treatment with 250 mM NaCl for 10 min. Blue represented DAPI and green represented endogenous RNF214 (n = 3, at least 100 cells, two-tailed Student’s t-test). Low magnification picture scale bar are 50 μm, and high magnification picture scale bar are 10 μm. The n represents the number of random fields of view in each group. The bar graph data are presented as the mean ± SD. The p value < 0.05 indicates statistical significance.
Fig. 5
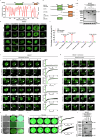
Fig. 5. The CC domain of RNF214 mediates its phase separation.
a RNF214 protein domain and protein disorder region predicted by PONDR were shown. b The schematic representation of RNF214 truncations was shown. c The protein levels in the indicated cells were shown. d, e HEK293T cells transfected with Venus, Venus-RNF214 full-length, and truncations were observed and quantified after being treated with 0.4 M sorbitol for 10 min and 2% 1,6-hexanediol for another 3 min (n = 3, at least 100 cells, two-tailed Student’s t-test). The n represents the number of random fields of view in each group. The bar graph data are presented as the mean ± SD. The p value < 0.05 indicates statistical significance. f Observation of the puncta fusion. g Observation of the puncta after the fluorescence bleaching. Scale bar = 10 μm. h, i Observation of the puncta of purified proteins (EGFP-RNF214, EGFP-CC, and EGFP-ΔCC) after the fluorescence bleaching in vitro. Scale bar = 20 μm. j HEK293T cells were transfected with Venus-RNF214 and full-length or truncated forms of GST-tagged RNF214 (amino acids 1–206, 207–410, 411–657, and 658–703), followed by GST pull-down assays.
Fig. 6
Fig. 6. The CC domain is required for RNF214 to enhance HCC proliferation.
a, b The protein levels in the selected cells were displayed. c, d Cell number growth of the selected cells was estimated with MTT assay (n = 3, one-way ANOVA). e, f The typical images and quantitative data of the shown cell colonies were measured by colony formation assay (n ≥ 3, one-way ANOVA). gl Representative images of the displayed subcutaneous tumors as well as quantification of tumors weight and volume were demonstrated (n = 5 for BALB/c nude mice, one-way ANOVA). The n represents the number of biologically independent experiments in each group. The bar graph data are presented as the mean ± SD. The p value < 0.05 indicates statistical significance.
Fig. 7
Fig. 7. The CC domain is critical for RNF214 to enhance HCC migration and metastasis.
a, b Representative illustrations and quantification of displayed cell migration were taken via wound healing test. Scale bar is 250 μm (n ≥ 3, one-way ANOVA). c, d Representative illustrations as well as quantification of the displayed cell migration were detected by transwell assay. Scale bar is 100 μm (n = 4, one-way ANOVA). e, f Representative illustrations and quantification of lung metastasis in the displayed lung sections were detected by hematoxylin and eosin staining, scale bars are 100 μm (n = 5, one-way ANOVA). The n represents the number of biologically independent experiments in each group. The bar graph data are presented as the mean ± SD. The p value < 0.05 indicates statistical significance.

Similar articles

Cited by

References

    1. Zhao YG, Zhang H. Phase separation in membrane biology: the interplay between membrane-bound organelles and membraneless condensates. Dev Cell. 2020;55:30–44. doi: 10.1016/j.devcel.2020.06.033. - DOI - PubMed
    1. Xiao Q, McAtee CK, Su X. Phase separation in immune signalling. Nat Rev Immunol. 2022;22:188–99. doi: 10.1038/s41577-021-00572-5. - DOI - PMC - PubMed
    1. Banani SF, Lee HO, Hyman AA, Rosen MK. Biomolecular condensates: organizers of cellular biochemistry. Nat Rev Mol Cell Biol. 2017;18:285–98. doi: 10.1038/nrm.2017.7. - DOI - PMC - PubMed
    1. Mehta S, Zhang J. Liquid-liquid phase separation drives cellular function and dysfunction in cancer. Nat Rev Cancer. 2022;22:239–52. doi: 10.1038/s41568-022-00444-7. - DOI - PMC - PubMed
    1. Borcherds W, Bremer A, Borgia MB, Mittag T. How do intrinsically disordered protein regions encode a driving force for liquid-liquid phase separation? Curr Opin Struct Biol. 2021;67:41–50. doi: 10.1016/j.sbi.2020.09.004. - DOI - PMC - PubMed

MeSH terms

Substances

LinkOut - more resources