. 2024 Jul 5;15(1):5654.
doi: 10.1038/s41467-024-49908-4.

CNS-wide repopulation by hematopoietic-derived microglia-like cells corrects progranulin deficiency in mice

Affiliations

CNS-wide repopulation by hematopoietic-derived microglia-like cells corrects progranulin deficiency in mice

Pasqualina Colella et al. Nat Commun. .

Abstract

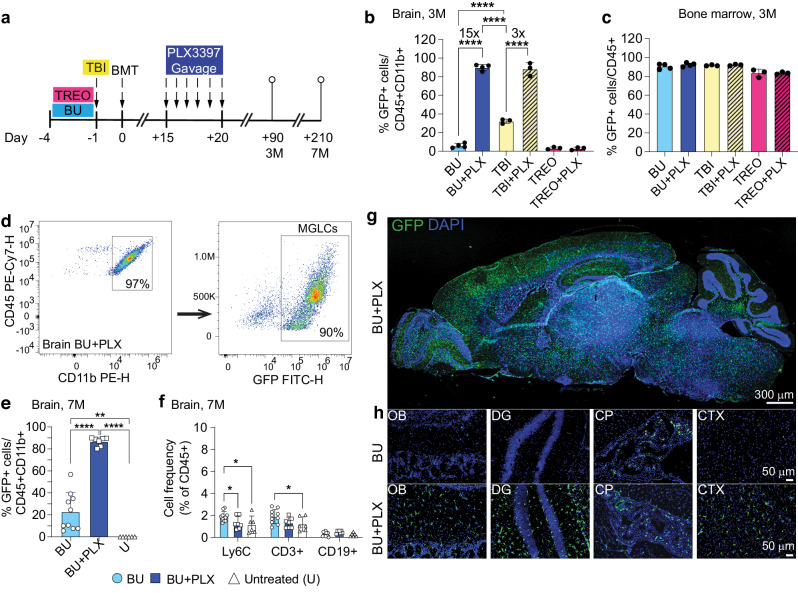
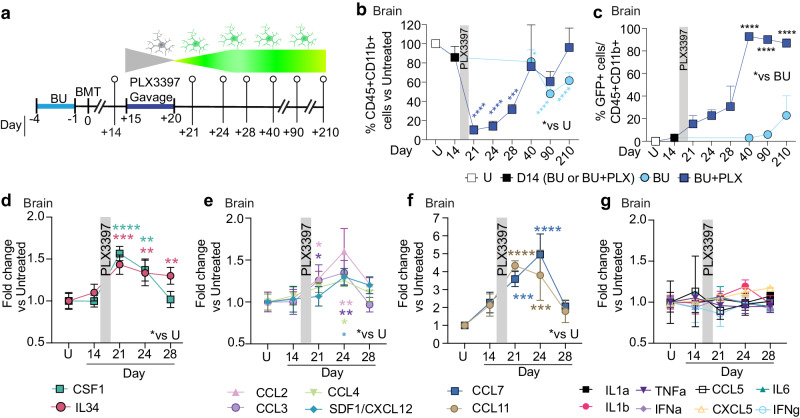
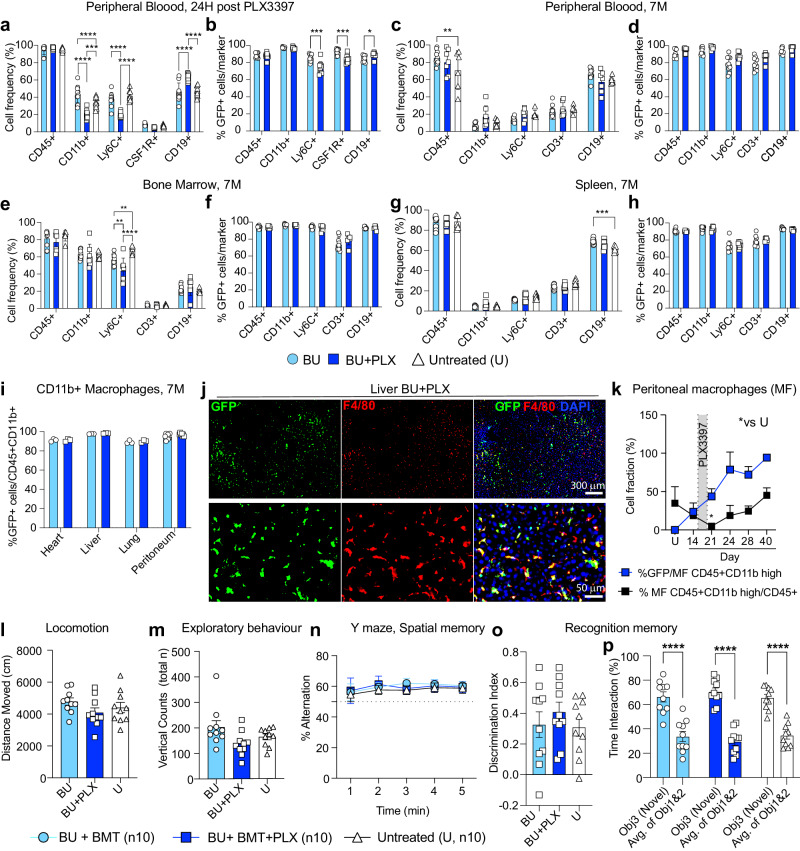
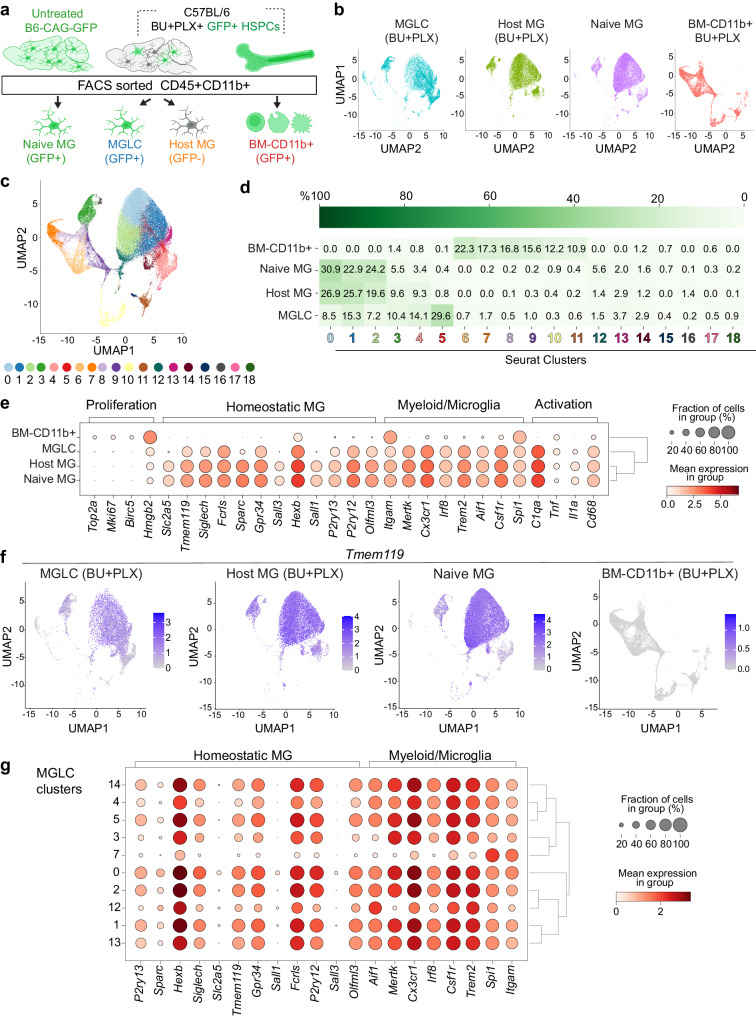
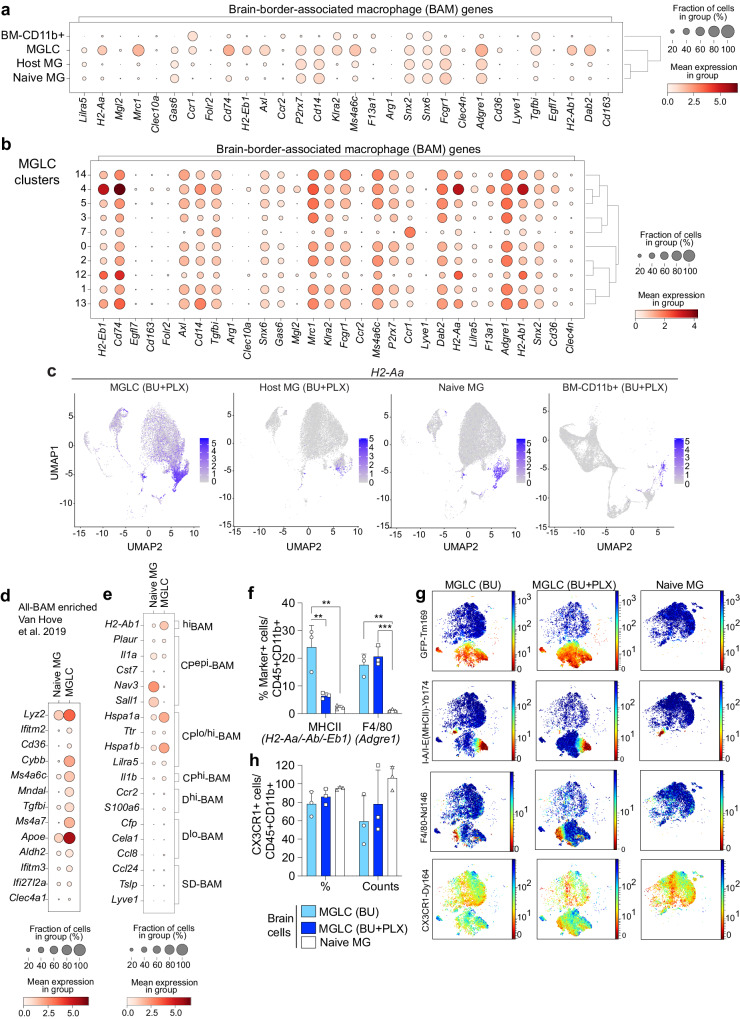
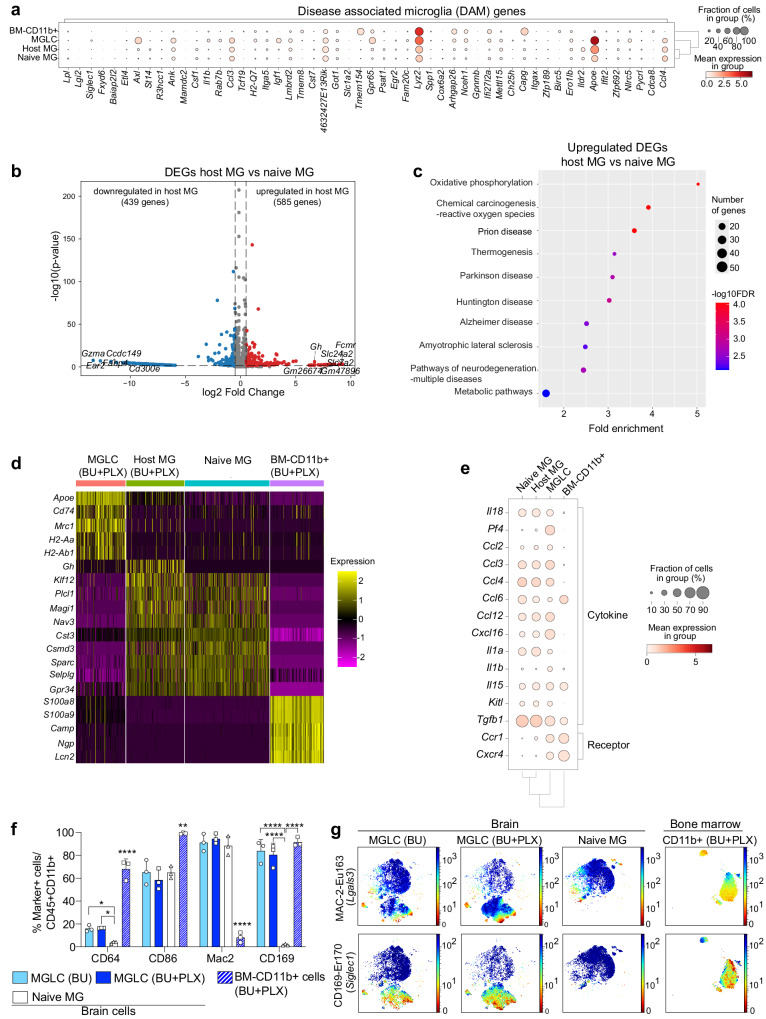
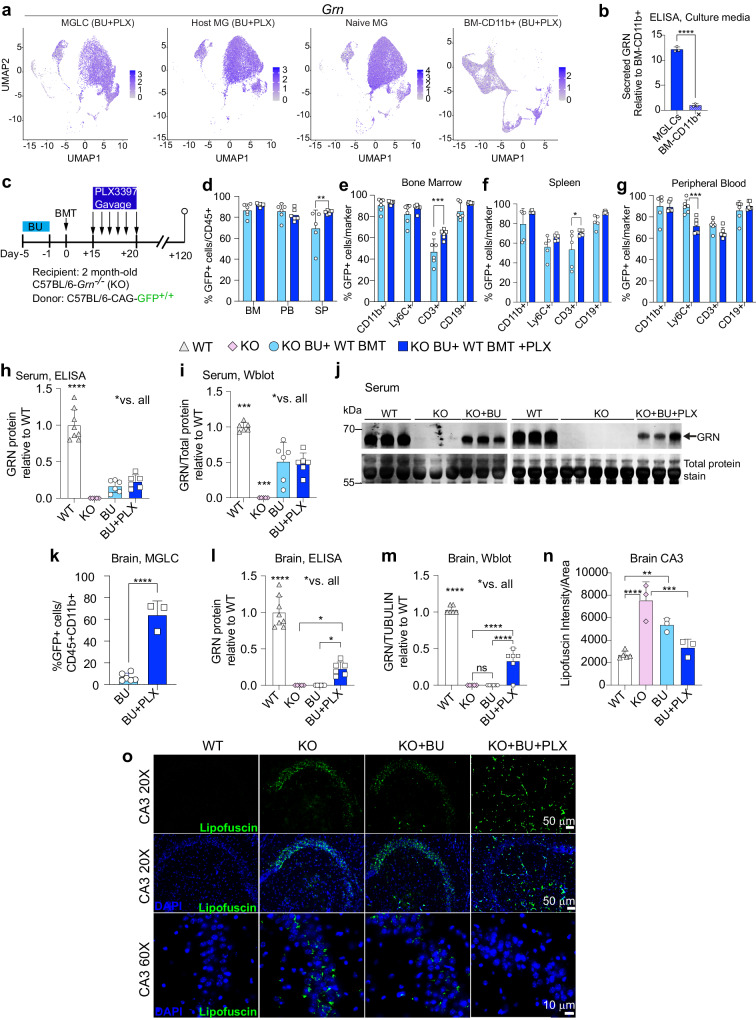
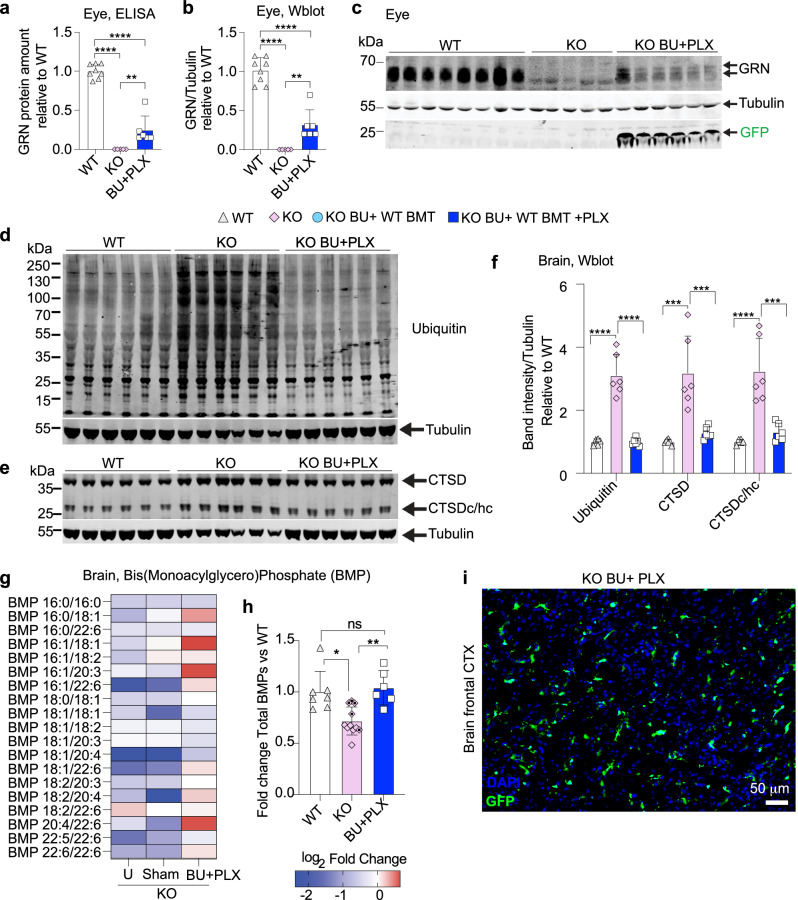
Hematopoietic stem cell transplantation can deliver therapeutic proteins to the central nervous system (CNS) through transplant-derived microglia-like cells. However, current conditioning approaches result in low and slow engraftment of transplanted cells in the CNS. Here we optimized a brain conditioning regimen that leads to rapid, robust, and persistent microglia replacement without adverse effects on neurobehavior or hematopoiesis. This regimen combines busulfan myeloablation and six days of Colony-stimulating factor 1 receptor inhibitor PLX3397. Single-cell analyses revealed unappreciated heterogeneity of microglia-like cells with most cells expressing genes characteristic of homeostatic microglia, brain-border-associated macrophages, and unique markers. Cytokine analysis in the CNS showed transient inductions of myeloproliferative and chemoattractant cytokines that help repopulate the microglia niche. Bone marrow transplant of progranulin-deficient mice conditioned with busulfan and PLX3397 restored progranulin in the brain and eyes and normalized brain lipofuscin storage, proteostasis, and lipid metabolism. This study advances our understanding of CNS repopulation by hematopoietic-derived cells and demonstrates its therapeutic potential for treating progranulin-dependent neurodegeneration.


Conflict of interest statement

The authors declare no competing interests.

Figures

Fig. 1
Fig. 1. A six-day course of PLX3397 enhances the replacement of microglia by bone marrow-derived MGLCs.
a Experimental timeline: conditioning of adult C57BL/6 mice with total body irradiation (TBI), busulfan (BU) or treosulfan (TREO) combined or not with PLX3397 (PLX) by oral gavage 15 days post bone marrow transplant (BMT). Adult homozygous C57BL/6-CAG-GFP mice were used as bone marrow donors. The time points of the analysis are 3 months (3 M) or 7 months (7 M) post-BMT. b–f, Flow cytometry analyses. b Fraction of transplant-derived GFP+ microglia-like cells (MGLCs) measured in the brain 3 M post-BMT. c Fraction of transplant-derived GFP+ cells measured in the bone marrow (BM) 3 M post-BMT. a, b BU n = 4, BU + PLX n = 4, TBI n = 3, TBI + PLX n = 3, TREO n = 3, TREO + PLX n = 3. d Representative flow plots of CD45 + CD11b+ cells (left panel, gated on total CD45+ cells) and transplant-derived GFP+ MGLCs (right panel) measured in the brain 7 M post-BMT. e Fraction of transplant-derived GFP+ MGLCs in the brain 7 M post-BMT; U: Untreated mice. f Fractions of Ly6C + , CD3 + , and CD19+ cells in the brain of mice 7 M post-BMT, and in untreated mice. e-f BU n = 10, BU + PLX n = 7, U n = 6. g Sagittal section of the brain from a mouse treated with BU + PLX + BMT and analyzed 7 M post-BMT (image representative of n = 7 mice). h Representative images of transplant-derived GFP+ cells repopulating the olfactory bulb (OB), dentate gyrus (DG), choroid plexus (CP), and cortex (CTX) of mice conditioned with BU alone (top) or BU + PLX (bottom) and analyzed 7 M post-BMT; images representative of n = 4 mice/group. gh Scale bars are depicted. b, c, ef Data are Mean ± SD. Source data are provided as a Source Data file. Statistical analysis: *p < 0.05, **p < 0.01, ***p < 0.001, ****p < 0.0001, the exact p-values of all comparisons are reported in the Source Data file; b, e, f One-way ANOVA with Tukey post-hoc; c Kruskal–Wallis test with Dunn’s. GFP: green fluorescent protein; DAPI: 4’,6-diamidino-2-phenylindole.
Fig. 2
Fig. 2. A six-day course of PLX3397 accelerates MGLCs repopulation and induces specific cytokines in the brain.
a Experimental timeline showing sampling time points after BU or BU + PLX and CAG-GFP BMT in C57BL/6 mice. bc Flow cytometry analyses. b Fraction of CD45 + CD11b+ cells/total CD45+ cells measured in the brain of mice at the indicated time points (a). The quantification and statistics are relative to untreated mice (*p-value vs U). Asterisks: p-value BU vs U (light blue), p-value BU + PLX vs U (dark blue). c Fraction of GFP+ microglia-like cells (MGLCs) in the brain at the indicated time points (a). The statistics compare BU vs BU + PLX. bc U n = 3; BU day 14 n = 3, day 40 n = 4; BU + PLX n = 3 from day 21 to day 40. c The data points for days 90 and 270 are plotted from the experiments described in Fig. 1b and 1e, respectively: BU day 90 n = 4, day 270 n = 10; BU + PLX day 90 n = 4, day 270 n = 7. dg Serial cytokine analysis performed on whole brain lysates by 48-plex Luminex or ELISA assays (IL34 and SDF-1/CXCL12) at the depicted time points (a), n = 3 mice per time point. Cytokine quantifications and statistics are relative to untreated mice (*p-value vs U). The asterisk’s color matches the cytokine legend. bg Gray bar: PLX3397 administration window. bg Data are Mean ± SD. Source data are provided as a Source Data file. Statistical analysis: *p < 0.05, **p < 0.01, ***p < 0.001, ****p < 0.0001, the exact p-values of all comparisons are reported in the Source Data file; b One-way ANOVA vs Untreated with Dunnett post-hoc. c Two-way ANOVA with Sidak post-hoc (BU vs. BU + PLX day 40, day 90, day 210); d–g Two-way ANOVA vs Untreated with Dunnett post-hoc. Figure 2a artwork was created with BioRender.com released under a Creative Commons Attribution-NonCommercial-NoDerivs 4.0 International license.
Fig. 3
Fig. 3. Normal hematopoietic reconstitution and neurobehavior following busulfan myeloablation and a six-day PLX3397 regimen.
ab Analysis of peripheral blood (PB) 24 hours after PLX withdrawal [equivalent to 21 days after bone marrow transplant (BM)]; BU n = 10, BU + PLX n = 10; Untreated n = 10. Analysis of PB c, d, bone marrow (ef), and spleen (gh) 7 months (7 M) after BMT; BU n = 10, BU + PLX n = 7, Untreated n = 6. i Donor macrophage chimerism in peripheral organs and peritoneum 7 M after BMT. Peritoneum BU n = 10, BU + PLX n = 7; Heart, liver, and lung n = 3 mice/cohort. j Representative images of GFP + F4/80+ macrophages repopulating the liver after BU + PLX (7 M post-BMT). Images representative of n = 3 mice. Scale bars are depicted. k Kinetics of host macrophage depletion and transplant-derived macrophage repopulation in the peritoneum measured by flow cytometry. The experimental timeline is depicted in Fig. 2a, n = 3 mice/cohort; *p-value vs untreated mice (U). lp Behavioral analyses performed between 6 and 7 months post-BMT; BU n = 10, BU + PLX n = 10, Untreated n = 10. l Spontaneous locomotion (activity chamber). m Exploratory behavior (activity chamber) reported by total vertical counts (periphery + center). n Spatial memory (Y-maze). op Recognition memory (Novel object recognition) reported by discrimination index and interaction time with Novel object (Obj 3) and previously encountered objects 1 and 2 (Avg. of Obj 1 & 2). ak Data are Mean ± SD. l–p Data are Mean ± SE. ak, lp Source data are provided as a Source Data file. Statistical analysis: *p < 0.05, **p < 0.01, ***p < 0.001, ****p < 0.0001, the exact p-values of all comparisons are reported in the Source Data file; a, c, e, g, l, n Two-way ANOVA with Tukey post-hoc correction; b, d, f, h, i Two-tailed multiple unpaired t-test with Holm-Sidak post-hoc; k One-way ANOVA vs Untreated with Dunnett post-hoc; m, o Kruskal–Wallis with Dunn’s post-hoc; p Two-way ANOVA with Tukey post-hoc (Obj3 vs treatment group; Avg. of Obj 1&2. vs treatment group) and two-way ANOVA with Sidak post-hoc (Obj3 vs Avg. of Obj. 1&2). GFP: green fluorescent protein; DAPI: 4’,6-diamidino-2-phenylindole.
Fig. 4
Fig. 4. Single-cell transcriptional analyses of CD45 + CD11b+ cells from the brain and bone marrow show the heterogeneity of MGLCs and the activation of microglia genes in the brain.
a Experimental design. Single-cell RNA sequencing (scRNA-seq) was performed on FACS-sorted CD45 + CD11b+ cells isolated from mice that underwent busulfan plus PLX3397 (BU + PLX) conditioning and hematopoietic stem and progenitor cell (HSPC) transplantation as reported in Supplementary Fig. 4. Nine months after transplant (day 270), we compared four samples: 1) GFP + CD45 + CD11b+ (MGLCs, n = 3 mice), 2) GFP- CD45 + CD11b+ (host conditioned MG or host MG, n = 3 mice), 3) GFP + CD45 + CD11b+ from bone marrow (BM-CD11b + , n = 3 mice), and 4) GFP + CD45 + CD11b+ MG from untreated age- and sex- matched donor mice (naive MG, n = 3 mice). b Uniform Manifold Approximation and Projection (UMAP) showing the clustering of MGLC, host MG, naive MG, and BM-CD11b + . c, d Seurat cluster analyses of MGLCs, host-MG, naive MG, and BM-CD11b+ cells. Each cluster is indicated by a color and a number. d Heatmap showing each sample’s mean cell fraction per cluster (n = 3 mice/sample). e Dot plot showing the differential gene expression of microglia signature genes in each sample (n = 3 mice/sample). The dot size indicates the percentage of cells expressing the gene in each sample/cluster, while the color scale represents the mean gene expression calculated as the mean log-normalized UMI counts for each gene of interest. Dendrograms at the right show the clustering of the samples based on the expression profiles of the depicted genes. f UMAP showing the expression of the microglia-specific Tmem119 gene in each sample (n = 3 mice/sample). g Dot plot showing the differential expression of microglia signature genes in the MGLC clusters (n = 3 mice/sample). Source data are provided as a Source Data file. Figure 4a artwork was created with BioRender.com released under a Creative Commons Attribution-NonCommercial-NoDerivs 4.0 International license.
Fig. 5
Fig. 5. MGLCs upregulate genes characteristic of brain-border-associated macrophages (BAM).
ae Single-cell RNA sequencing (scRNA-seq) analyses of samples depicted in Fig. 4a (day 270 after transplant, n = 3 mice/sample). a Dot plot showing the expression of genes characteristic of brain-border-associated macrophages (BAMs) in each sample. Dot size: percentage of cells expressing the gene, color scale: mean gene expression calculated as the mean log-normalized UMI counts. Dendrograms show sample clustering. b Dot plot showing the expression of BAM genes in MGLCs. c Uniform Manifold Approximation and Projection (UMAP) showing the expression of the H2-Aa gene in each sample. Scale: mean gene expression (mean log-normalized UMI counts). d Dot plot showing the expression of BAM-enriched signature genes, reported by Van Hove et al. (GSE128855), in the MGLCs and naive MG samples (GSE261246, this work). e Dot plot showing expression of selected top differentially expressed genes (DEGs) among BAM subpopulations in the MGLC and naive MG samples. Dura BAM: D-BAM; subdural meninges BAM: SD-BAM; choroid plexus BAM: CP-BAM. The top ten DEGs in D-BAM, SD-BAM, and choroid CP-BAM were computed using the scRNA-seq data generated by Van Hove et al. (Macrophage aggregate, GSE128855). fh Expression of BAM and myeloid markers evaluated by CyTOF mass cytometry in cells isolated seven months after bone marrow transplant (study depicted in Fig. 1 and Fig. 3). Groups: mice conditioned with either busulfan [MGLC (BU), n = 3] or BU + PLX3397 [MGLC (BU + PLX), n = 3] and untreated mice (naive MG, n = 3). f Percentage of CD45 + CD11b+ cells positive for the major histocompatibility complex (MHCII + ) and F4/80 markers (genes in brackets). g Optimized Stochastic Neighbor Embedding (Opt-SNE) plots showing the expression of GFP, MHCII, F4/80, and CX3CR1 in MGLCs and naive MG. h Fraction of CD45 + CD11b+ cells expressing CX3CR1 and CX3CR1 mean staining intensity/cell (counts). f, h Data are reported as Mean ± SD. Source data are provided as a Source Data file. Statistical analyses: **p < 0.01, ***p < 0.001, the exact p-values of all comparisons are reported in the Source Data file; one-way ANOVA with Tukey post-hoc for each marker.
Fig. 6
Fig. 6. Lack of DAM signature in MGLCs and long-term alterations in host microglia induced by busulfan.
ae Single-cell RNA sequencing (scRNA-seq) analyses for samples depicted in Fig. 4a (day 270 after transplant, n = 3 mice/sample). a Dot plot showing the expression of disease-associated microglia (DAM) genes (≥ 3-fold upregulation in DAM vs naive microglia, Keren-Shaul, et al.) in each sample. b Volcano plot showing the differentially expressed genes (DEGs) in host MG vs naive MG. The top 5 downregulated and upregulated gene names and Growth hormone (Gh) are indicated. c Pathway enrichment analyses (top ten) based on DEGs upregulated in host MG vs naive MG. Dot size: number of genes in each pathway; color scale: -log10 False Discovery Rate (FDR). FDR lower than 0.05 is considered statistically significant. d Heatmap showing top 5 DEGs between all samples. Scale = z-score. Each subcolumn depicts a single cell. e Dot plot showing the expression of genes encoding for cytokine and cytokine receptors in each sample. fg Expression of brain-infiltrating monocyte-derived cells (MdCs) and brain-associate macrophages (BAMs) markers by high-dimensional CyTOF mass cytometry in cells isolated from brain and bone marrow (BM) of mice 7 months after bone marrow transplant. Groups: mice conditioned with either BU [MGLC (BU), n = 3] or BU + PLX3397 [MGLC (BU + PLX), n = 3 and BM-CD11b+ (BU + PLX), n = 3], untreated mice (naive MG, n = 3 mice). f Percentage of CD45 + CD11b+ cells positive for CD64, CD86, MAC-2, and CD169. g Optimized Stochastic Neighbor Embedding (Opt-SNE) plots showing the expression of MAC-2 and CD169 (gene names in brackets). f Data are reported as Mean ± SD. Source data are provided as a Source Data file. Statistical analyses: *p < 0.05, **p < 0.01, ****p < 0.0001, the exact p-values of all comparisons are reported in the Source Data file; b Wald with Benjamini–Hochberg post-hoc; f One-way ANOVA with Tukey post-hoc for each marker. Asterisks without comparison lines indicate a statistically significant difference between all groups/markers.
Fig. 7
Fig. 7. Busulfan with PLX3397 is more effective than busulfan alone in reconstituting progranulin and correcting lipofuscinosis in the brain of a mouse model of CLN11/FTD.
a Uniform Manifold Approximation and Projection (UMAP) showing Grn mRNA levels in MGLCs, host MG, naive MG, and BM-CD11b+ populations (scRNA-seq study in Fig. 4a, n = 3 mice/sample). b GRN secretion by ELISA in the media of MGLCs and BM-CD11b+ isolated from mice conditioned with BU + PLX and cultured side-by-side (study in Fig. 4a, n = 3 mice/sample). c Experimental timeline: C57BL/6-Grn−/− (KO) mice conditioned with busulfan (BU) or BU + PLX3397 (PLX) and transplanted with bone marrow from C57BL/6-CAG-GFP (WT BMT). Comparisons: wild-type C57BL/6 mice (WT, n = 8); disease controls, KO untreated (U, n = 6) or KO conditioned with BU and transplanted with KO BMT (Sham, n = 5); KO conditioned with BU and transplanted with WT BMT (BU, n = 6); KO conditioned with BU + PLX and transplanted with WT BMT (BU + PLX, n = 6). dg Percentage of transplant-derived cells in hematopoietic compartments (BU and BU + PLX n = 6 mice/group). h GRN quantification by ELISA in serum [WT n = 8, KO n = 5, BU n = 6, BU + PLX n = 6]. ij GRN quantification by Western blot in serum [WT n = 6, KO n = 5, BU n = 6, BU + PLX n = 6]. Uncropped blots are included in the Source Data file. k Percentage of transplant-derived MGLCs in the brain of KO mice (BU n = 6, BU + PLX n = 3). l GRN quantification by ELISA in brain (WT n = 8, KO n = 6, BU n = 6, BU + PLX n = 6. m GRN quantification by Western blot in brain (WT n = 6, KO n = 5, BU n = 6, BU + PLX n = 6). Uncropped blots are in the Source Data file. n Quantification of lipofuscinosis in the CA3 region (WT n = 5, KO n = 3, BU n = 3, BU + PLX n = 3). o Representative images of lipofuscinosis in the CA3 region (representative of n = 5 WT, n = 3 KO, n = 3 BU, n = 3 BU + PLX). Scale bars are depicted. b, di, kn Data are Mean ± SD. Source data are provided as a Source Data file. Statistical analysis: **p < 0.01, ***p < 0.001, ****p < 0.0001, the exact p-values of all comparisons are reported in the Source Data file; b, k Two-tailed unpaired t-test; d–i, l–n One-way ANOVA with Tukey post-hoc.
Fig. 8
Fig. 8. Busulfan with PLX3397 reconstitutes progranulin in the eye and improves lipid metabolism and proteostasis in the brain of a mouse model of CLN11/FTD.
ai Analysis of 6-month-old Grn−/− (KO) mice and wild-type (WT) controls. The study scheme and timeline are depicted in Fig. 7c. Analyses 4 months after bone marrow transplant (BMT). a GRN quantification by ELISA assay in eye lysates (WT n = 8, KO n = 5, BU + PLX n = 6). bc GRN quantification by Western blot in eye lysates (WT n = 8, KO n = 5, BU + PLX n = 6). Tubulin was used as a loading control; the anti-GFP antibody detected the GFP protein expressed by transplant-derived cells. The uncropped blot is shown in c. df Analysis of proteostasis defects in KO mice. de Western blot analysis of ubiquitinated proteins, Cathepsin D (CTSD), and cleaved CTSD heavy chain (CTSDc/hc) in brain lysates (WT n = 6, KO n = 6, BU + PLX n = 6). Uncropped blots are shown in d and e. Tubulin was used as a loading control. f Quantification of ubiquitin and CTSD bands normalized by tubulin. gh Targeted quantification of Bis(Monoacylglycero)Phosphate (BMP) in whole brain homogenates derived from the frontal brain. BMP levels were normalized by the total amount of POPC (1-palmitoyl-2-oleoyl-sn-glycero-3-phosphocholine). g Heatmap showing the normalized average amounts of BMP species relative to WT mice. Absolute amounts of BMP species are reported in the Source data file. h Histogram showing the normalized amounts of total BMP species in control KO mice [KO Untreated (U), n = 5, and KO Sham (Sham) n = 6) and KO mice conditioned with BU + PLX and transplanted with WT BM (BU + PLX n = 6). Dotted diamonds indicate Sham KO mice. i Representative image of transplant-derived GFP+ cells in the frontal cortex (fCTX) of KO mice conditioned with BU + PLX. The natural GFP fluorescence is depicted. Scale bar 50 μm. The image is representative of n = 3 mice. a, b, f Data are Mean ± SD. Source data are provided as a Source Data file. Statistical analysis: *p < 0.05, **p < 0.01, ***p < 0.001, ****p < 0.0001, the exact p-values of all comparisons are reported in the Source Data file; a, b, f One-way ANOVA with Tukey post-hoc; h Kruskal–Wallis with Dunn’s post-hoc.

Update of

References

    1. Yabe H. Allogeneic hematopoietic stem cell transplantation for inherited metabolic disorders. Int J. Hematol. 2022;116:28–40. doi: 10.1007/s12185-022-03383-z. - DOI - PubMed
    1. Aubourg P, et al. Reversal of early neurologic and neuroradiologic manifestations of X-linked adrenoleukodystrophy by bone marrow transplantation. N. Engl. J. Med. 1990;322:1860–1866. doi: 10.1056/NEJM199006283222607. - DOI - PubMed
    1. Rocca CJ, et al. Transplantation of wild-type mouse hematopoietic stem and progenitor cells ameliorates deficits in a mouse model of Friedreich’s ataxia. Sci. Transl. Med. 2017;9:eaaj2347. doi: 10.1126/scitranslmed.aaj2347. - DOI - PMC - PubMed
    1. Wishnew J, et al. Umbilical cord blood transplantation to treat Pelizaeus-Merzbacher Disease in 2 young boys. Pediatrics. 2014;134:e1451–1457. doi: 10.1542/peds.2013-3604. - DOI - PubMed
    1. Hoogerbrugge PM, et al. Allogeneic bone marrow transplantation for lysosomal storage diseases. The European Group for Bone Marrow Transplantation. Lancet. 1995;345:1398–1402. doi: 10.1016/S0140-6736(95)92597-X. - DOI - PubMed

MeSH terms