. 2024 Aug;26(8):1309-1321.
doi: 10.1038/s41556-024-01411-0. Epub 2024 Jul 5.

An activity-specificity trade-off encoded in human transcription factors

Affiliations

An activity-specificity trade-off encoded in human transcription factors

Julian Naderi et al. Nat Cell Biol. 2024 Aug.

Abstract

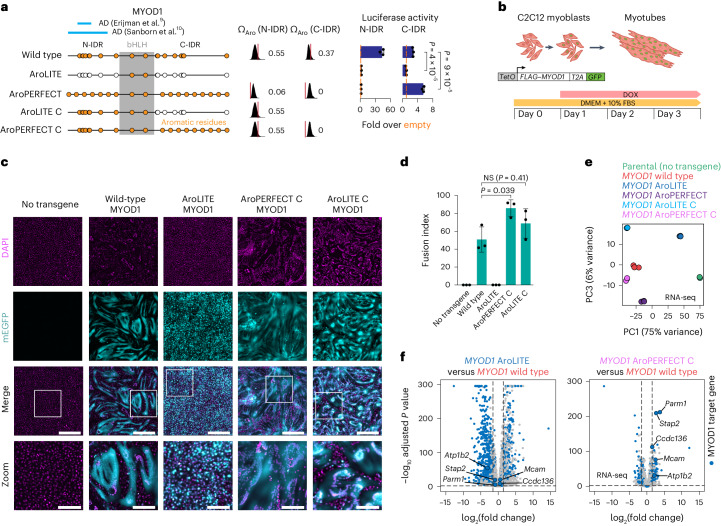
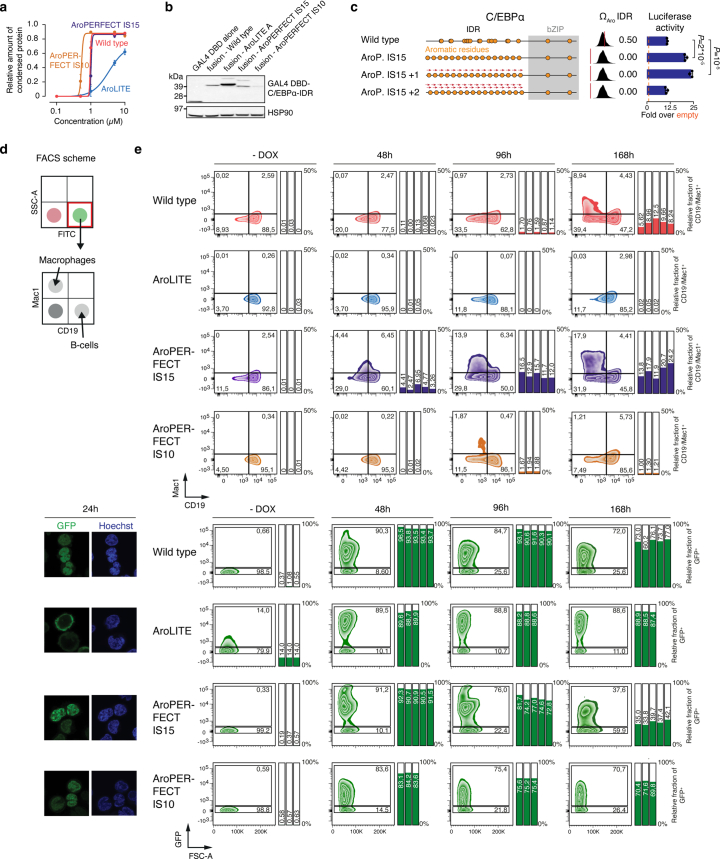
Transcription factors (TFs) control specificity and activity of gene transcription, but whether a relationship between these two features exists is unclear. Here we provide evidence for an evolutionary trade-off between the activity and specificity in human TFs encoded as submaximal dispersion of aromatic residues in their intrinsically disordered protein regions. We identified approximately 500 human TFs that encode short periodic blocks of aromatic residues in their intrinsically disordered regions, resembling imperfect prion-like sequences. Mutation of periodic aromatic residues reduced transcriptional activity, whereas increasing the aromatic dispersion of multiple human TFs enhanced transcriptional activity and reprogramming efficiency, promoted liquid-liquid phase separation in vitro and more promiscuous DNA binding in cells. Together with recent work on enhancer elements, these results suggest an important evolutionary role of suboptimal features in transcriptional control. We propose that rational engineering of amino acid features that alter phase separation may be a strategy to optimize TF-dependent processes, including cellular reprogramming.


Conflict of interest statement

The Max Planck Society has filed a patent application (EP23215195) based on the study. D.H. is a founder and scientific advisor of Nuage Therapeutics. The other authors declare no competing interests.

Figures

Fig. 1
Fig. 1. Traces of aromatic periodicity in human TF IDRs.
a, Model of a TF (top) and the method used to identify aromatic periodic blocks (bottom). b, The top 80 TFs ranked according to the IDR periodicity score. Ranks are shown in parentheses. The height of the bars in the outer circle is proportional to the periodicity score. The inner circles indicate whether the IDR contains a minimal activation domain (AD) identified in the four studies. c, Positioning of aromatic residues in NFAT5. Red dots indicate the position of aromatic residues in periodic block; yellow dots indicate the position of all other aromatic residues. d, Omega plot of the NFAT5 IDR. The empirical P value is reported. Red dots indicate aromatic residues, white dots indicate any other residue. e, Disorder plot (Metapredict; black) and AlphaFold2 pLDDT score (yellow) for HOXC4. f, Omega plots of the HOXC4 IDR (top) and the portion encoding the periodic aromatic block (bottom). The coordinates, ΩAro scores and the percentage of randomly generated sequences that have a lower ΩAro score than the actual sequence are provided. g, Representative images of droplet formation of purified recombinant HOXC4 IDR–mEGFP proteins. Scale bars, 5 μm. h, Relative amount of condensed protein in the droplet assays. Data are the mean ± s.d. of n = 10 images from two replicates. The curves were generated as nonlinear regressions to a sigmoidal curve function. i, Schematic (top) and results of luciferase reporter assays (bottom). The luciferase values were normalized to an internal Renilla control and the values are displayed as percentages of the activity measured using an empty vector. Data are the mean ± s.d. of n = 3 biological replicates. P values are from two-sided unpaired Student’s t-tests. j, Pipeline for the identification of regions with significant periodicity. k, Density plot of protein regions with significant periodicity. The length of the region is plotted against the lowest P value from the K–S test within the region. The depth of the colour is proportional to the density of the dots. The numbers of proteins that contain a region with significant periodicity over the total number of proteins in each category are shown. l, Omega scores of IDRs in various protein classes. P values are from one-way analysis of variance with Tukey’s multiple comparisons post test. For the box plots, the centre line shows the median, the bounds of the box correspond to interquartile (25th–75th) percentile, and whiskers extend to Q3 + 1.5× the interquartile range and Q1 − 1.5× the interquartile range; the dots beyond the whiskers show Tukey’s fences outliers. m, Schematic models of prion-like domains (PLDs) and TF IDRs, and their omega scores. Source data
Fig. 2
Fig. 2. Increasing aromatic dispersion in TF IDRs enhances transactivation.
a, Schematic models of HOXD4 IDRs (left). Aromatic residues (orange dots) and alanine mutations (white dots) are highlighted. Additionally introduced tyrosines are also shown as red dots. Omega plots of the HOXD4 IDRs and ΩAro scores (middle). Results of luciferase reporter assays (right). Data are from three biological replicates. b, Representative images of droplet formation of purified HOXD4 IDR–mEGFP fusion proteins at the indicated concentrations in droplet formation buffer. Scale bars, 5 μm. c, Relative amount of condensed protein per concentration quantified in the droplet formation assays. Data are the mean ± s.d. of n = 15 images from three replicates. The curves were generated as nonlinear regressions to a sigmoidal curve function. d, Fluorescence intensity of wild-type and AroPERFECT HOXD4 in vitro droplets before, during and after photobleaching. Data are the mean ± s.d. of n = 20 images from two replicate imaging experiments. e, Results of a HOXD4 IDR tiling experiment using luciferase reporter assays. Sequences were tiled into fragments of 40 amino acids with 20-amino-acid overlaps. The activities of the full-length IDRs are indicated with dashed horizontal lines. A predicted activation domain (AD) in the HOXD4 wild-type IDR is highlighted (light blue bar). Luciferase activity is reported as the fold change relative to cells transfected with empty vector. f, Results of luciferase reporter assays of the indicated HOXD4 IDR constructs. The position of the 40-mer tile containing the AD in e is illustrated. Data are from three biological replicates. g, Schematic models of synthetic sequences (left); tyrosine residues are highlighted (orange dots). Results of luciferase reporter assays (right). Data are from two (bottom) or three (top) biological replicates. a,eg, Luciferase values were normalized to an internal Renilla control and the values are displayed as percentages normalized to the activity measured using an empty vector. Data are the mean ± s.d. *P < 0.05, **P < 0.01 and ***P < 1 × 10−3; two-sided unpaired Student’s t-test.
Fig. 3
Fig. 3. Evidence for gain-of-function of periodic HOXD4 mutants in vivo.
a, Differential interference contrast (DIC) microscopy of the indicated cell lines (top). Representative fluorescence microscopy images of cell nuclei (bottom). The fusion proteins were visualized using anti-GFP immunofluorescence in fixed cells. Dashed white lines represent the nuclear contour. Scale bars, 0.4 mm (DIC microscopy) and 10 μm (fluorescence microscopy). b, Representative images of HAP1 HOXD4 wild type–mEGFP, HOXD4 AroPERFECT–mEGFP and HOXD4 AroPLUS–mEGFP nuclei after 24 h of HOXD4 expression. The fusion proteins were visualized using mEGFP fluorescence in fixed cells. The number of individual nuclei per condition is provided. Scale bar, 5 μm. a,b, The normalized signal intensity was calculated by dividing the s.d. of the mEGFP signal of each nucleus by the corresponding mean mEGFP signal. c, Granularity scores of nuclei with the corresponding mean nuclear mEGFP intensities. Data are the mean ± s.d. of n = 536 (wild-type), 565 (AroPERFECT) and 504 (AroPLUS) nuclei pooled from two independent replicates. a.u., arbitrary units. d, Principal component (PC) analysis of the RNA-seq expression profiles of parental HAP1, HOXD4-knockout and the indicated knock-in HAP1 cell lines. e, Differential expression analysis of HOXD4 AroPERFECT–mEGFP and HOXD4 AroPLUS–mEGFP versus HOXD4 wild type–mEGFP HAP1 cells. P values were determined using the Benjamini–Hochberg method. f, Western blot analysis of HOXD4–mEGFP, IFI16 and ARHGAP4 in the indicated cell lines. HOXD4–mEGFP proteins were probed with anti-GFP. HSP90 was used as the loading control. HOXD4 targets (blue dot) and non-HOXD4 targets (red dot) are highlighted. g, Schematic model of the condensate tethering system (left). Fluorescence images of ectopically expressed YFP–RNAPII CTD in live U2OS cells cotransfected with the indicated cyan fluorescent protein (CFP)–LacI-HOXD4 IDR fusion constructs (right). The dashed line represents the nuclear contour. Inserts: magnified views of the regions in the red boxes. Scale bars, 10 μm (main images) and 40 μm (inserts). h, Relative YFP signal intensity in the tether foci. Data are the mean ± s.d. of n = 50 (wild-type YFP and wild-type YFP–RNAPII CTD), 51 (AroPERFECT YFP) and 53 (AroPERFECT YFP–RNAPII CTD) nuclei pooled from two independent replicates. c,h, P values are from two-sided unpaired Student’s t-tests; NS, not significant. Source data
Fig. 4
Fig. 4. Optimizing aromatic dispersion in C/EBPα enhances transactivation.
a, Schematic models of wild-type and mutant C/EBPα proteins (left). The positions of the bZIP DBD (grey box) and aromatic residues (orange dots) are indicated. Omega plots and ΩAro scores (middle). Results of luciferase reporter assays (right). Data are the mean ± s.d. of n = 3 biological replicates with three technical replicates each. b, Representative images of droplet formation of purified C/EBPα IDR–mEGFP fusion proteins at the indicated concentrations in droplet formation buffer. Scale bars, 5 μm. c, Fluorescence intensity of C/EBPα wild type, AroLITE and AroPERFECT IS15 IDR in in vitro droplets before, during and after photobleaching. Data are the mean ± s.d. of n = 15 (wild-type) and 14 (AroPERFECT IS15 and AroPERFECT IS10) droplets from two replicates. d, Fluorescence images of ectopically expressed YFP–RNAPII CTD in live U2OS cells that were cotransfected with the indicated CFP–LacI-C/EBPα IDR fusion constructs. The dashed line represents the nuclear contour. Inserts: magnified views of the regions in the red boxes. Scale bars, 10 μm (main images) and 40 μm (inserts). e, Relative YFP signal intensity in the tether foci. Data are the mean ± s.d. of n = 51 (wild-type YFP, AroPERFECT YFP and wild-type YFP–RNAPII CTD) and 56 (AroPERFECT YFP–RNAPII CTD) nuclei pooled from two independent replicates. f, Results of a C/EBPα IDR tiling experiment using luciferase reporter assays. C/EBPα wild type and AroPERFECT IS15 IDR sequences were tiled into fragments of 40 amino acids with 20-amino-acid overlaps. The activities of the full-length IDRs are indicated with dashed horizontal lines. g, Results of luciferase reporter assays of the indicated IDR constructs. a,f,g, Luciferase values were normalized to an internal Renilla control and the values are displayed as percentages normalized to the activity measured using an empty vector. f,g, Data are the mean ± s.d. of n = 3 biological replicates. a,e,g, P values are from a two-sided unpaired Student’s t-tests.
Fig. 5
Fig. 5. Optimizing aromatic dispersion in C/EBPα enhances macrophage reprogramming, and leads to stronger and more promiscuous genomic binding.
a, Schematic models of wild-type and mutant C/EBPα proteins. The transactivation data are identical to the data displayed in Fig. 4a. P values are from two-sided unpaired Student’s t-tests. b, Schematic model of C/EBPα-mediated transdifferentiation of B cells to macrophages. c, FACS quantification of GFP+ RCH-rtTA cells encoding C/EBPα overexpression cassettes. The proportions of CD19 Mac1+ cells were measured 48, 96 and 168 h after transgene induction. Data are the mean ± s.d. of n = 5 (wild type and AroPERFECT IS15) and 3 (AroLITE and AroPERFECT IS10) independent experiments. d, Graph-based clustering (uniform manifold approximation and projection, UMAP) of the scRNA-seq data of C/EBPα-mediated transdifferentiation. Clusters were annotated based on marker genes. Overlayed is the partition-based graph abstraction (PAGA) showing the cell trajectory based on dynamic modelling of RNA velocity. Inset: pseudotime plot. e, Proportion of mEGFP+ cells in the macrophage clusters (colour-coded as in d). f, Heatmap representation of ChIP–Seq read densities of wild-type and AroPERFECT IS15 C/EBPα within a 1.5-kb window around all shared C/EBPα peaks and differentially enriched peaks in AroPERFECT IS15 C/EBPα. ‘Peaks unique to IS15 and reported before’ denotes binding sites differentially enriched in IS15 binding that overlap C/EBPα peaks reported in previous literature. FE, fold enrichment. g, Enrichment scores of bZIP TF motifs and adjusted (adj.) P values of enrichment at the three indicated peak sets. P values were determined using the Benjamini–Hochberg method. h,j, AroPERFECT IS15 C/EBPα shows enhanced binding at the FAM98A (h) and GBP5 (j) loci. Displayed are genome browser tracks of ChIP–Seq data of C/EBPα 24 and 48 h after C/EBPα induction. The coordinates are hg38 genome assembly coordinates. i,k, UMAPs coloured on FAM98A (i) and GBP5 (k) expression. The numbers denote the mean ± s.d. expression in the whole samples. l, Luciferase assays using the indicated reporter plasmids cotransfected with expression vectors encoding either wild-type or AroPERFECT IS15 C/EBPα. Luciferase values were normalized to an internal Renilla control and the values are displayed as percentages of the activity measured using the ‘basic’ vector. Data are the mean ± s.d. of four biological replicates. P values are from two-sided unpaired Student’s t-tests.
Fig. 6
Fig. 6. Optimizing aromatic dispersion in NGN2 enhances neural differentiation.
a, Schematic models of wild-type and mutant NGN2 proteins (left). The positions of the bHLH DBD (grey box) and aromatic amino acids (yellow dots) are indicated. Omega plots and ΩAro scores (right). b, Fluorescence intensity of NGN2 wild-type and AroPERFECT IDR in in vitro droplets before, during and after photobleaching. Data are the mean ± s.d. of n = 20 droplets pooled from two independent replicates. c, Schematic model of the NGN2-mediated human iPSC-to-neuron differentiation experiment. ROCKi, Rho-kinase inhibitor. d, Representative fluorescence microscopy images of differentiating human iPSCs expressing the indicated NGN2 proteins. Hoechst dye was used as a nuclear counterstain; mEGFP, NGN2-T2A–mEGFP. Insets: magnified views of the regions in the white boxes. Scale bars, 0.1 mm (main images) and 0.05 mm (insets). e, Number of cells, based on Hoechst nuclear staining, in the NGN2-directed differentiation experiments. f, Neurite density (fraction of tubulin-covered area) in the NGN2-directed differentiation experiments. e,f, Data are the mean ± s.d. of n = 6 images pooled from two independent experiments. P values from a two-sided unpaired Student’s t-test. g, Principal component analysis of the RNA-seq expression profiles of parental ZIP13K2 human iPSCs and human iPSCs expressing the indicated NGN2 transgenes. h, Differential expression analysis of human iPSCs expressing the indicated transgenes. NGN2 target genes are highlighted. P values were determined using the Benjamini–Hochberg method. i, Heatmap representation of ChIP–Seq read densities of cells expressing wild-type, AroLITE and AroPERFECT NGN2 within a 1.5 kb window around all shared NGN2 peaks (top), differentially enriched peaks in AroPERFECT NGN2 (centre) and differentially enriched peaks in wild-type NGN2 (bottom). FE, fold over input. j, NGN2 differential binding at the TMEM97 locus. Genome browser tracks of ChIP–Seq data after 24 and 48 h of NGN2 expression are displayed. The arrowhead highlights a differentially bound peak at 24 h. The coordinates are hg38 genome assembly coordinates. k, Nascent transcription (TT-SLAM-Seq) metagene profiles at approximately 9,000 NGN2 target genes. TSS, transcription start site; TES, transcription end site.
Fig. 7
Fig. 7. Optimizing aromatic dispersion in MYOD1 enhances myotube differentiation.
a, Schematic models of wild-type and mutant MYOD1 proteins (left). The position of the bHLH DBD (grey box) and aromatic amino acids (orange dots) are indicated. Omega plots and ΩAro scores of the N-terminal and C-terminal IDRs (middle). Results of luciferase reporter assays in C2C12 mouse myoblasts (right). Luciferase values were normalized to an internal Renilla control and the values are displayed as percentages normalized to the activity measured using an empty vector. Data are the mean ± s.d. of three biological replicates. P values are from two-sided unpaired Student’s t-tests. b, Schematic model of the MYOD1-mediated myotube differentiation experiment. c, Representative fluorescence microscopy images of differentiating C2C12 myoblasts expressing the indicated MYOD1 proteins on day 3 after DOX induction. The mEGFP signal of the MYOD1-T2A–mEGFP construct was used as a cytoplasmic marker. Nuclear counterstain (DAPI) is shown in magenta. Magnified views of the regions in the white boxes are provided (zoom; bottom). Scale bars, 0.5 mm (main images) and 0.2 mm (zoom). d, MYOD1-driven myotube differentiation efficiency. The fusion index was calculated as the percentage of nuclei in fused cells (cells containing at least three nuclei). Data are the mean ± s.d. of n = 15 images per genotype pooled from three biological replicates. P values are from two-sided unpaired Student’s t-tests. e, Principal component analysis of RNA-seq expression profiles of parental C2C12 cells as well as cells expressing the indicated MYOD1 transgenes. f, Differential expression analysis of C2C12 cells expressing AroLITE or AroPERFECT C MYOD1 versus C2C12 cells expressing wild-type MYOD1. MYOD1 target genes are represented as blue dots. Highlighted genes were differentially expressed and are involved in cell adhesion. P values were calculated using the Benjamini–Hochberg method.
Extended Data Fig. 1
Extended Data Fig. 1. Characterization of periodic blocks in human TF IDRs.
a. Distribution plot of the 531 human TFs that contain short periodic blocks overlapping their intrinsically disordered regions (IDRs). Most TF IDRs overlap one short periodic block. b. Distribution plot of the 748 periodic blocks of aromatic amino acids in human TF IDRs. Most periodic blocks consist of 4 aromatic residues. c. Domain annotation of the 80 human TFs with the highest IDR periodicity score. Zinc finger TFs are shown on the left, members of all other TF families on the right. The majority of periodic blocks do not overlap ‘minimal’ activation domains. d. Frequency of amino acids in non-periodic, and periodic TF IDRs, relative to their frequencies in the full proteome. Note that periodic TF IDRs are relatively enriched for aromatic residues, depleted for charged residues, and enriched for neutral residues. e. Amino acid PWM and cumulative bar frequency plot around aromatic residues in periodic blocks. Colours represent disorder promoting (yellow), order promoting (blue) and neutral residues (grey). f. Variable length gapped or un-gapped motif analysis of periodic blocks and charged blocks from Lyons et. al, represented as PWM plot. Note that no motif could be found.
Extended Data Fig. 2
Extended Data Fig. 2. Aromatic residues in periodic TF IDRs are necessary for in vitro phase separation and transactivation.
a. Disorder plots (Metapredict) of HOXB1 and HOXD4 in black, AlphaFold2 pLDDT score plots in yellow. Predicted activation domains are annotated with light blue. b. Omega plots of HOXB1 and HOXD4 for full IDR regions (top) and portions encoding periodic aromatic blocks (bottom). Shown are the coordinates of the regions, ΩAro scores and the percentage of randomly generated sequences that have a lower ΩAro score than the actual sequence. c. Representative images of droplet formation of purified, recombinant TF IDR–mEGFP proteins. Scale bar: 5 μm. d. The relative amount of condensed protein per concentration quantified in the droplet formation assays. Data are displayed as mean ± SD. N = 10 images per condition pooled from two independent replicates. e. Schematic and results of luciferase reporter assays. f. Schematic model of HOXD4 IDRs. g. Representative images of droplet formation of purified HOXD4 IDR–mEGFP proteins. Scale bar: 5 μm. h. The relative amount of condensed protein per concentration quantified in the droplet formation assays. Data are displayed as mean ± SD. N = 10 images per condition pooled from two independent replicates. i. Schematic and results of luciferase reporter assays. j. (left) Disorder plot (Metapredict) in black and AlphaFold2 pLDDT score plots in yellow for EGR1. (right) Results of luciferase reporter assays of the EGR1 C-IDR. k. (left) Disorder plot for NFAT5. (right) Results of luciferase reporter assays. l. (left) Disorder plot for NANOG. (right) Results of luciferase reporter assays. m. Results of luciferase reporter assays in the indicated cell types. In e., i., j., k., l., m. the luciferase values were normalized against an internal Renilla control, and the values are displayed as percentages normalized to the activity measured using an empty vector. Data are displayed as mean ± SD. Data are from three biological replicates. P values are from two-sided unpaired t-tests. In d., h. the curves were generated as a nonlinear regression to a sigmoidal curve function. IDR: intrinsically disordered region, DBD: DNA-binding domain.
Extended Data Fig. 3
Extended Data Fig. 3. Proteins that contain regions with significant periodicity.
a. Region of significant periodicity in HNRNPA1. Plotted is the disorder score (Metapredict) on the top, and the P values (from K–S test) of the periodicity algorithm on the bottom against the position of amino acids. The positions of the two RNA binding domains (RBD1, RBD2) are noted as grey boxes. The position of the intrinsically disordered region (IDR) is noted with a dark blue bar. The position of the prion-like domain (PLD) is noted with a light blue bar. b. Density plot of all proteins that contain a region of significant periodicity. For each region of significant periodicity, the length of the region is plotted against the lowest P value (from K–S test) within the region. A P value cutoff of 0.01 was used to identify 2,202 regions. Each black dot represents one region, and the depth of the colour of the cloud is proportional to the density of the dots in the area. The positions of the DAZ1, EWSR1, HNRNPA1 and EGR1 are highlighted with red circles. c. AlphaFold models of four proteins. Aromatic residues are coloured in red, and all other residues are coloured in yellow. Note that in DAZ1, the periodic aromatic residues are in a structure of beta-sheets. EGR1 is the transcription factor with the highest ranked region of significant periodicity. d, e. Gene set enrichment analysis (GSEA) of the 2,202 human proteins that contain a region with significant periodicity. The GSEA revealed an enrichment of prion-like domains and depletion of transcription factors. The 2,202 proteins were ranked according to the lowest P value of their most periodic 100 amino acid window. The tick marks indicate the position of prion-like domains, aromatic rich prion-like domains (>10% aromatic content) and transcription factors on the ranked gene list. Since Zn-finger transcription factors (ZNFs) contain repetitive sequences, the transcription factors excluding ZNFs is also shown. Empirical P value is reported.
Extended Data Fig. 4
Extended Data Fig. 4. Characterization of periodic TF IDR mutants.
a. Representative images of fluorescence recovery after photobleaching (FRAP) experiments with HOXD4 IDR–mEGFP droplets. b. Western blot of GAL4-DBD and GAL4-DBD-HOXD4-IDR-fusion proteins in HEK293T cells 24 hours after transfection using a GAL4-DBD specific antibody. HSP90: loading control. Except for AroLITE A, GAL4-DBD-HOXD4-IDR fusion proteins are expressed at comparable levels. c. Schematic models of HOXD4 wild type and mutant IDRs. Omega plots of the HOXD4 IDRs and ΩAro scores are shown next to the schematic models. d. Results of luciferase reporter assays. The YPWM motif does not contribute to the transactivation potential of the HOXD4 IDR. e. The activity of HOXD4 IDRs (left) and C/EBPα IDRs (right) scales with the number of small inert residues adjacent to aromatic residues in the IDR constructs. f. (left) Schematic models of wild type and AroPERFECT HOXC4 IDRs. (middle) Omega plots and ΩAro scores of the IDRs. IDR: intrinsically disordered region (right). Results of luciferase reporter assays. g. Western blot of GAL4-DBD and GAL4-DBD-HOXC4-IDR fusion proteins in HEK293T cells 24 hours after transfection using a GAL4-DBD specific antibody. HSP90: loading control. h. Representative images of droplet formation of purified HOXC4 IDR–mEGFP proteins. Scale bar: 5 μm. For the wild type IDR, the exact same images are displayed in Fig. 1g. i. The relative amount of condensed protein per concentration quantified in the droplet formation assays. Data are displayed as mean ± SD. N = 10 images per condition pooled from two independent replicates. The curve was generated as a nonlinear regression to a sigmoidal curve function. j. Representative images FRAP experiments with HOXC4 IDR–mEGFP droplets. k. Fluorescence intensity of HOXC4 wild type IDR and HOXC4 AroPERFECT IDR in vitro droplets before, during and after photobleaching. Data displayed as mean ± SD. N = 20 images from two replicates. In d., f. luciferase values were normalized against an internal Renilla control, and the values are displayed as percentages normalized to the activity measured using an empty vector. Data are displayed as mean ± SD from three biological replicates. P values are from two-sided unpaired t-tests. Source data
Extended Data Fig. 5
Extended Data Fig. 5. Optimizing aromatic dispersion enhances the activity of multiple TF IDRs.
a. AlphaFold models of OCT4, PDX1 and FOXA3. b. (left) Schematic models of OCT4 (top), PDX1 (middle) and FOXA3 (bottom) wild type and mutant sequences. (right) Results of luciferase reporter assays. Note that shown AroPERFECT IDRs have stronger transactivation capacity as their respective wild type sequences. c. Western blot of GAL4-DBD and GAL4-DBD-OCT4-IDR- (top), GAL4-DBD-PDX1-IDR- (middle) and GAL4-DBD-FOXA3-IDR- (bottom) fusion proteins in HEK293T cells 24 hours after transfection using a GAL4-DBD specific antibody. HSP90: loading control. Wild type and AroPERFECT mutants are expressed at comparable levels. d. Results of a OCT4 C-IDR tiling experiment by using luciferase reporter assays. Sequences were tiled into fragments of 40 amino acids with 20 amino acid overlaps. The activities of the full-length IDRs are indicated with dashed horizontal lines. e. (left) Schematic model of EGR1 IDR wild type and mutant sequences. Aromatic amino acids are highlighted as orange dots. (right) Results of luciferase reporter assays. f. Results of a EGR1 IDR tiling experiment by using luciferase reporter assays. Sequences were tiled into fragments of 40 amino acids with 20 amino acid overlaps. The activities of the full-length IDRs are indicated with dashed horizontal lines. g. (left) Schematic model of HOXB1 IDR wild type and AroPERFECT sequences. Aromatic amino acids are highlighted as orange dots. (middle) Omega plots and ΩAro scores of the IDRs. (right) Results of luciferase reporter assays. In b., e., g. luciferase values were normalized against an internal Renilla control, and the values are displayed as percentages normalized to the activity measured using an empty vector. Data are displayed as mean ± SD. N = 3 for OCT4, N = 2 for FOXA3 and N = 2 for PDX1 from independent replicates. P-values are from two-sided unpaired t-tests. *: P < 0.05, ***: P < 10−3. DBD: DNA-binding domain; IDR: intrinsically disordered region; AD: activation domain. Source data
Extended Data Fig. 6
Extended Data Fig. 6. Characterization of HAP1 HOXD4 knock-in and HOXD4 overexpression cells.
a. Scheme of mEGFP knock-in strategy at the HOXD4 locus. b. Scheme of the PCR genotyping strategy of the HAP1 cell lines. c. PCR genotyping of HAP1 cell lines. d. HOXD4 gene expression levels quantified as RQ value in HAP1 wild type and HAP1 HOXD4 knockout cells by quantitative real-time PCR. Data represented as mean ± SD from three technical replicates. e. Heatmap analysis of RNA-Seq data in the five cell lines. Cluster 1: Upregulated in knockout and AroPERFECT/AroPLUS. Cluster 2 and 4: downregulated in knockout and AroPERFECT/AroPLUS. Note that Cluster 4 is enriched in PBX targets. Cluster 3: expressed in knockout with minimal upregulation in AroPERFECT/AroPLUS (largely similar to Cluster 1). Cluster 5: slight reduction in knockout, more pronounced repression in AroPERFECT and AroPLUS. Clusters 1–5 comprise genes that respond similarly in the knockout, AroPERFECT and AroPLUS compared to wild type cells. Cluster 6: HOXD4-targets (that is, downregulated in the knockout compared to wild type) that are upregulated in AroPERFECT AroPLUS cells. Genes in this cluster are consistent with a partial gain-of-function effect of AroPERFECT AroPLUS HOXD4. Expression values are represented by scaling and centering VST transformed read count normalized values (z-score). K-means clustering was used to define the clusters. f. Western blot analysis in the indicated HAP1 cell lines (left), and bulk cell populations encoding the PiggyBac overexpression system (right). HSP90: loading control. g. (top) Differential interference contrast microscopy of the indicated cell lines. Scale bar is 0.4 mm. (bottom) Fluorescence microscopy images. Cells were imaged 14 days after constant doxycycline induction. h. Flow cytometry analysis of mEGFP expression in HAP1 HOXD4–mEGFP PiggyBac cell lines after 14 days of Dox induction. A representative quantification is shown. Data normalized to mode. i. Gene expression levels quantified as fold change in HAP1 PiggyBac clones, measured by quantitative real-time PCR after 14 days of constant doxycycline induction. Data represented as mean ± SD from two biological replicates. j. Control quantification of CFP fluorescence intensity in the tethered foci from the experiments shown in Figs. 3h and 4e. Data displayed as mean ± SD. (left) For YFP, N = 50 and 51 nuclei for WT and AroPERFECT, respectively, and for YFP–RNAPII CTD, N = 50 and 53 nuclei for WT and AroPERFECT respectively. (right) For YFP, N = 51 and 51 nuclei for WT and AroPERFECT respectively, and for YFP–RNAPII CTD, N = 51 and 56 nuclei for WT and AroPERFECT respectively. All pooled from two independent replicates. P values are from 2-way ANOVA multiple comparisons tests. Exact P values reported in ‘Statistics and Reproducibility’. *:P < 0.05. Source data
Extended Data Fig. 7
Extended Data Fig. 7. C/EBPα supporting data.
a. The relative amount of condensed protein per concentration quantified in the droplet formation assays. Data are displayed as mean ± SD. N = 10 images from 2 replicates. The curve was generated as a nonlinear regression to a sigmoidal curve function. b. Western blot of GAL4-DBD and GAL4-DBD-C/EBPα-IDR fusion proteins in HEK293T cells 24 hours after transfection using a GAL4-DBD specific antibody. HSP90 is shown as loading control. Wild type and AroPERFECT IS15 mutants are expressed at comparable levels. c. (left) Schematic models of wild type and mutant C/EBPα proteins. The position of the bZIP DNA-binding domain is highlighted with a grey box and aromatic amino acids are highlighted as orange dots. (middle) Omega plots and ΩAro scores in the IDR. IDR: intrinsically disordered region. (right) Results of luciferase reporter assays in V6.5 mouse embryonic stem cells. Luciferase values were normalized against an internal Renilla control, and the values are displayed as percentages normalized to the activity measured using an empty vector (dashed orange line). Data are displayed as mean ± SD from three biological replicates per condition. P values are from two-sided unpaired t-tests. d. Scheme of FACS analysis strategy for quantification of macrophage differentiation efficiency. e. Flow cytometry analysis of Mac1 and CD19 expression in differentiating RCH-rtTA cells after induction of C/EBPα constructs with doxycycline. The lines separating the quadrants of the plot indicate the gating strategy to categorize the population into Mac1/CD19 positive or negative. The bar plots show the percentage of Mac1+ CD19 cells among the mEGFP+ cell population in every replicate that corresponds to each condition. Concatenated data is shown (top sub-panel). Flow cytometry analysis of mEGFP expression in differentiating RCH-rtTA cells. Gates indicate cell populations considered as mEGFP+ or mEGFP. The bar plots on the right depict the percentage of the mEGFP+ cell population in every replicate that correspond to each condition. Concatenated data is shown (bottom sub-panel). In the bottom sub-panel, Fluorescence microscopy images of differentiating RCH-rtTA cells expressing GFP-tagged C/EBPα proteins are displayed 24 h after transgene induction. Scale bar is 10 µm. Replicates are shown on the plot. Source data
Extended Data Fig. 8
Extended Data Fig. 8. C/EBPα single-cell RNA-seq supporting data.
a. Characterization of scRNA-seq clusters using the data for various stages of B cell macrophage differentiation from a previous study. Average expression for each cluster was normalized by vst and centered (z-score). K-means clustering was used to define the heatmap clusters. b. Quantification of the cluster’s genes for each k-cluster of the heatmap. Based on the quantification and expression profile of the heatmap the single-cell clusters were manually assigned. c. RNA velocity stream plot was embedded to pre-computed UMAP plot. The streamlines represent velocity vector field. The pseudotime plot (bottom right) illustrates the relative time relationship between the cells. d. Quantification of mEGFP-positive cells in the initial clusters. Cluster 0 and 2 contain virtually no mEGFP-positive cells, and were therefore removed from downstream analyses. e. Sample proportions for each cluster. Differentiating macrophage 1 is wild type-specific and Differentiating macrophage 2 is AroPERFECT IS15-specific. AroPERFECT IS10 cells are absent from the macrophage clusters. f. (left to right) Combined UMAP coloured CD14 and PTPRC, CD19 and ITGAM (MAC1) gene expression. These markers are associated with macrophage differentiation. g. Top 5 differentially expressed genes per cluster. These gene show specific expression signatures associated with each cluster and could be used as differentiation stage markers. h. Stacked violin plots for select DEG genes for Late macrophage cluster between AroPERFECT IS15 and wild type. Most genes seem to be expressed in other cluster with the exceptions of MMP9. CSF3R and CFD which seem to be macrophage and C/EBPα wild type specific while IL2RA is macrophage and C/EBPα AroPERFECT IS15 specific. i. Volcano plot of differentially expressed genes in the Late Macrophage cluster for wild type vs AroPERFECT IS15 samples. Differentially expressed target genes (Benjamini–Hochberg method, P < 0.05) are highlighted in blue. j. Flow cytometry analysis of GFP expression in RCH-rtTA clonal cell lines expressing GFP-tagged versions of C/EBPα. Data normalized to mode. k. Principal component analysis of the ChIP–Seq peak profiles for wild type and AroPERFECT IS15 C/EBPα-expressing cells 24 h and 48 h after induction of C/EBPα expression (PC1 vs. PC2). l, n. C/EBPα AroPERFECT IS15 shows enhanced binding at the CEACAM gene cluster (l) and at the FCGR2A locus (n). Displayed are genome browser tracks of ChIP–Seq data of C/EBPα wild type and AroPERFECT IS15 in RCH-rtTA cells, 24 and 48 hours after C/EBPα expression. Coordinates are hg38 genome assembly coordinates. m, p. Combined UMAP coloured on CEACAM8 and CEACAM1 (m) and FCGR2B and FCGR2A (p) expression. n, q. Flow cytometry analysis of CD66 (n) and FCGR2A (q) expression in differentiating GFP + RCH-rtTA cells 0 h and 48 h after induction of C/EBPα overexpression. Data normalized to mode.
Extended Data Fig. 9
Extended Data Fig. 9. NGN2 supporting data.
a. (left) Schematic models of NGN2 proteins. (middle) Omega plots and ΩAro scores of the IDRs. (right) Results of luciferase reporter assays. Luciferase values were normalized against an internal Renilla control, and the values are displayed as percentages normalized to the activity measured using an empty vector (dashed orange line). Data are displayed as mean ± SD from three biological replicates. b. Representative images of droplet formation of purified NGN2 C-terminal IDR–mEGFP proteins. Scale bar: 5 μm. c. The relative amount of condensed protein per concentration quantified in the droplet formation assays. Data are displayed as mean ± SD. N = 10 images per condition pooled from two independent replicates. The curve was generated as a nonlinear regression to a sigmoidal curve function. d. Fluorescence microscopy images of differentiating ZIP13K2 cells expressing FLAG-tagged versions of NGN2 at 48 h. NGN2-FLAG was visualized with an α-FLAG antibody. GFP signal is the endogenous mEGFP fluorescence signal of mEGFP. Scale bar: 5 μm. e. Quantification of FLAG-NGN2 signal. Data displayed as mean ± SD. N = number of cells from one biological replicate. P values are from two-sided unpaired t-test. P(Wild type vs. AroLITE)=0.00001, P(Wild type vs. AroPERFECT)=0.00019. f. Heatmap analysis of RNA-Seq data in the four cell lines. Genes were clustered using k-means clustering on expression values. Expression values are represented by scaling and centering VST transformed read count normalized values (z-score). g. Marker gene analysis from selected genes from single-cell cluster markers in NGN2 induced neural differentiation. h. Principal component analysis of the NGN2 ChIP–Seq peak profiles. i. NGN2 AroLITE loss of binding at the SERTM1 locus. Displayed are genome browser tracks of ChIP–Seq data of NGN2 wild type, AroLITE and AroPERFECT in ZIP13K2 cells, 24 and 48 hours after NGN2 overexpression. Coordinates are hg38 genome assembly coordinates. j. Enrichment scores of bHLH TF motifs, and adjusted P values. P values from Benjamini–Hochberg method. k. Heatmap analysis of TT-SLAM-seq data in the four cell lines 12 h and 24 h after transgene induction. Genes were clustered using k-means clustering on expression values. Expression values are represented by scaling and centering VST transformed read count normalized values (z-score). l. TT-SLAM-Seq data at the LBH locus.
Extended Data Fig. 10
Extended Data Fig. 10. MYOD1 supporting data.
a. (left) Western blot of GAL4-DBD and GAL4-DBD-MYOD1 C-IDR-fusion proteins in HEK293T cells 24 hours after transfection using a GAL4-DBD specific antibody. (left). Western blot of FLAG-MYOD1 fusion proteins in differentiating C2C12 cells 24 hours after transgene induction. Wild type and AroPERFECT mutants are expressed at comparable levels. HSP90: loading control. Wild type and AroPERFECT mutants are expressed at comparable levels. b. Results of a MYOD1 C-IDR tiling experiment by using luciferase reporter assays. Sequences were tiled into fragments of 40 amino acids with 20 amino acid overlaps. Data displayed as mean ± SD. N = 2 biological replicates. The activities of the full-length IDRs are indicated with dashed horizontal lines. c. Fluorescence images of C2C12 myoblasts at day 0 and 1 after induction of MYOD1 wild type, MYOD1 AroLITE, MYOD1 AroPERFECT C or MYOD1 AroLITE C transgene with doxycycline. DAPI was used as DNA counterstain (magenta). Co-expressed mEGFP of the MYOD1-T2A-mEGFP fusion protein was used as cytoplasmic marker (cyan). Scale bar 0.5 mm. d. Principal component analysis of the RNA-Seq expression profiles of Parental C2C12, C2C12 MYOD1 wild type, C2C12 MYOD1 AroLITE, C2C12 MYOD1 AroPERFECT, C2C12 MYOD1 AroLITE C and C2C12 MYOD1AroPERFECT-C cells (PC1 vs. PC2). e. Differential expression analysis of Parental C2C12 (top), C2C12 MYOD1 AroPERFECT (centre) and C2C12 MYOD1 AroLITE C (bottom) cells versus C2C12 MYOD1 wild type cells. MYOD1 target genes are highlighted in blue. P-values from Benjamini–Hochberg method. f. Heatmap analysis of RNA-Seq data in the six cell lines. Genes were clustered using k-means clustering on expression values. Expression values are represented by scaling and centering VST transformed read count normalized values (z-score). K-means clustering was used to define the clusters. g. Gene set enrichment analysis (GSEA) of differentially expressed genes in the MYOD1 AroPERFECT C RNA-Seq sample. Empirical P value is reported. Source data

References

    1. Lambert, S. A. et al. The human transcription factors. Cell175, 598–599 (2018). 10.1016/j.cell.2018.09.045 - DOI - PubMed
    1. Lee, T. I. & Young, R. A. Transcriptional regulation and its misregulation in disease. Cell152, 1237–1251 (2013). 10.1016/j.cell.2013.02.014 - DOI - PMC - PubMed
    1. Levine, M., Cattoglio, C. & Tjian, R. Looping back to leap forward: transcription enters a new era. Cell157, 13–25 (2014). 10.1016/j.cell.2014.02.009 - DOI - PMC - PubMed
    1. Graf, T. & Enver, T. Forcing cells to change lineages. Nature462, 587–594 (2009). 10.1038/nature08533 - DOI - PubMed
    1. Takahashi, K. & Yamanaka, S. A decade of transcription factor-mediated reprogramming to pluripotency. Nat. Rev. Mol. Cell Biol.17, 183–193 (2016). 10.1038/nrm.2016.8 - DOI - PubMed

Publication types