. 2024 Aug;26(8):1261-1273.
doi: 10.1038/s41556-024-01457-0. Epub 2024 Jul 5.

Functional multi-organelle units control inflammatory lipid metabolism of macrophages

Affiliations

Functional multi-organelle units control inflammatory lipid metabolism of macrophages

Julia A Zimmermann et al. Nat Cell Biol. 2024 Aug.

Abstract

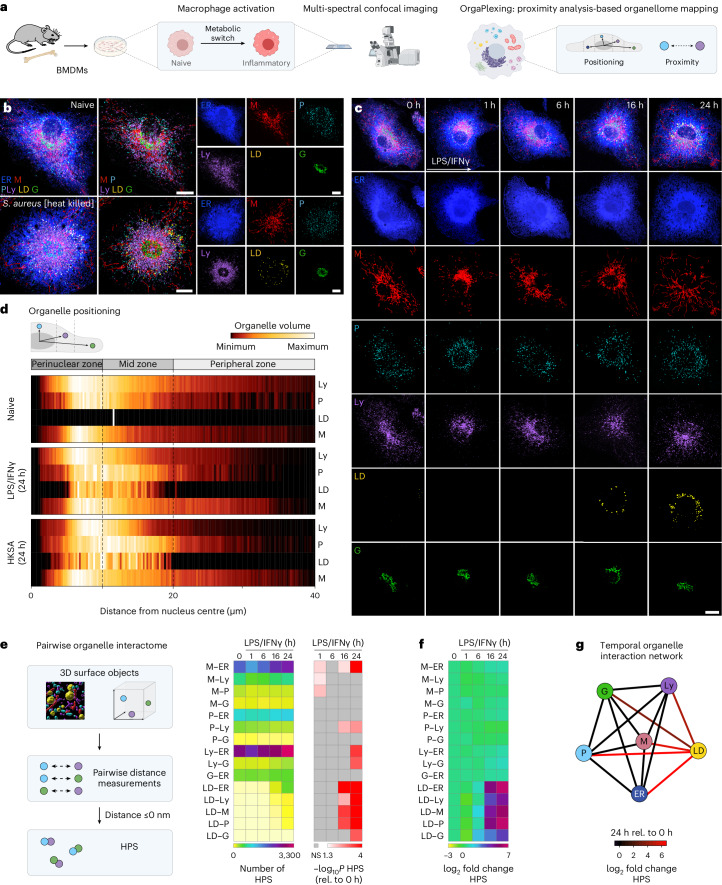
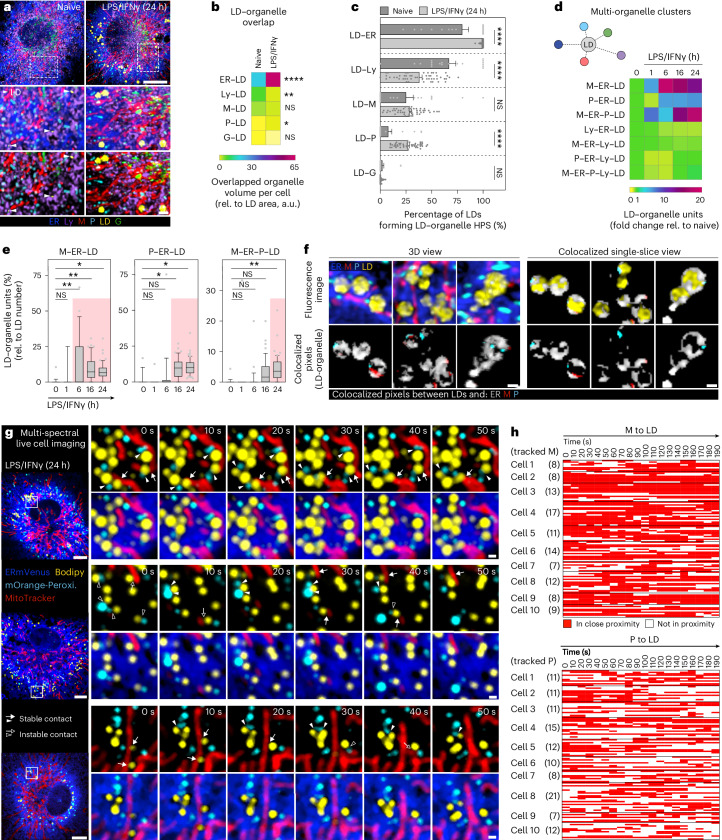
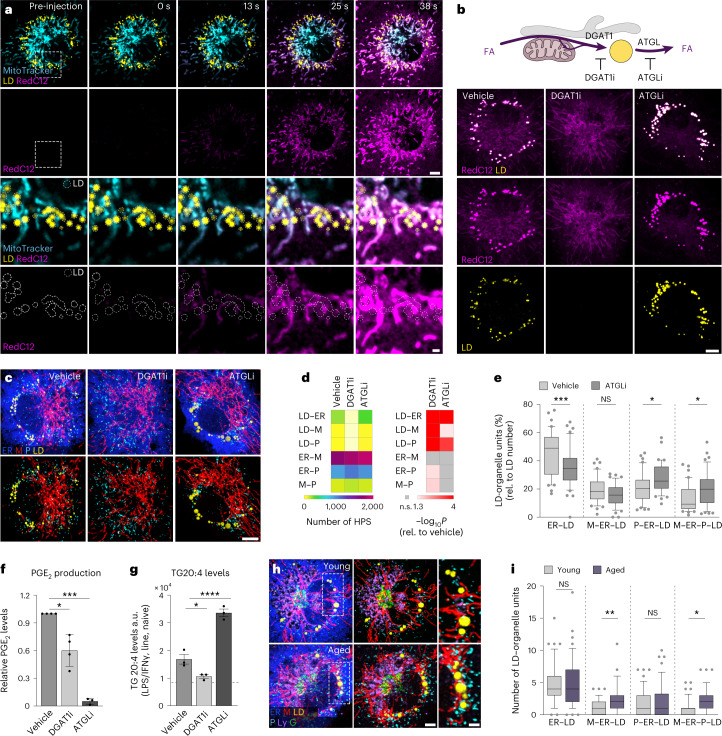
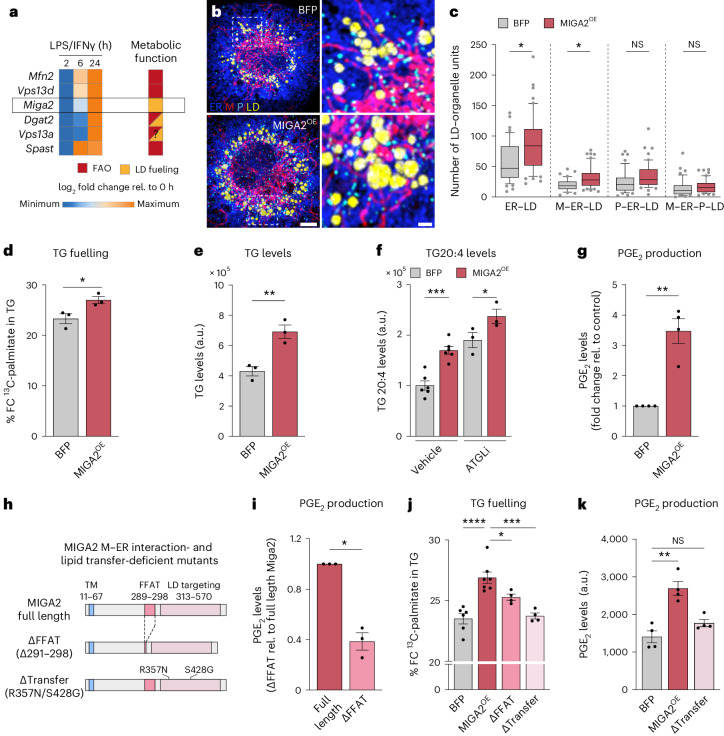
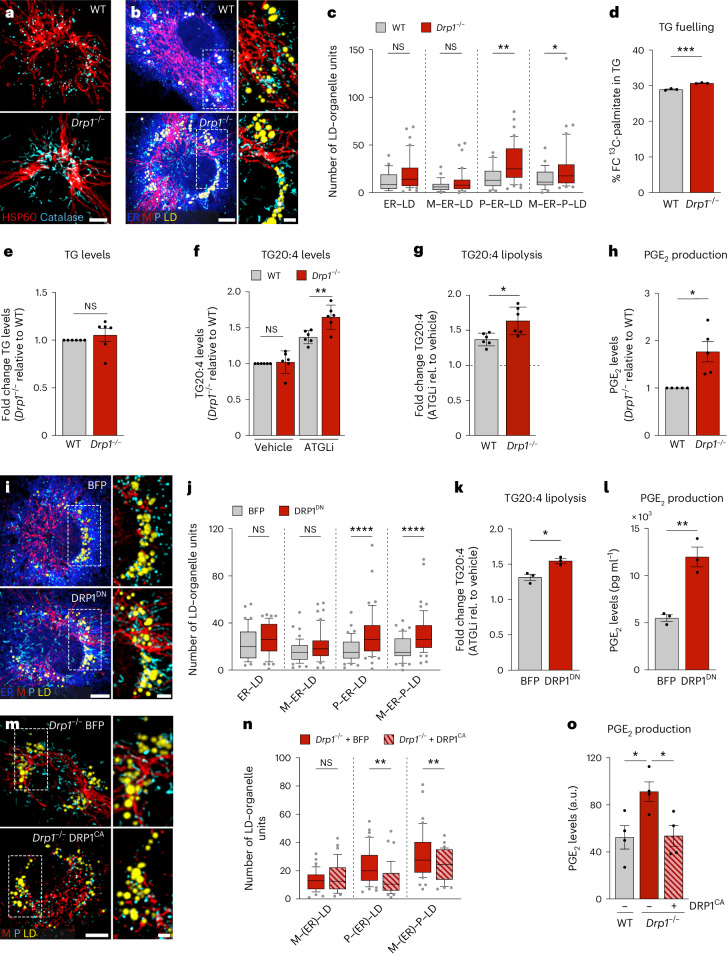
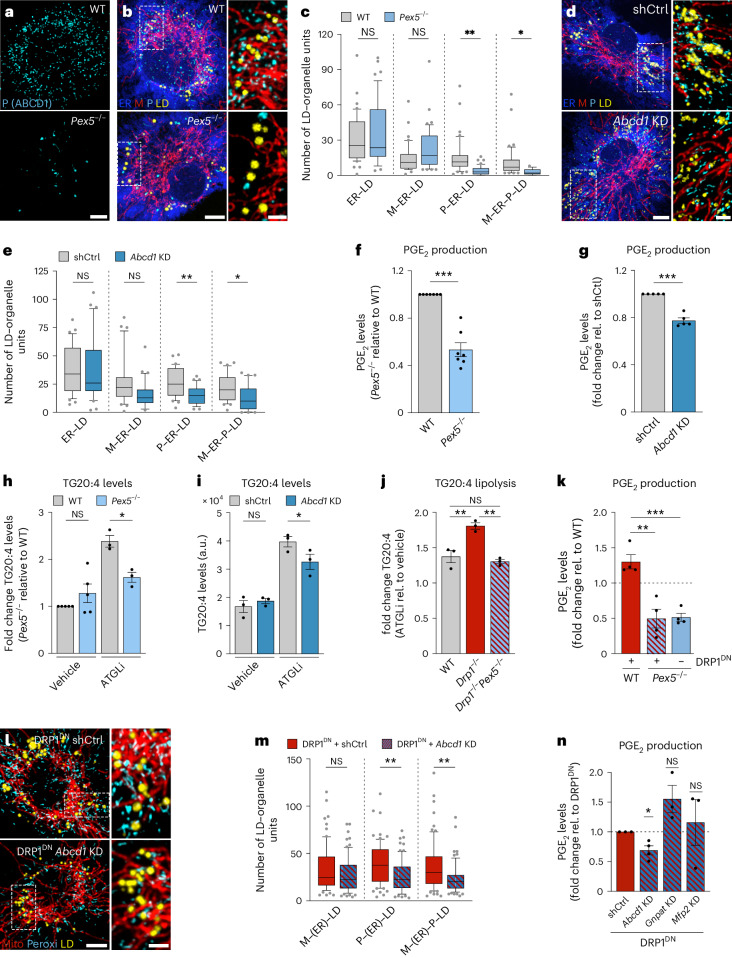
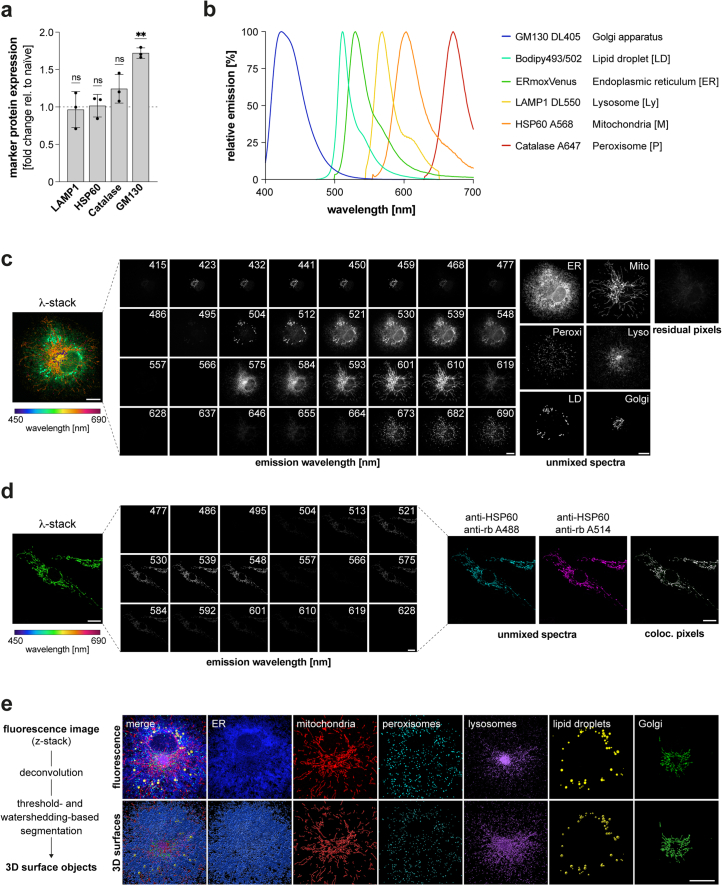
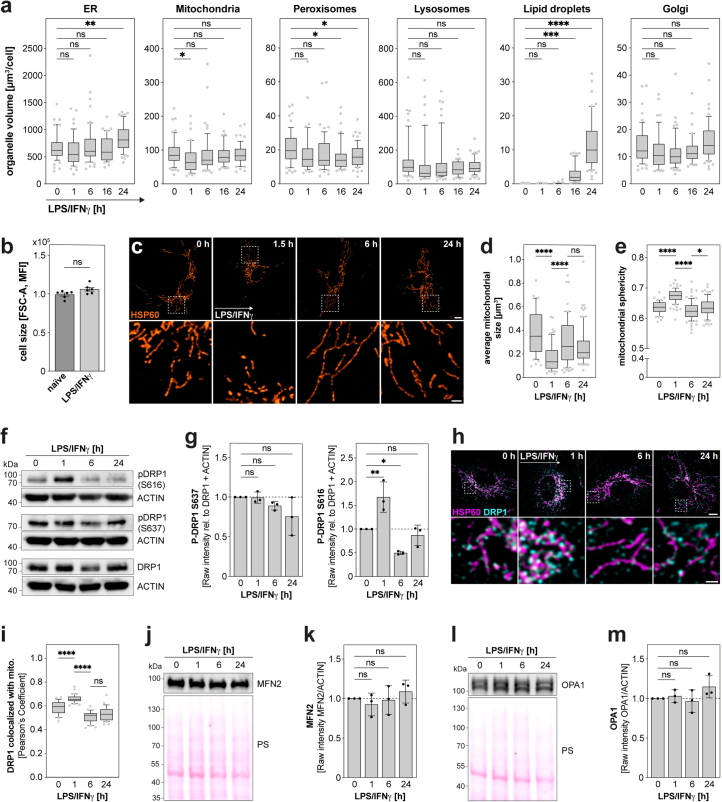
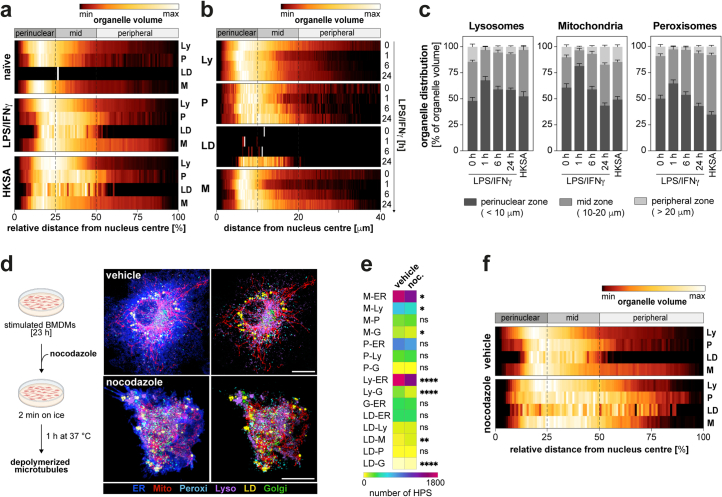
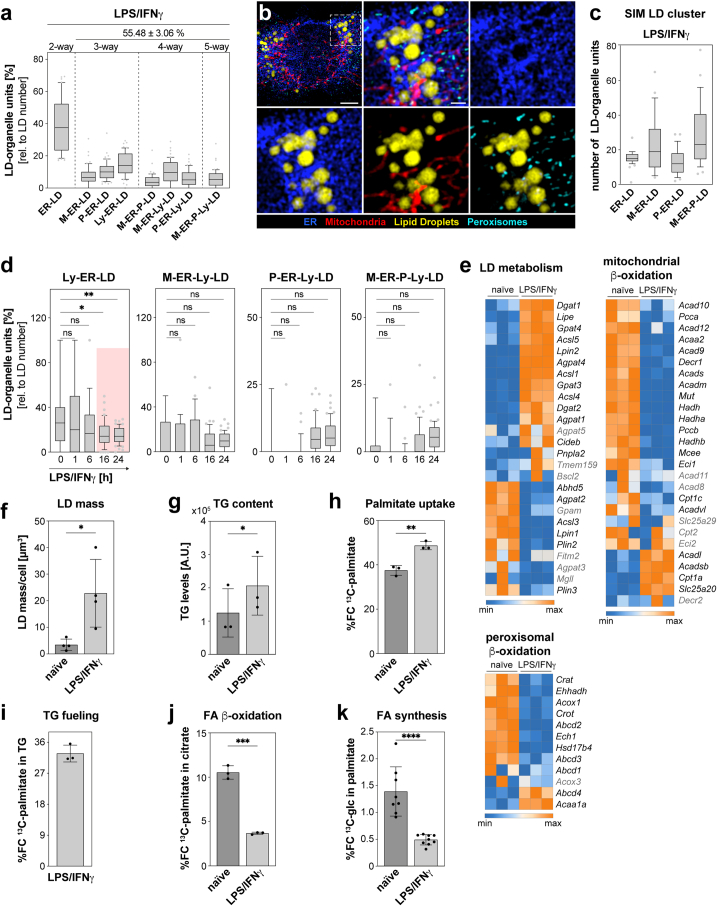
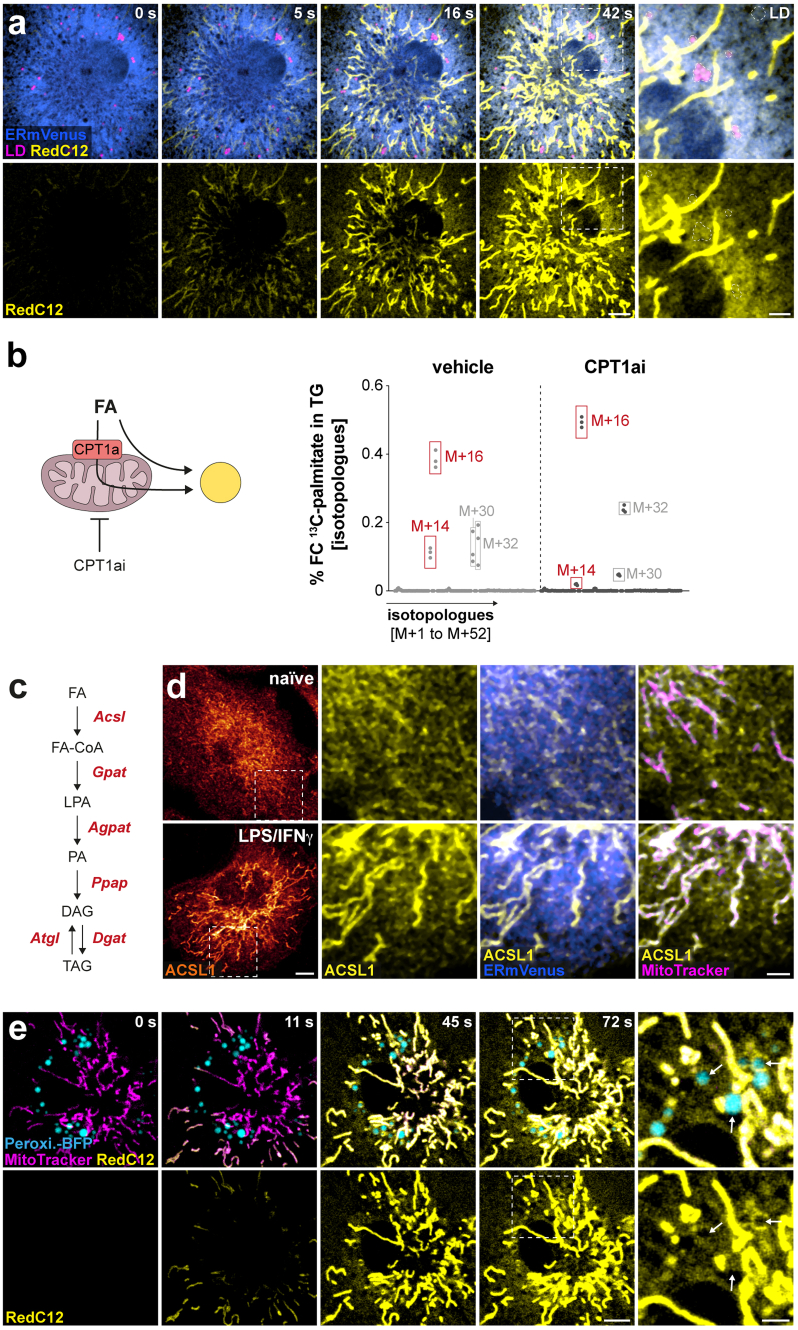
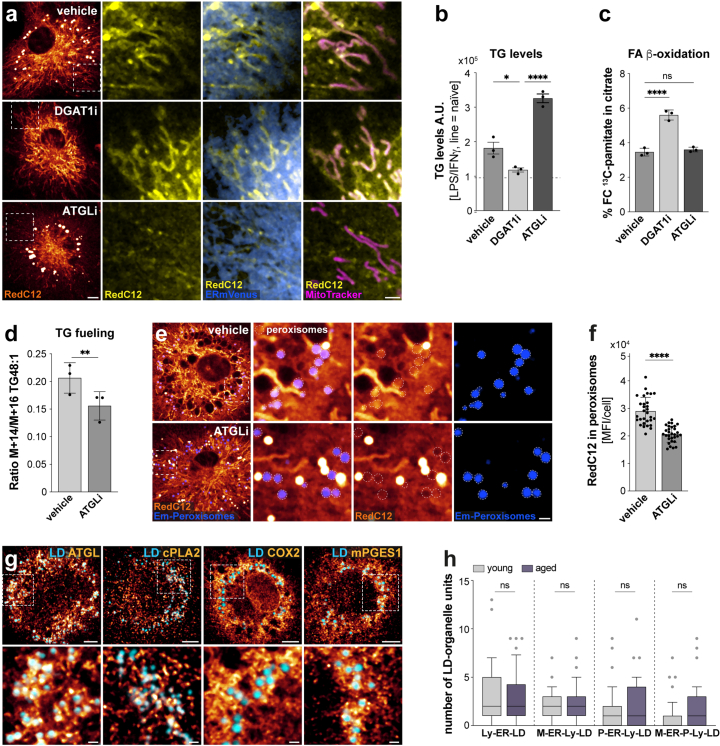
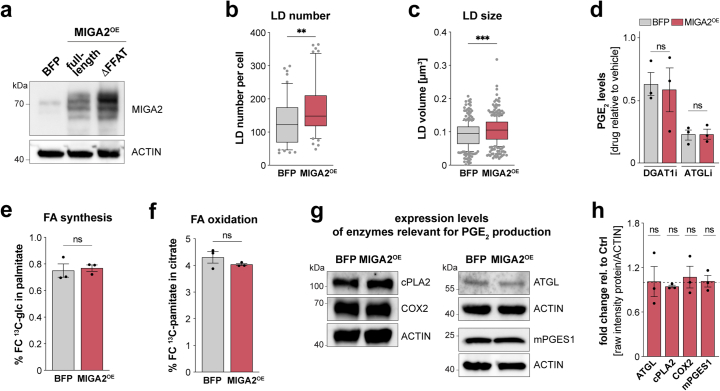
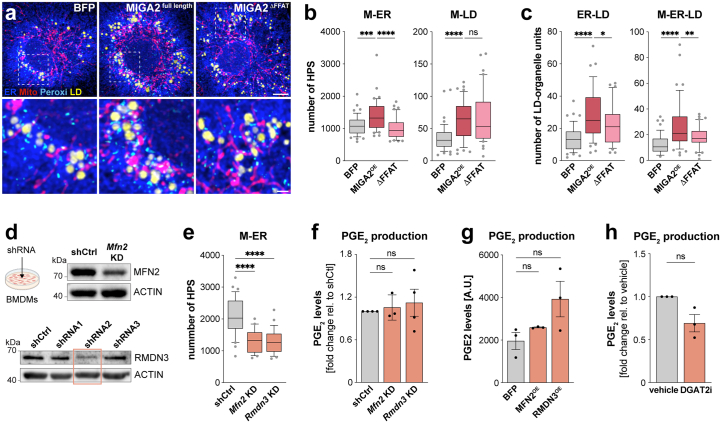
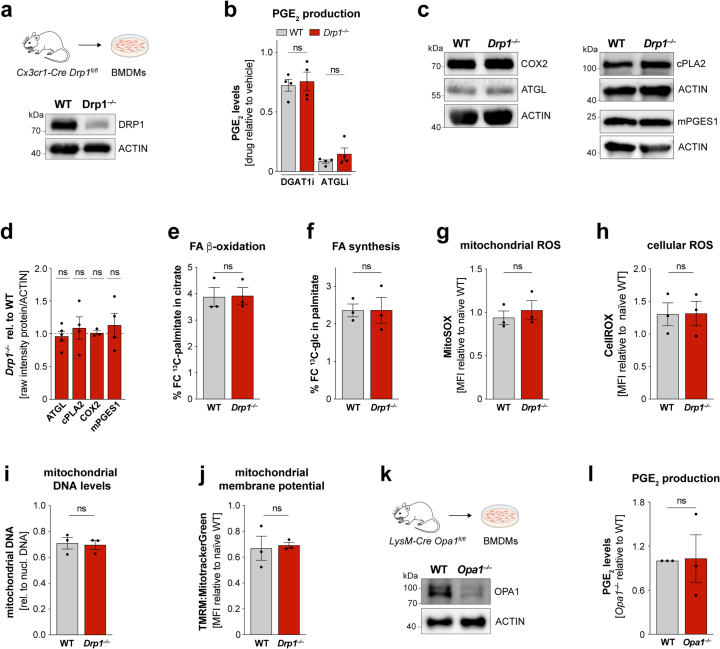
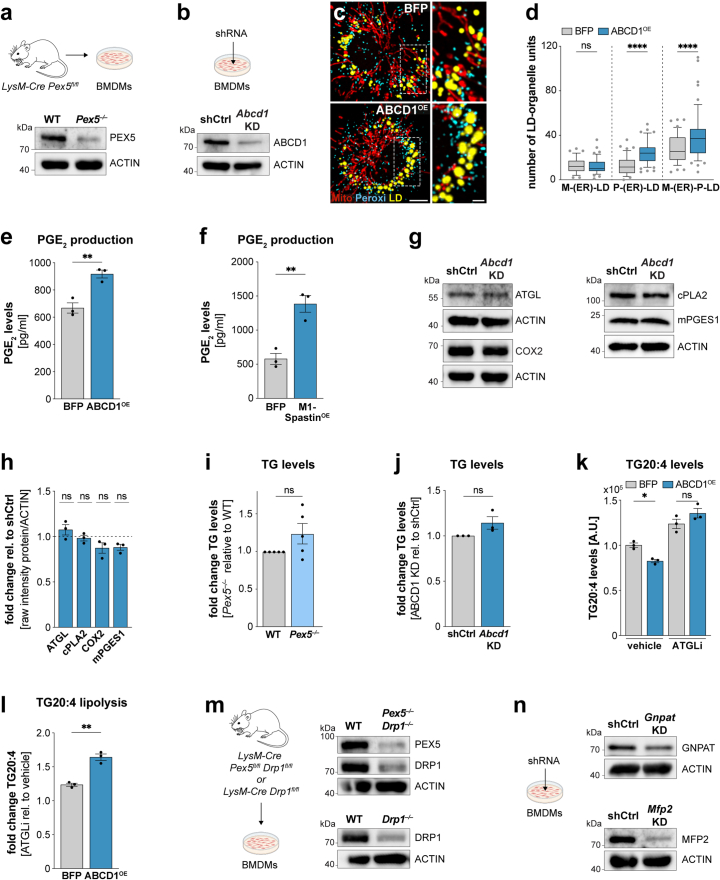
Eukaryotic cells contain several membrane-separated organelles to compartmentalize distinct metabolic reactions. However, it has remained unclear how these organelle systems are coordinated when cells adapt metabolic pathways to support their development, survival or effector functions. Here we present OrgaPlexing, a multi-spectral organelle imaging approach for the comprehensive mapping of six key metabolic organelles and their interactions. We use this analysis on macrophages, immune cells that undergo rapid metabolic switches upon sensing bacterial and inflammatory stimuli. Our results identify lipid droplets (LDs) as primary inflammatory responder organelle, which forms three- and four-way interactions with other organelles. While clusters with endoplasmic reticulum (ER) and mitochondria (mitochondria-ER-LD unit) help supply fatty acids for LD growth, the additional recruitment of peroxisomes (mitochondria-ER-peroxisome-LD unit) supports fatty acid efflux from LDs. Interference with individual components of these units has direct functional consequences for inflammatory lipid mediator synthesis. Together, we show that macrophages form functional multi-organellar units to support metabolic adaptation and provide an experimental strategy to identify organelle-metabolic signalling hubs.


Conflict of interest statement

All authors declare no competing interests.

Figures

Fig. 1
Fig. 1. Inflammatory stimuli rewire the macrophage organellome.
a, Scheme representing the OrgaPlexing work flow. b,c, Immunofluorescence images showing the BMDM organellome upon heat-killed S. aureus (24 h) (b) or LPS/IFNγ (0–24 h) treatment (c). The organelles were visualized using ERmoxVenus (ER, blue), HSP60 (mitochondria (M), red), catalase (peroxisomes (P), cyan), LAMP1 (lysosomes (Ly), purple), Bodipy493/502 (LDs, yellow) and GM130 (Golgi body (G), green). The images are maximum intensity projections and are representative of n = 3 (b,c, 16 h) and n = 4 (c, 0–6 and 24 h) independent experiments. Scale bars, 10 µm. d, Heat maps representing the organelle distribution in BMDMs upon inflammatory activation of N = 15 cells examined over n = 3 independent experiments. The dotted lines indicate borders of perinuclear, mid and peripheral zones. e, Work flow and heat maps showing the number of pairwise organelle HPS upon LPS/IFNγ treatment. Data represent the mean of N = 59 (0 h), N = 48 (1 h), N = 56 (6 h), N = 46 (16 h) and N = 59 (24 h) cells obtained from n = 3 (16 h) and n = 4 (0–6 and 24 h) independent experiments. P values were obtained using one-way analysis of variance (ANOVA) with Tukey’s post hoc test and are depicted as −log10. f, log2-transformed fold change of pairwise organelle proximity sites as described in e. g, Network graph representing the log2-transformed fold change of pairwise organelle proximity sites of LPS/IFNγ-treated (24 h) BMDMs relative (rel.) to naive cells. The numerical P values are indicated in Supplementary Table 4. *P ≤ 0.05, **P ≤ 0.01, ***P ≤ 0.001, ****P ≤ 0.0001. NS, not significant (P > 0.05). Source numerical data are available in Source data. Source data
Fig. 2
Fig. 2. Macrophages rewire their LD–interactome in response to inflammatory stimuli by selectively assembling M–ER–P–LD units.
a, Images of LDs and surrounding organelles in presence or absence of LPS/IFNγ (24 h). The arrowheads are the LDs in naive BMDMs. The organelles were visualized as described in (Fig. 1b,c). The images are maximum intensity projections and representative of n = 3 independent experiments. Scale bars, 5 µm (top) and 1 µm (bottom). b,c, Total overlapped volume between LDs and respective organelles relative to total LD surface area per cell (b) and pairwise LD–organelle HPS relative to LD number (c) in naive and LPS/IFNγ-treated (24 h) BMDMs. The data represent N = 19 (naive) and N = 51 (LPS/IFNγ) cells from n = 3 independent experiments. P values were obtained using Brown–Forsythe and Welch ANOVA with Dunnett’s post hoc (b) or one-way ANOVA with Sidak’s post hoc tests (c). Data are mean ± s.e.m. (c). a.u., arbitrary unit. d, LD-centric multi-organelle clusters upon LPS/IFNγ treatment (0–24 h). The data represent N = 17 (0 h, 1 h), N = 21 (6 h), N = 44 (16 h) and N = 51 (24 h) cells from n = 3 independent experiments. e, Upregulated LD multi-organelle clusters in inflammatory macrophages (as shown in d). The boxes represent the 25th to 75th percentiles and the whiskers denote the 10th and 90th percentiles. The dots are the outliers, and the median is shown as a line. The red colouring indicates significant changes. P values were generated using one-way ANOVA with Dunnett’s post hoc test. f, Co-localized pixels of LDs and respective organelles are depicted as a 3D overlay (left) or single z-planes (right). The data are representative of n = 3 independent experiments. Scale bars, 0.5 µm. g, Mitochondria–LD (arrows) and P–LD (arrowheads) interaction dynamics in LPS/IFNγ-treated BMDMs (24 h). The stable interactions are indicated with filled, instable interactions with empty arrows or arrow heads, respectively. The images represent single confocal z-planes from n = 3 biological repeats. Scale bars, 5 µm (left) and 0.5 µm (right). h, Mitochondria–LD (top) and P–LD (bottom) contacts. The rows represent individual organelles that are (red) or are not (white) in close proximity to LDs. The data representing N = 107 mitochondria and N = 118 peroxisomes were tracked across ten cells from n = 3 biological replicates. Numerical P values are available in Supplementary Table 4. *P ≤ 0.05, **P ≤ 0.01, ***P ≤ 0.001, ****P ≤ 0.0001. Source numerical data are available in Source data. Source data
Fig. 3
Fig. 3. M–ER–P–LD organelles form a fatty acid trafficking unit contributing to and sensing fatty-acid flux in and out of LDs.
a, Live cell imaging showing the flow of acutely injected fluorescently labelled fatty acids (RedC12, magenta) between M–ER–LD organelles in LPS/IFNγ-activated macrophages (24 h). Bottom: the dotted lines indicate LDs. The images represent n = 3 biological replicates. Scale bars, 5 µm (top) and 1 µm (bottom). b, RedC12 distribution (24 h pulse) inside and outside of LDs (Lipidspot610) of LPS/IFNγ-treated BMDMs after DGAT1 or ATGL inhibitor (DGAT1i or ATGLi) treatment. FA, fatty acids. The images represent n = 3 biological replicates. Scale bar, 5 µm. ce, Images (c) and quantification of pairwise organelle HPS (d) and M–ER–P–LD units (e) in LPS/IFNγ-activated BMDMs (24 h) after DGAT1i (c,d) or ATGLi (ce) treatment. Scale bar, 5 µm (c). The data represent N = 41 (vehicle), N = 42 (DGAT1i) and N = 41 (ATGLi) cells from n = 3 independent experiments. P values were obtained using one-way ANOVA with Dunnett’s post hoc test (d) or one-way ANOVA with Sidak’s post hoc test (e). f,g, PGE2 production (f) and TG arachidonic acid content (g) of LPS/IFNγ-activated BMDMs (24 h) after DGAT1i or ATGLi treatment. The data represent n = 4 (f, vehicle, DGAT1i) and n = 3 (f, ATGLi; g) independent experiments. Data are mean ± s.d. (f) and mean ± s.e.m. (g). P values were calculated using two-tailed, one-sample t-test (f) or one-way ANOVA with Sidak’s post hoc test (g). h,i, Images (h) and quantification (i) of M–ER–P–LD units in LPS/IFNγ-treated (24 h) peritoneal macrophages isolated from young and aged mice. Scale bars, 3 µm (left) and 2 µm (right) (h). Data represent N = 46 (young) and N = 47 (aged) cells from n = 3 biological replicates. P values were obtained using Kruskal–Wallis with Dunnett’s post hoc test. Box plots (e,i) are as in Fig. 2e. Images represent single confocal z-planes (a,b) or maximum intensity projections (c,h). The numerical P values are available in Supplementary Table 4. *P ≤ 0.05, **P ≤ 0.01, ***P ≤ 0.001, ****P ≤ 0.0001. Source numerical data are available in Source data. Source data
Fig. 4
Fig. 4. MIGA2 is a M–ER–LD tether regulating LD fuelling of fatty acids and macrophage PGE2 production.
a, Left: LD–organelle tethers identified by RNA-seq with upregulated gene expression during 6–24 h of LPS/IFNγ-treatment. Right: metabolic functions of tethers are indicated by a colour code. FAO, fatty acid oxidation. b,c, Images (b) and quantification (c) of M–ER–P–LD units in LPS/IFNγ-activated (24 h) MIGA2-expressing BMDMs. The images are maximum intensity projections. Scale bars, 5 µm and 1 µm (magnification) (b). Box plots are as in Fig. 2e. Data represent N = 46 (BFP) and N = 50 (MIGA2) cells from n = 3 biological replicates. P values were obtained using a one-way ANOVA with Sidak’s post hoc test (c). df, TG analysis showing 13C-palmitate fuelling in TG (d), TG levels (e) and TG arachidonic acid content and release (f) of LPS/IFNγ-activated BMDMs (24 h) expressing BFP or MIGA2. The data stem from n = 3 (d,e) or n = 6 (f, vehicle) biological repeats. P values were calculated using two-tailed, unpaired t-tests (d,e) or one-way ANOVA with Sidak’s post hoc test (f). g, PGE2 levels of LPS/IFNγ-treated (24 h), in MIGA2- relative to BFP-expressing BMDMs, representing n = 4 biological replicates. P value was generated using a two-tailed, one-sample t-test. h, Scheme representing MIGA2 and its M–ER tethering-deficient MIGA2ΔFFAT and lipid transfer-deficient MIGA2Δtransfer mutants. i, PGE2 levels produced by MIGA2- or MIGA2ΔFFAT-expressing BMDMs (LPS/IFNγ 24 h), representing n = 3 biological repeats. P value was generated using a two-tailed, one-sample t-test. j, 13C-palmitate fuelling in TG in LPS/IFNγ-treated BMDMs (24 h) expressing BFP, full-length MIGA2 or MIGA2ΔFFAT and MIGA2Δtransfer mutants. FC, fractional concentration. Data represent n = 6 (BFP), n = 7 (MIGA2) and n = 4 (MIGA2ΔFFAT, MIGA2Δtransfer) independent repeats. P values were obtained using a one-way ANOVA with Dunnett’s post hoc test. k, PGE2 levels of BFP, MIGA2- or MIGA2Δtransfer-expressing BMDMs (LPS/IFNγ 24 h), representing n = 4 biological replicates. P value was generated using Kruskal–Wallis and Dunn’s post hoc test. Data are mean ± s.e.m. (dg,ik). Numerical P values are available in Supplementary Table 4. *P ≤ 0.05, **P ≤ 0.01, ***P ≤ 0.001, ****P ≤ 0.0001. Source numerical data are available in Source data. Source data
Fig. 5
Fig. 5. DRP1 regulates M–ER–P–LD cluster formation and PGE2 production.
a, Images showing mitochondrial (red) and peroxisomal (cyan) morphologies in inflammatory Drp1−/− or wild-type (WT) BMDMs representing n = 3 biological replicates. b,c, Images (b) and quantification (c) of M–ER–P–LD clusters in LPS/IFNγ-activated Drp1−/− or wild-type BMDMs. The data represent N = 28 (WT) and N = 42 (Drp1−/−) cells from n = 3 biological replicates. P values were obtained using one-way ANOVA with Sidak’s post hoc test. dg, TG analysis showing 13C-palmitate fuelling in TG (d), TG levels (e), TG arachidonic acid content (f) and release (f,g) in LPS/IFNγ-treated wild-type and Drp1−/− BMDMs (24 h) representative of n = 3 (d) or n = 6 (eg) biological replicates. P values were obtained using a two-tailed, unpaired t-test (d,g), two-tailed, one-sample t-test (e) or one-way ANOVA with Sidak’s post hoc test (f). h, PGE2 production of LPS/IFNγ-activated wild-type or Drp1−/− macrophages (24 h) representing n = 5 biological repeats. P value was obtained using a two-tailed, one-sample t-test. i,j, Images (i) and quantification (j) of M–ER–P–LD clusters in LPS/IFNγ-activated DRP1DN expressing BMDMs. Data represent N = 48 (BFP) and N = 55 (DRP1DN) cells from n = 3 biological repeats. P values were obtained using a one-way ANOVA with Sidak’s post hoc test (j). k,l, TG arachidonic acid release (k) and PGE2 production (l) of BFP and DRP1DN expressing LPS/IFNγ-treated BMDMs (24 h). Data show n = 3 independent measurements. P values were obtained using two-tailed, unpaired t-tests (k,l). m,n, Images (m) and quantification (n) of M–ER–P–LD clusters in LPS/IFNγ-activated DRP1CA- or BFP-expressing Drp1−/− BMDMs. Data represent N = 42 (BFP) and N = 38 (DRP1DN) cells from n = 3 biological replicates. P values were obtained using one-way ANOVA with Sidak’s post hoc test (n). o, PGE2 production of LPS/IFNγ-treated wild-type BMDMs expressing BFP and Drp1−/− BMDMs expressing BFP or DRP1CA. Data show n = 4 biological replicates. P values were obtained using one-way ANOVA with Dunnett’s post hoc test. All images are maximum intensity projections. Scale bars, 5 µm and 2 µm (magnifications) (a,b,i,m). Box plots (c,j,n) are as in Fig. 2e. Data are mean ± s.e.m. (d,e,h,k,l) or mean ± s.d. (f,g). Numerical P values are available in Supplementary Table 4. *P ≤ 0.05, **P ≤ 0.01, ***P ≤ 0.001, ****P ≤ 0.0001. Source numerical data are available in Source data. Source data
Fig. 6
Fig. 6. Peroxisomes control the release of LD-stored arachidonic acid and drive PGE2 production in Drp1 inhibited cells.
a, Images showing peroxisomes in wild-type or Pex5−/− BMDMs representing n = 3 biological repeats. be, Images (b,d) and quantification (c,e) of M–ER–P–LD clusters in LPS/IFNγ-activated BMDMs upon Pex5−/− (b,c) or Abcd1 knockdown (KD) (d,e) relative (rel.) to controls. shCtrl, scrambled shRNA control. Data from N = 42 (WT) and N = 44 (Pex5−/−) and N = 31 (shCtrl) and N = 33 (Abcd1 KD) cells were pooled from n = 3 biological replicates. P values were obtained using a one-way ANOVA with Sidak’s post hoc test (c,e). f,g, PGE2 production of LPS/IFNγ-activated (24 h) Pex5−/− (f) or Abcd1 KD (g) BMDMs relative to controls. Data represent n = 7 (f) and n = 5 (g) biologically independent experiments. P values were obtained using two-tailed, one-sample t-tests. hj, Lipidomic analysis showing TG arachidonic acid content (h,i) and release (hj) in LPS/IFNγ-treated Pex5−/− (h), Abcd1 KD BMDMs (i) or Drp1−/− and Pex5−/−Drp1−/− (j) BMDMs relative to controls. Data represent n = 5 (h, vehicle) and n = 3 (i,j and h, ATGLi) biological replicates. P values were obtained using one-way ANOVA with Sidak’s post hoc test (hj). k, PGE2 production of wild-type or Pex5−/− BMDMs expressing DRP1DN (LPS/IFNγ 24 h) from n = 4 biologically independent experiments. P values were obtained using a one-way ANOVA with Tukey’s post hoc test. l,m, Images (l) and quantification (m) of M–P–LD clusters LPS/IFNγ-activated DRP1DN overexpressing BMDMs upon Abcd1 KD. Data represent N = 54 (shCtrl) and N = 54 (Abcd1 KD) cells from n = 4 biological replicates. P values were obtained using Kruskal–Wallis with Dunn’s post hoc test. n, PGE2 production of LPS/IFNγ-activated DRP1DN overexpressing BMDMs upon Abcd1, Gnpat or Mfp2 knockdown. Data represent n = 4 (Abcd1 KD) or n = 3 (Gnpat and Mfp2 KD) biological replicates. P values were obtained using two-tailed, one-sample t-tests. All images are maximum intensity projections. Scale bars, 5 µm and 2 µm (magnifications) (a,b,d,l). Box plots (c,e,m) are as in Fig. 2e. Data are mean ± s.e.m. (fk,n). Numerical P values are available in Supplementary Table 4. *P ≤ 0.05, **P ≤ 0.01, ***P ≤ 0.001, ****P ≤ 0.0001. Source numerical data are available in Source data. Source data
Extended Data Fig. 1
Extended Data Fig. 1. Spectral imaging strategy, image processing and segmentation.
a Expression of marker proteins used for spectral imaging in LPS/IFN-γ-treated (24 h) BMDMs relative to the control obtained by flow cytometry analysis. Bars show the mean ± SD of n = 3 biologically independent experiments. P values were obtained by two-tailed, one-sample t test (** P ≤ 0.01, not significant (ns) P >0.05). Numerical P values are indicated in Supplementary Information Table 4. b Emission spectra of fluorophores used for OrgaPlexing. c Immunofluorescence images of a 6-colour labelled BMDM displaying the emission spectra of individual organelles before (left) and after (right) spectral unmixing. All images are maximum intensity projections and representative of n = 4 independent experiments. Scale bars: 10 µm. d Verification of the unmixing strategy, shown by immunofluorescence of a BMDM displaying mitochondria (HSP60) labelled with A488 and A514 before (left, middle panel) and after (right, unmixed spectra) spectral unmixing as well as colocalized pixels between unmixed images (right, coloc. pixels). All images represent a single z-plane and representative of n = 3 experimental repeats. Scale bars: 10 µm. e Scheme depicting image processing and segmentation pipeline and images showing 3D surface objects generated for each organelle. Fluorescence images show maximum intensity projections and are representative of n = 4 independent experiments. Scale bar: 10 µm. Source numerical data are available in source data. Source data
Extended Data Fig. 2
Extended Data Fig. 2. Organelle mass and mitochondrial morphology are selectively altered in inflammatory macrophages.
a Quantification of organellar volume upon LPS/IFN-γ treatment. Data represent N = 59 (0 h), N = 48 (1 h), N = 56 (6 h), N = 46 (16 h), N = 59 (24 h) cells from n = 3 (16 h, LD 0–6 h) and n = 4 (non-LD 0–6, 24 h) independent experiments. P values were calculated using one-way ANOVA with Dunnett’s post-hoc test. b Cell size of naïve and 24h LPS/IFN-γ-treated BMDMs representing n = 6 independent experiments. P value was obtained by two-tailed, unpaired t-test. c-e Images (c) and quantification (d, average mitochondrial volume/cell; e, mitochondrial sphericity) showing dynamics in mitochondrial morphology of LPS/IFN-γ-activated BMDMs. Images are single z-planes and representative of n = 3 independent experiments. Scale bars: 5 µm, 1 µm (magnification) (c). Data represent (d) N = 51 (0 h), N = 76 (1 h), N = 86 (6 h) and N = 80 (24 h) and (e) N = 55 (0 h), N = 78 (1 h), N = 71 (6 h), N = 79 (24 h) cells from n = 3 independent experiments. P values were calculated using one-way ANOVA with Tukey’s post-hoc test. f-g Western blot analysis (f) and quantification (g) showing protein levels and activation state of DRP1 upon LPS/IFN-γ treatment. Data represent n = 3 biological replicates. P values were calculated using one-way ANOVA with Sidak’s post-hoc test (g). h,i Images (h) and quantification (i) showing the localization of DRP1 to mitochondria (HSP60) in LPS/IFN-γ-activated BMDMs. Scale bars: 5 µm, 1 µm (magnification) (h). Data represent N = 26 (0 h), N = 32 (1 h), N = 30 (6 h), N = 30 (24 h) cells from n = 3 biological replicates. P values were calculated using one-way ANOVA with Tukey’s post-hoc test (i). j-m WB analysis (j,l) and quantification (k,m) showing protein levels of MFN2 (j-k) and OPA1 (l-m) upon LPS/IFN-γ treatment. Data represent n = 3 biological replicates. P values were calculated using one-way ANOVA with Sidak’s post-hoc test (k,m). Boxes represent 25th to 75th percentiles, whiskers 10th and 90th percentiles. Dots are outliers, median is shown as line (a,d,e,i). The bars show the mean ± SEM (b) or the mean ± SD (g,k,m). Numerical P values are indicated in Supplementary Information Table 4 (*P ≤ 0.05, **P ≤ 0.01, ***P ≤ 0.001, ****P ≤ 0.0001, not significant (ns) P > 0.05). Source numerical data and unprocessed blots are available in source data. Source data
Extended Data Fig. 3
Extended Data Fig. 3. Cellular positioning of organelles is rewired upon inflammatory macrophage activation.
a Heatmaps representing the organelle distribution relative to the maximal distance from nucleus centre in BMDMs upon inflammatory activation (24 h LPS/IFN-γ or heat-killed S. aureus). Data are representative for N = 15 cells examined over n = 3 independent experiments. Dotted lines indicate borders of perinuclear, mid and peripheral zones. b Heatmaps depicting time-resolved organelle positioning upon LPS/IFN-γ treatment. Data represent the mean of N = 15 cells examined over n = 3 independent experiments. Dotted lines indicate borders of perinuclear, mid and peripheral zones. c Quantification of organelle distribution in perinuclear, mid and peripheral zones in BMDMs activated with LPS/IFN-γ (1–24 h) or heat-killed S. aureus (24 h). Bars show mean ± SEM of N = 15 cells examined over n = 3 independent experiments. d Immunofluorescence images depicting the organellome of LPS/IFN-γ-activated BMDMs (24 h) upon nocodazole treatment. Organelles were visualized using ERmoxVenus (ER, blue), HSP60 (mitochondria, red), Catalase (peroxisomes, cyan), LAMP1 (lysosomes, purple), Bodipy493/502 (lipid droplets, yellow) and GM130 (Golgi, green). Images are maximum intensity projections and are representative of n = 2 biological repeats. Scale bars: 10 µm. e-f Heatmaps showing changes in pair-wise organelle proximity sites (e) and organelle distribution (f) upon nocodazole treatment. Data represent the mean of N = 30 (e) and N = 15 (f) cells over n = 2 biological experiments (e-f). P values were obtained by two-tailed, unpaired t-test (* P ≤ 0.05, ** P ≤ 0.01, *** P ≤ 0.001, not significant (ns) P > 0.05) (e). Numerical P values are available in Supplementary Information Table 4. Source numerical data are available in source data. Source data
Extended Data Fig. 4
Extended Data Fig. 4. LD metabolism and the LD interactome is modified upon inflammatory macrophage activation.
a LD-organelle clusters identified in inflammatory macrophages (24 h). Boxes represent 25th to 75th percentiles, whiskers 10th and 90th percentiles. Dots are outliers, the median is shown as line. The percentage of LDs associated in multi-organelle clusters is depicted as mean ± SEM (top). Data represent N = 51 cells from n = 3 independent experiments. b Structured illumination images showing LDs and their surrounding organelles in LPS/IFN-γ-treated (24 h) BMDMs. Organelles were visualized using Calnexin (ER, blue), HSP60 (mitochondria, red), Catalase (peroxisomes, cyan) and Bodipy493/502 (LDs, yellow). Images are single LD-containing z-slices. Scale bars: 3 µm (top), 1 µm (bottom). c Quantification of LD-organelle clusters shown in (b). Data represent of N = 30 cells from n = 3 biological replicates. Boxes represent 25th to 75th percentiles, whiskers 10th and 90th percentiles. Dots are outliers, the median is shown as line. d LD multi-organelle units that are downregulated or not significantly altered upon LPS/IFN-γ treatment (as shown in (Fig. 2e)). Boxes represent 25th to 75th percentiles, whiskers 10th and 90th percentiles. Dots are outliers, the median is shown as line. Red colouring indicates significant changes. P values were generated using one-way ANOVA with Dunnett’s post-hoc test. e RNA-Sequencing analysis of LD metabolism- and b-oxidation-associated genes in naïve and LPS/IFN-γ-treated (24 h) BMDMs. Data represent N = 3 technical replicates from n = 1 biological replicate. Black font: P ≤ 0.05, grey font: ns P > 0.05. f-j Quantification of LD mass (f), cellular triglyceride (TG) content (g), cellular 13C-palmitate uptake (h), 13C-palmitate content in TG (i) and 13C palmitate oxidation (j) in LPS/IFN-γ-activated (24 h) BMDMs relative to controls. Data represent n = 4 (f) and n = 3 (g-j) biological replicates. P values were calculated using two-tailed unpaired (f, h, j) and paired (g) t tests. k 13C-glucose tracing analysis showing the contribution of glycolysis to fatty acid (FA) synthesis in the presence or absence of LPS/IFN-γ (24h). Data represent n = 8 (naïve) and n = 9 (LPS/IFN-γ) independent biological replicates. P value was obtained using two-tailed, unpaired t test. All bars show mean ± SD (f-k). Numerical P values are available in Supplementary Information Table 4 (*P ≤ 0.05, **P ≤ 0.01, ***P ≤ 0.001, ****P ≤ 0.0001, not significant (ns) P > 0.05). Source numerical data are available in source data. Source data
Extended Data Fig. 5
Extended Data Fig. 5. LD fuelling occurs along mitochondria and the ER.
a Live cell confocal imaging of inflammatory macrophages (LPS/IFN-γ 24 h) showing the flow of acutely injected RedC12 (yellow) in ER (blue) and LDs (Bodipy493/502, magenta). Dotted circles in magnifications indicate LDs. Images are single confocal z-planes and represent n = 3 experimental replicates. Scale bars: 5 µm, 2 µm (magnification). b Metabolic tracing analysis showing 13C-palmitate isotopologues identified in TGs of activated BMDMs (LPS/IFN-γ 24 h) in the presence or absence of the CPT1a inhibitor etomoxir (CPT1ai). Red boxes indicate M+16 and M+14, grey boxes M+30 and M+32 isotopologues. Data represent n = 3 biologically independent replicates. c Scheme depicting metabolites (black) and enzymes (red) of the LD biogenesis pathway. FA, fatty acid; FA-CoA, fatty acyl-CoA; PA, phosphatic acid, LPA, lysophosphatidic acid, DG, diacylglycerol; TG, triacylglycerol. d Immunofluorescence images showing the cellular distribution of ACSL1 in naïve and LPS/IFN-γ-treated BMDMs (24 h). Fluorescence intensities are displayed as glow heatmap (left). Magnifications show the localization of ACSL1 (yellow) to ER (blue) and mitochondria (magenta). Images show a single confocal z-plane and are representative of n = 3 biological replicates. Scale bars: 5 µm, 2 µm (magnification). e Live cell confocal imaging of inflammatory macrophages (LPS/IFN-γ 24 h) showing the localization of acutely injected RedC12 (yellow) to mitochondria (magenta) and peroxisomes (cyan). Arrows in magnifications indicate peroxisomes. Images are single confocal z-planes and are representative of n = 3 experimental repeats. Scale bars: 5 µm, 2 µm (magnification). Source numerical data are available in source data. Source data
Extended Data Fig. 6
Extended Data Fig. 6. Inhibition of LD biogenesis or lipolysis alters inflammatory fatty acid flow between organelles.
a Images showing the cellular distribution of RedC12 in LPS/IFN-γ-activated BMDMs (24 h) upon DGAT1i or ATGLi. RedC12 fluorescence intensities are displayed as glow heatmap (left). Magnifications show RedC12 (yellow) localizing to ER (blue) and mitochondria (magenta). Data are representative of n = 3 experimental repeats. Scale bars: 5 µm, 2 µm (magnification). b Relative TG content of LPS/IFN-γ-activated BMDMs (24 h) upon DGAT1i or ATGLi. Dotted line indicates TG levels of naïve macrophages. Data represent n = 3 biological repeats. P values were calculated using one-way ANOVA with Tukey’s post-hoc test. c,d 13C-palmitate metabolic tracing analysis showing the fatty acid oxidation (c) and the M+14 to M+16 ratio of 13C-palmitate isotopologues in TGs (d) of LPS/IFN-γ-activated BMDMs upon DGAT1i (c) or ATGLi (c,d). Data represent n = 3 biological repeats. P values were calculated using one-way ANOVA with Dunnett’s post-hoc (c) and two-tailed, paired t tests (d). e,f Images (e) and quantification (f) of RedC12 fluorescence in peroxisomes of LPS/IFN-γ-treated macrophages (24 h) with or without ATGLi. Scale bars: 5 µm, 2 µm (magnification). Data represent N = 40;41 (vehicle; ATGLi) cells from n = 3 biological replicates. Dots represent the MFI of individual cells. P value was calculated using two-tailed, unpaired t-test (f). g Images showing the cellular distribution of enzymes mediating TG and phospholipid arachidonic acid release (ATGL, cPLA2; left) and PGE2 biogenesis (Cox2, mPGES1, right) in LPS/IFN-γ-treated BMDMs representative of n = 3 biological replicates. Magnifications show their localization relative to LDs. Scale Bars: 5 µm (top), 1 µm (bottom). h Lysosome-containing LD-organelle units in young and aged LPS/IFN-γ-treated peritoneal macrophages. Boxes represent 25th to 75th percentiles, whiskers 10th and 90th percentiles. Dots are outliers, the median is shown as a line. Data represents N = 46;47 (young; aged) cells from n = 3 biological replicates. P values were obtained using Kruskal-Wallis with Dunnett’s post-hoc test. All images represent single confocal z-planes (a,e,g). The bars show the mean ± SEM (b), all other bars show mean ± SD (c, d, f). Numerical P values are available in Supplementary Information Table 4 (*P ≤ 0.05, **P ≤ 0.01, ***P ≤ 0.001, ****P ≤ 0.0001, not significant (ns) P > 0.05). Source numerical data are available in source data. Source data
Extended Data Fig. 7
Extended Data Fig. 7. MIGA2 increases LD mass but does not impair mitochondrial fatty acid synthesis or oxidation.
a Western Blot image of MIGA2 and its M-ER tethering-deficient mutant MIGA2DFFAT. Data is representative of n = 2 experimental repeats b,c LD number (b) and volume (c) in BFP or MIGA2 expressing cells. Data represent N = 51;55 (BFP; MIGA2) cells from n = 3 biological repeats. P values were obtained using two-tailed Mann Whitney tests. Boxes represent 25th to 75th percentiles, whiskers 10th and 90th percentiles. Dots are outliers, the median is shown as a line. Data represent N = 46;50 (BFP; MIGA2) cells from n = 3 biological replicates. d PGE2 levels of BFP or MIGA2-expressing LPS/IFN-γ-activated (24 h) BMDMs upon DGAT1i or ATGLi treatment. Data represent n = 3 biological replicates. P values were generated using one-way ANOVA with Sidak’s post-hoc test. e,f Metabolic tracing analysis showing FA synthesis from 13C-glucose (e) and FA oxidation from 13C-palmitate (f) in BMDMs expressing BFP or MIGA2 (LPS/IFN-γ 24 h). Data show n = 3 biological repeats. P values were calculated using two-tailed, unpaired t tests. g,h Representative Western Blot images (g) and quantification (h) showing protein levels of enzymes involved in FA release (ATGL, cPLA2) and PGE2 biogenesis (COX2, mPGES1) in LPS/IFN-γ-activated (24 h) BMDMs upon MIGA2 overexpression. Data represent n = 3 biological replicates. All bars show mean ± SEM (d-f). P values were calculated using two-tailed, one-sample t tests. Numerical P values are available in Supplementary Information Table 4 (*P ≤ 0.05, **P ≤ 0.01, ***P ≤ 0.001, ****P ≤ 0.0001, not significant (ns) P > 0.05). Source numerical data and unprocessed blots are available in source data. Source data
Extended Data Fig. 8
Extended Data Fig. 8. MIGA2 but not other M-ER-LD tethers contribute to macrophage PGE2 production.
a Images depicting M-ER-P-LD units in LPS/IFN-γ-activated BMDMs (24 h) expressing BFP, MIGA2 or MIGA2DFFAT. Images represent maximum intensity projections of n = 3 biolgocial replicates. Scale bars: 5 µm, 1 µm (magnification). b,c Pair-wise M-ER and M-LD high proximity sites (b) and MIGA2-regulated LD-units (c) in LPS/IFN-γ-treated (24 h) BMDMs expressing BFP, MIGA2 or MIGA2DFFAT. Data represent N = 48 (BFP), N = 48 (MIGA2) and N = 40 (MIGA2DFFAT) cells from n = 3 biologically independent replicates. Boxes represent 25th to 75th percentiles, whiskers 10th and 90th percentiles. Dots are outliers, the median is shown as a line. P values were obtained using one-way ANOVA with Dunnett’s post-hoc test. d Western Blot analysis showing knock-down (KD) efficiency of Mfn2 or Rmdn3 in BMDMs representative of n = 1 experiment. e Pairwise ER-mitochondria HPS analysis in Mfn2 KD, Rmdn3 KD or control BMDMs. Data represent N = 32;24;29 (shCtrl; Mfn2 KD; Rmdn3 KD) cells from n = 3 biological replicates. Boxes represent 25th to 75th percentiles, whiskers 10th and 90th percentiles. Dots are outliers, the median is shown as a line. P values were calculated using one-way ANOVA with Dunnett’s post hoc test. f-h PGE2 production of LPS/IFN-γ-treated BMDMs (24 h) upon Mfn2 and Rmdn3 KD (f), MFN2 and RMDN3 overexpression (g) or DGAT2 inhibition (DGAT2i) (h). Data represent n = 4 (f, Rmdn3 KD) and n = 3 (f, Mfn2 KD; g-h) biologically independent experiments. P values were calculated using two-tailed, one-sample t tests (f,h) or one-way ANOVA with Dunnett’s post-hoc test (g). Bars show mean ± SEM (f-h). Numerical P values are available in Supplementary Information Table 4 (*P ≤ 0.05, **P ≤ 0.01, ***P ≤ 0.001, ****P ≤ 0.0001, not significant (ns) P > 0.05). Source numerical data and unprocessed blots are available in source data. Source data
Extended Data Fig. 9
Extended Data Fig. 9. DRP1-regulated PGE2 production is not driven by changes in key mitochondrial functions.
a Western Blot analysis showing the KO efficiency of Drp1−/− macrophages obtained from Cx3cr1-Cre Drp1fl/fl mice representative of n = 3 biological replicates. b PGE2 levels of LPS/IFN-γ-activated (24 h) WT and Drp1−/− BMDMs treated with DGAT1i or ATGLi representing n = 4 biological replicates. P values were generated using one-way ANOVA with Sidak’s post-hoc test. c,d Western Blot images (c) and quantification (d) showing protein levels of enzymes involved in FA release (ATGL, cPLA2) and PGE2 biogenesis (COX2, mPGES1) in LPS/IFN-γ-treated WT and Drp1−/− BMDMs (24 h). Data represent n = 3 (COX2) and n = 4 (cPLA2, mPGES1) and n = 5 (ATGL) biological replicates (c,d). P values were obtained using two-tailed, one-sample t tests (d). e,f Metabolic tracing analysis of LPS/IFN-γ-activated WT and Drp1−/− BMDMs showing 13C-palmitate fueling in citrate (FA oxidation) (e) and 13C-glucose fueling into palmitate (FA synthesis) (f) from n = 3 biologically independent replicates. P values were obtained using two-way, unpaired t tests. g,h Mitochondrial (g) and cellular ROS (h) measurements in LPS/IFN-γ-treated (24 h) WT and Drp1−/− BMDMs obtained by flow cytometry in n = 3 biologically independent experiments. P values were calculated using two-way, unpaired t tests. i Quantification of mitochondrial DNA content in LPS/IFN-γ-activated WT and Drp1−/− BMDMs by qRT-PCR from n = 3 biological replicates. P value was obtained using two-way, unpaired t test (ns P > 0.05). j Measurement of mitochondrial membrane potential (TMRM) relative to MitoTrackerGreen in LPS/IFN-γ-treated WT and Drp1−/− BMDMs. Data represent n = 3 biological replicates. P value was obtained using two-way, unpaired t test. k Western Blot analysis showing the knock-out efficiency of Opa1−/− macrophages compared to WT BMDMs representative of n = 3 biological replicates l PGE2 levels produced by LPS/IFN-γ-activated WT or Opa1−/− BMDMs (24 h). Data represent n = 3 biologically independent replicates. P value was calculated using two-tailed, one-sample t test. All bars show mean ± SEM (b,d-j,l). Numerical P values are available in Supplementary Information Table 4 (*P ≤ 0.05, **P ≤ 0.01, ***P ≤ 0.001, ****P ≤ 0.0001, not significant (ns) P > 0.05). Source numerical data and unprocessed blots are available in source data. Source data
Extended Data Fig. 10
Extended Data Fig. 10. Increased peroxisome-LD tethering drives LD lipolysis and PGE2 production.
a,b Western Blot analysis showing the knock-out efficiency of Pex5−/− (a) and Abcd1 KD-efficiency (b) relative to control BMDMs representing n = 4;3 (Pex5−/−; Abcd1 KD) biological repeats. c,d Images (c) and quantification (d) of M-P-LD clusters in LPS/IFN-γ-activated (24 h) BMDMs upon ABCD1 expression. Images represent maximum intensity projections. Scale bars: 5 µm, 2 µm (magnification). Boxes represent 25th to 75th percentiles, whiskers 10th and 90th percentiles. Dots are outliers, the median is shown as a line. Data represent N = 48;53 (BFP; ABCD1) cells from n = 3 biological replicates. P values were obtained using one-way ANOVA with Sidak’s post-hoc test. e-f PGE2 levels of LPS/IFN-γ-treated (24 h) BMDMs expressing ABCD1 (e) or M1-Spastin (f) representing n = 3 biological replicates. P values were obtained using two-tailed, unpaired t tests (e,f). g,h Western Blot images (g) and quantification (h) showing protein levels of enzymes involved in FA release (ATGL, cPLA2) and PGE2 biogenesis (COX2, mPGES1) in LPS/IFN-γ-activated BMDMs upon Abcd1 KD. Data represent n = 3 biologically independent experiments (g,h). P values were obtained using two-tailed, one-sample t tests (h). i-j Triglyceride analysis showing TG levels in LPS/IFN-γ-activated (24 h) Pex5−/− (i) and Abcd1 KD BMDMs (j) relative to controls. Data represent n = 5;3 (i,j) biological replicates. P values were obtained using two-tailed, one-sample t tests. k,l TG arachidonic acid content (k) and release (k,l) of BFP and ABCD1 expressing cells from n = 3 biological replicates. P values were obtained using one-way ANOVA with Sidak’s post-hoc (k) and two-tailed, unpaired t tests (l) m Western Blot analysis showing the KO efficiency of Pex5−/− Drp1−/− and Drp1−/− BMDMs obtained from LysM-Cre Drp1fl/fPex5fl/fl and LysM-Cre Drp1fl/fl mice, respectively. Data represent n = 3 biological replicates n Western Blot analysis showing the efficiency of Mfp2 and Gnpat KD relative to control BMDMs representative of n = 2 independent repeats. All bars show mean ± SEM (e,f,h-l). Numerical P values are available in Supplementary Information Table 4 (*P ≤ 0.05, **P ≤ 0.01, ***P ≤ 0.001, ****P ≤ 0.0001, not significant (ns) P > 0.05). Source numerical data and unprocessed blots are available in source data. Source data

References

    1. Schrader, M., Godinho, L. F., Costello, J. L. & Islinger, M. The different facets of organelle interplay-an overview of organelle interactions. Front. Cell Dev. Biol.3, 56 (2015). 10.3389/fcell.2015.00056 - DOI - PMC - PubMed
    1. Rambold, A. S. & Pearce, E. L. Mitochondrial dynamics at the interface of immune cell metabolism and function. Trends Immunol.39, 6–18 (2018). 10.1016/j.it.2017.08.006 - DOI - PubMed
    1. Schuster, E. M. et al. TFEB induces mitochondrial itaconate synthesis to suppress bacterial growth in macrophages. Nat. Metab.4, 856–866 (2022). 10.1038/s42255-022-00605-w - DOI - PMC - PubMed
    1. Jha, A. K. et al. Network integration of parallel metabolic and transcriptional data reveals metabolic modules that regulate macrophage polarization. Immunity42, 419–430 (2015). 10.1016/j.immuni.2015.02.005 - DOI - PubMed
    1. Hsieh, W. Y. et al. Toll-like receptors induce signal-specific reprogramming of the macrophage lipidome. Cell Metab.32, 128–143 e125 (2020). 10.1016/j.cmet.2020.05.003 - DOI - PMC - PubMed

Publication types