. 2024 Nov;23(11):1575-1581.
doi: 10.1038/s41563-024-01942-9. Epub 2024 Jul 5.

Quantifying mechanical forces during vertebrate morphogenesis

Affiliations

Quantifying mechanical forces during vertebrate morphogenesis

Eirini Maniou et al. Nat Mater. 2024 Nov.

Abstract

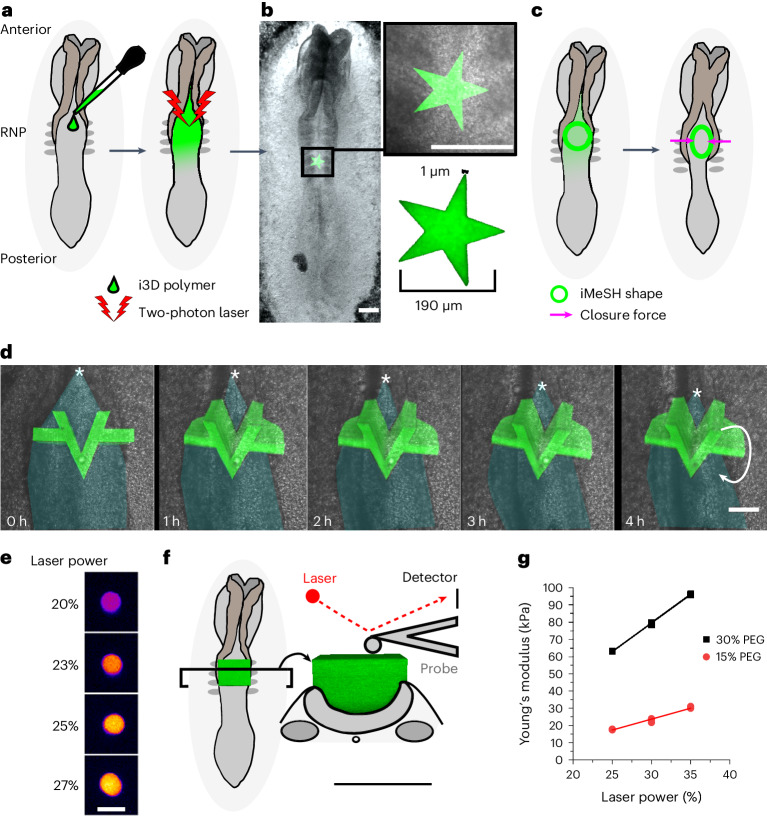
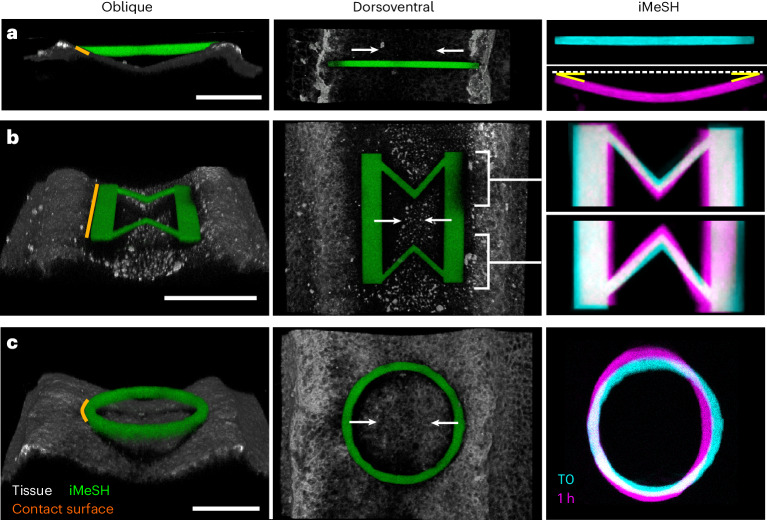
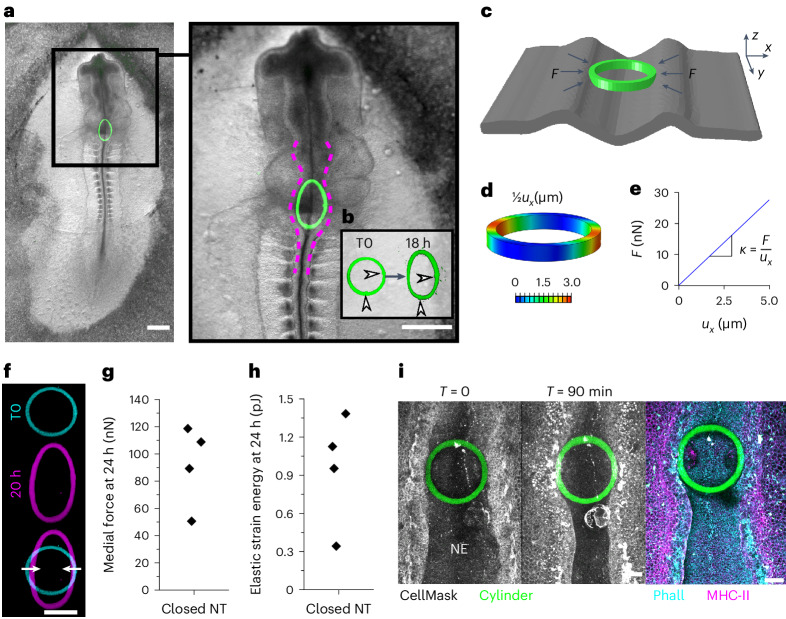
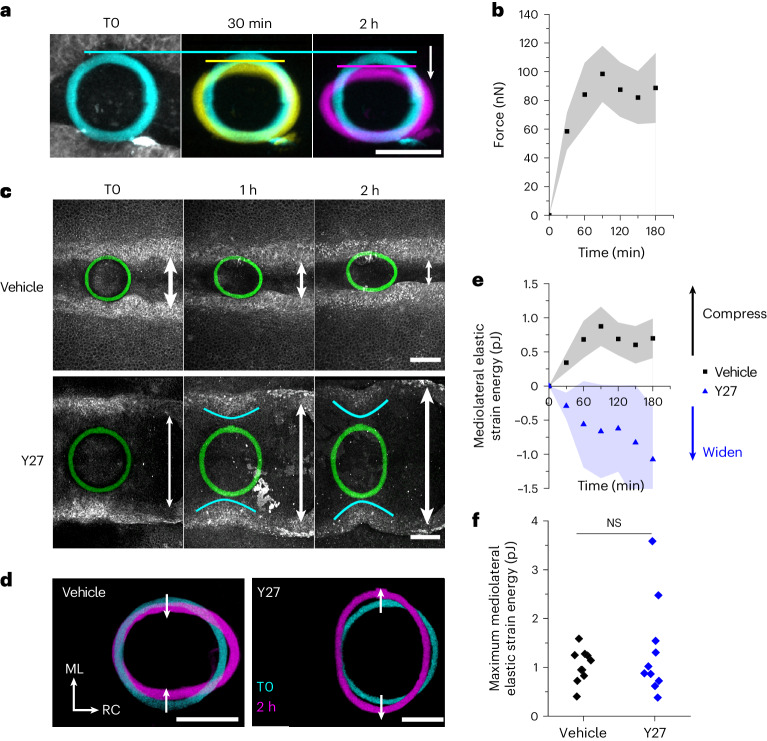
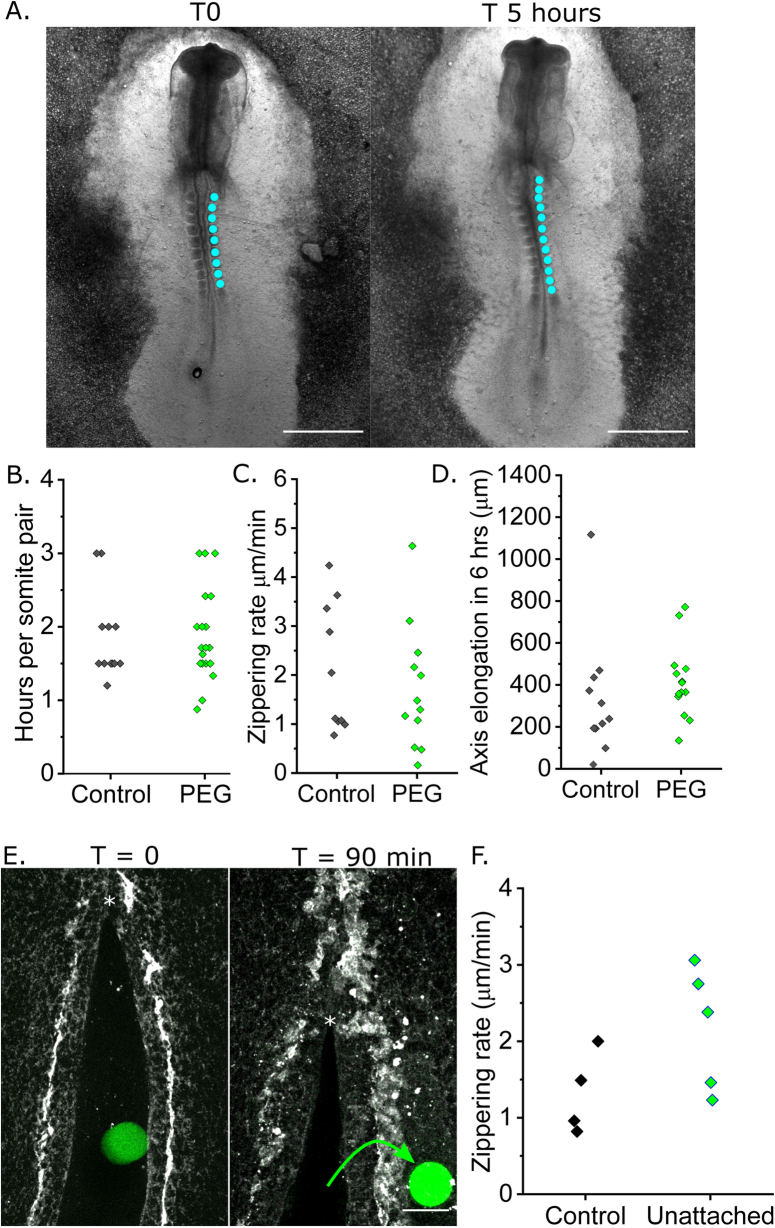
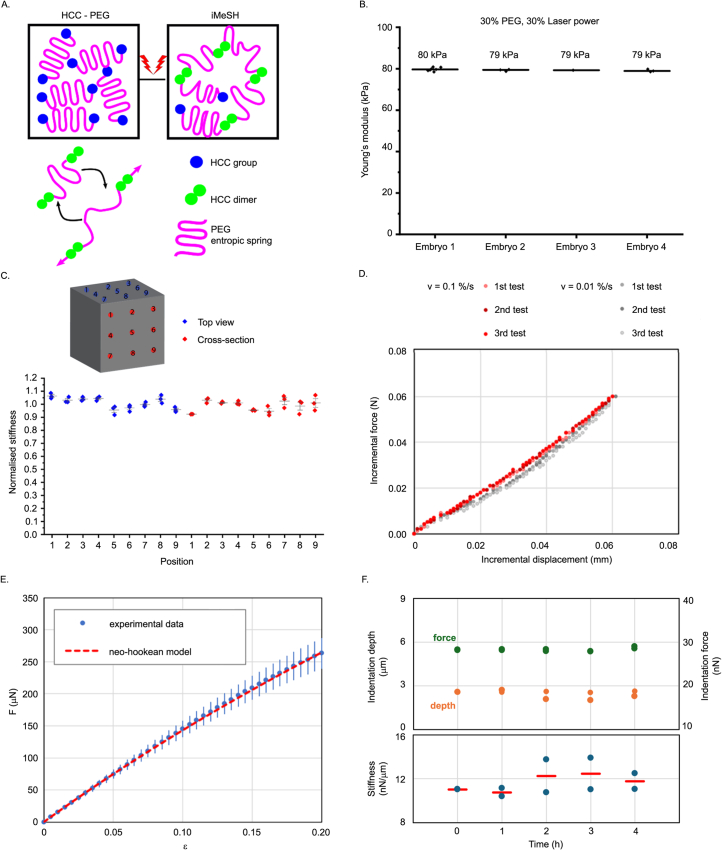
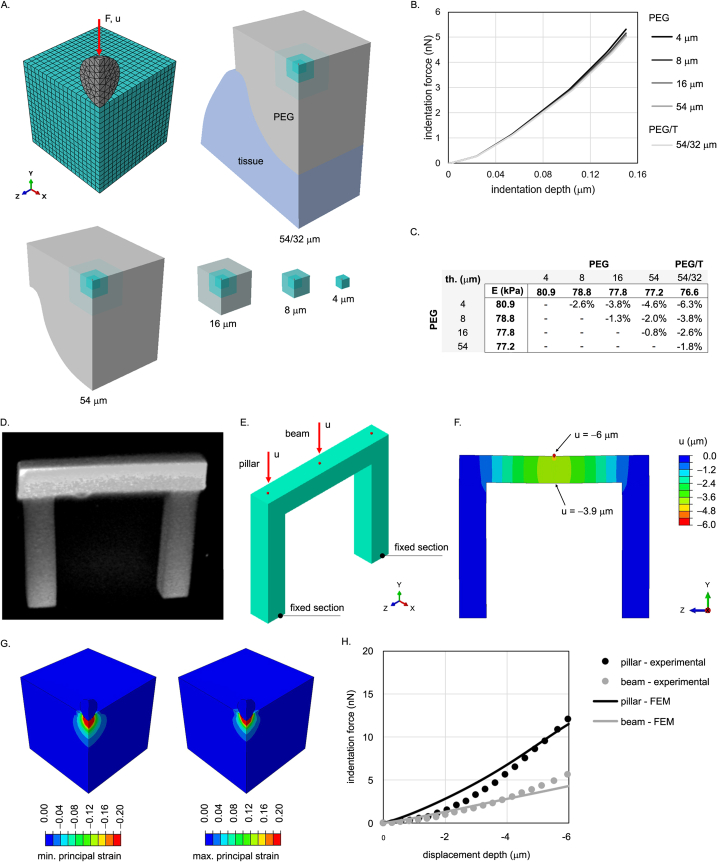
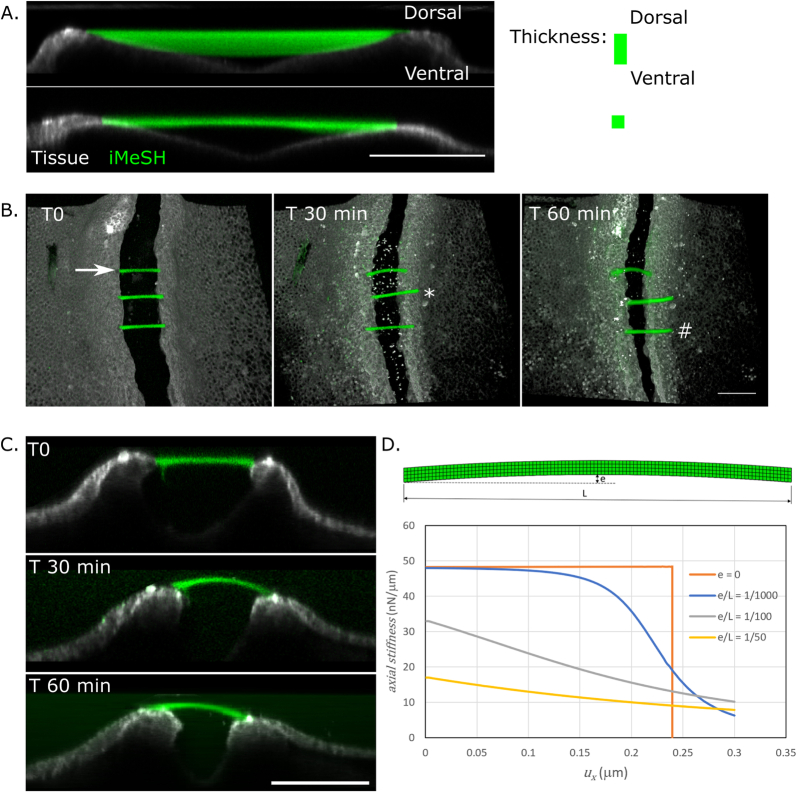
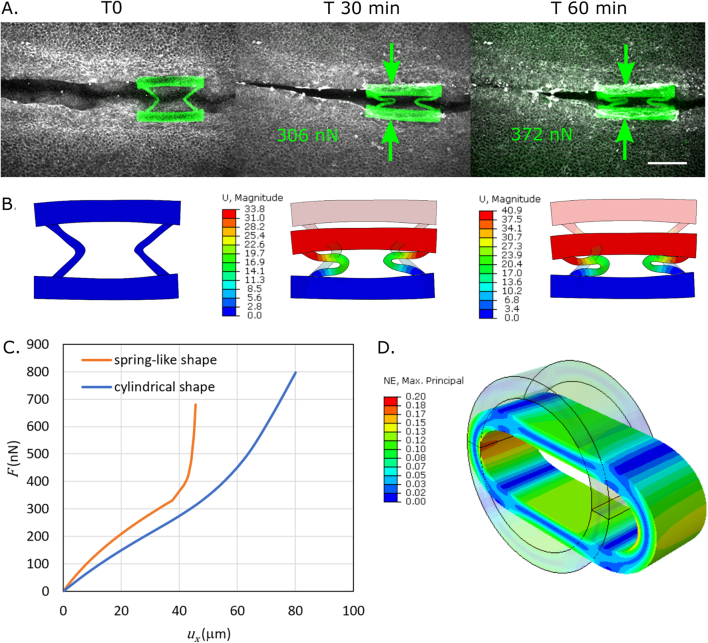
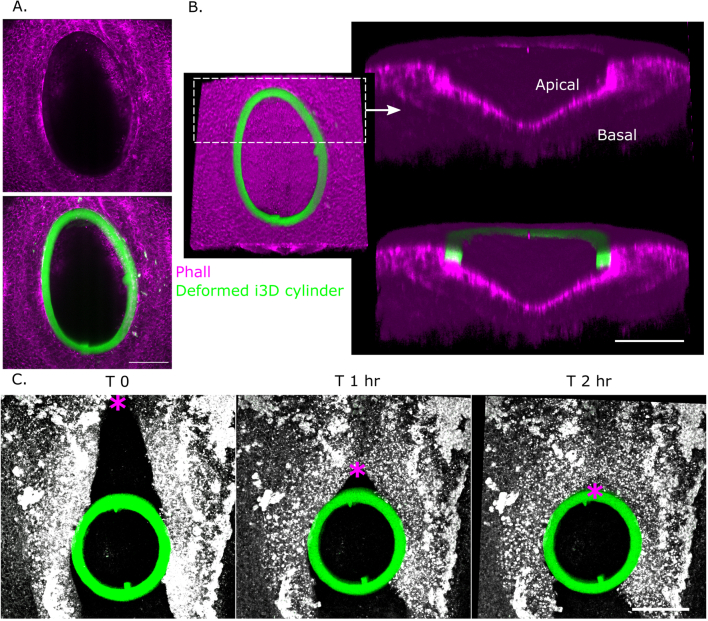
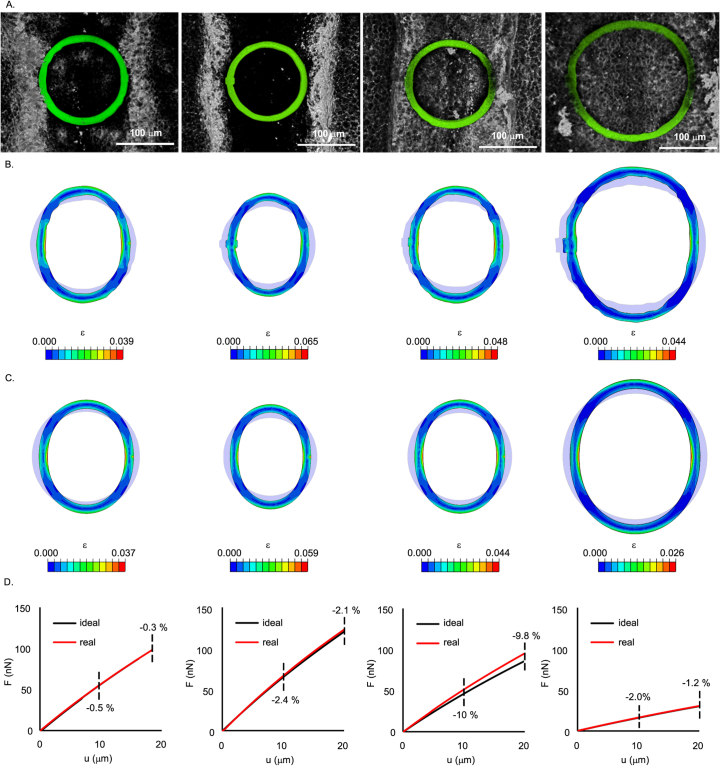
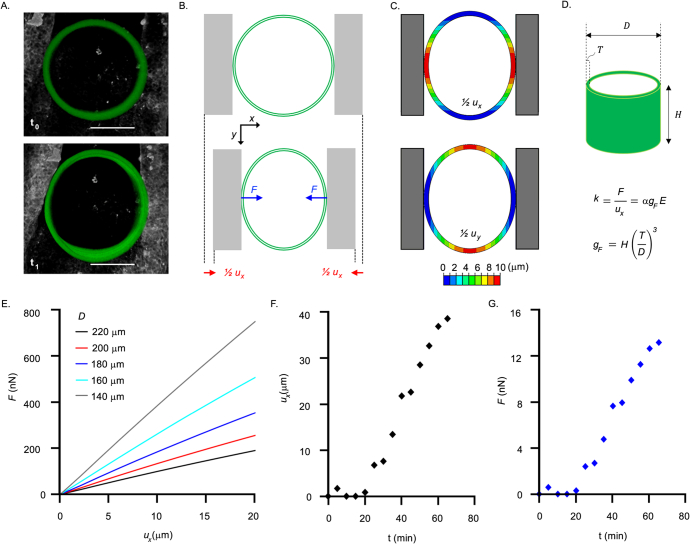
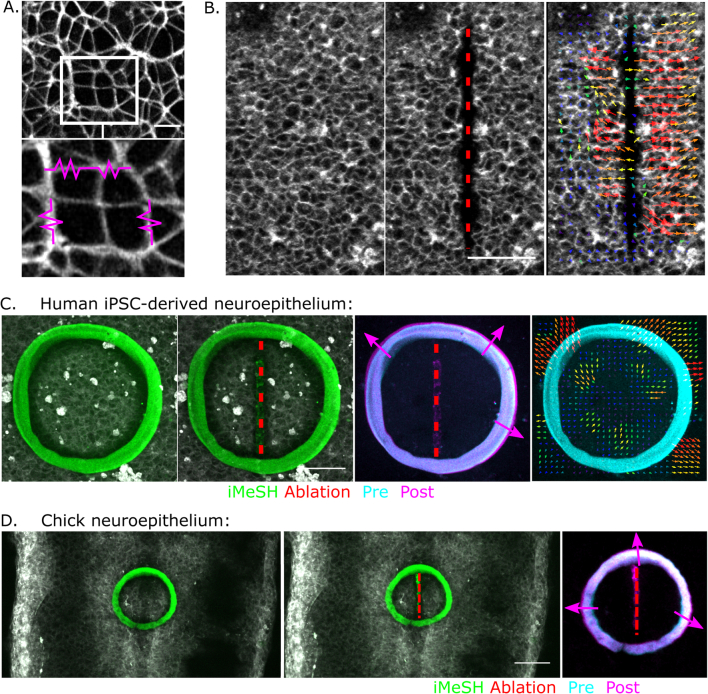
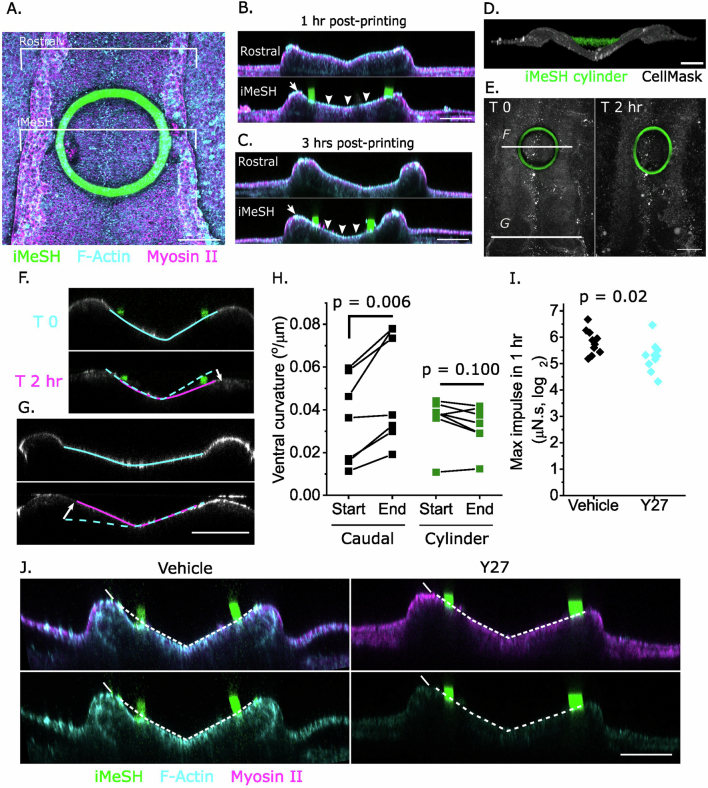
Morphogenesis requires embryonic cells to generate forces and perform mechanical work to shape their tissues. Incorrect functioning of these force fields can lead to congenital malformations. Understanding these dynamic processes requires the quantification and profiling of three-dimensional mechanics during evolving vertebrate morphogenesis. Here we describe elastic spring-like force sensors with micrometre-level resolution, fabricated by intravital three-dimensional bioprinting directly in the closing neural tubes of growing chicken embryos. Integration of calibrated sensor read-outs with computational mechanical modelling allows direct quantification of the forces and work performed by the embryonic tissues. As they displace towards the embryonic midline, the two halves of the closing neural tube reach a compression of over a hundred nano-newtons during neural fold apposition. Pharmacological inhibition of Rho-associated kinase to decrease the pro-closure force shows the existence of active anti-closure forces, which progressively widen the neural tube and must be overcome to achieve neural tube closure. Overall, our approach and findings highlight the intricate interplay between mechanical forces and tissue morphogenesis.


Conflict of interest statement

N.E. has an equity stake in ONYEL Biotech s.r.l. N.E. and A.U. are inventors of a patent for the use of HCC-hydrogels (patent applicant, ONYEL Biotech s.r.l.; patent number EP4138941). All other authors have no competing interests.

Figures

Fig. 1
Fig. 1. The i3D bioprinting with accurately determined position, geometry and stiffness.
a, Schematic of a chicken embryo illustrating the experimental workflow: 2–3 µl i3D polymer is pipetted directly onto the rhombocervical neuropore (RNP) and photo-crosslinked with a two-photon laser. The iMeSH structures are shown in green throughout. b, Stereoscope image of an embryo with a star shape photo- crosslinked on the flat neural plate. Scale bars, 200 µm. The star dimensions are indicated in the inset. c, Schematic showing iMeSH compression by apposition of the neural folds. d, Time-lapse images showing the sequential displacement of a rigid iMeSH shape, shown as a 3D confocal reconstruction superimposed on the embryo imaged with transmitted light. Cyan shading, open neural tube; *, zippering point; arrow indicates rotation of the printed shape; scale bar, 50 µm. The times are shown. e, Fire lookup table showing the autofluorescence of iMeSH photo-crosslinked with the indicated laser powers on the same embryo. Scale bar, 25 µm. f, Schematic illustration of AFM stiffness testing of an iMeSH shape; 3D reconstructions of the shape are shown superimposed on a dorsal and transverse schematic of the embryo. Scale bar, 100 µm. g, AFM quantification of iMeSH crosslinked on an embryo at the indicated laser powers. The values were calculated from AFM indentations performed at a rate of 0.5 μm s–1 and depths of 1 μm (30% 7-hydroxycoumarin-3-carboxylic acid (HCC) polyethylene glycol (PEG)) or 2 μm (15% PEG). Source data
Fig. 2
Fig. 2. Optimization of force sensor shapes to quantify morphogenetic forces.
ac, Oblique and dorsoventral 3D reconstructions of a horizontal bar (a), a double V-shaped spring (b) and a cylinder (c), iMeSH shapes printed between chick embryo neural folds. Overlaid initial (T0) and deformed (at 1 h) geometries are shown. Orange lines show tissue contacts along which force is applied; white arrows indicate the direction of neural fold apposition; and yellow angles indicate highly symmetrical deformation. Scale bars, 100 µm.
Fig. 3
Fig. 3. Quantification of medial force applied by the closed neural tube.
a, Bright-field view of a chick embryo 18 h after an iMeSH cylinder (green) was bioprinted within its open neural tube. Dashed lines indicate the neural folds. Scale bars, 500 µm. b, Confocal 3D reconstructions of the cylinder in the same embryo following bioprinting (T0) and 18 h later. Arrowheads indicate small landmarks incorporated in the cylinder, demonstrating minimal rotation. c, FEM model of an iMeSH cylinder and surrounding tissue based on 3D reconstruction of the specific morphometry, with the representation of contact forces (F) between tissue and cylinder. In the reference system, x is the medial–lateral direction, y the craniocaudal direction and z the dorsoventral direction. d, Contours of absolute displacement in the mediolateral direction (ux). e, Resultant contact force versus narrowing in the mediolateral direction. The slope of the curve corresponds to the cylinder structural stiffness, k. f, Projected image of a cylinder printed in a chicken rhombocervical neuropore immediately after printing and in a deformed state within the lumen of the neural tube 20 h later. Scale bar, 100 µm. g,h, Quantification of medial force applied (g) and elastic energy stored within compressed cylinders (h) incorporated in a partially closed neural tube (NT), 24 h after printing. Points represent individual embryos. i, Representative embryo immediately after iMeSH printing and 90 minutes later to visualise the iMeSH cylinder. The same embryo was fixed and stained with the plasma membrane dye CellMask, phalloidin (Phall) to label F-actin, and immuno-labelled to detect myosin heavy chain (MHC)-II. NE, neuroepithelium; T, time; scale bars, 50 µm. Source data
Fig. 4
Fig. 4. Dynamic quantification of morphogenetic mechanics during neurulation.
a, Illustrative iMeSH cylinder showing progressive medial displacement (arrow). The horizontal lines indicate the top of the cylinder. Scale bar, 50 µm. b, Dynamic profiling of medial compressive strain experienced by the iMeSH cylinder. Points represent the mean ± 95% confidence interval (CI), n = 10 vehicle-treated embryos. c, Sequential images at indicated time points in a vehicle-treated embryo and one treated with 20 µM of the ROCK inhibitor Y27632 (Y27). White arrows indicate the width of the neuropore. Cyan lines illustrate bending of the neural folds as they pull on the attached iMeSH cylinder. Scale bars, 100 µm. d, Merged reconstructions of the iMeSH cylinders in a at two time points. ML, mediolateral; RC, rostrocaudal. Scale bars, 100 µm. e, Dynamic profiling of mechanical force applied to the iMeSH cylinder. Points represent the mean ± 95% CI, n = 10 per group; vehicle embryos are those force-profiled in b. f, Maximum potential energy imparted by each embryo during live imaging. Points represent independent embryos. NS, not significant. Two-tailed t-test, P = 0.375. Source data
Extended Data Fig. 1
Extended Data Fig. 1. i3D polymer and printing do not diminish embryo development.
a. Brightfield images of a chick embryo in EC culture at T0 and T 5 hours. Cyan dots indicate somites. Scale = 500 μm. b-d. Quantification of parameters to compare growth between control embryos in EC culture and those treated with 30% HCC PEG liquid polymer. Points represent independent embryos. B. Rate of somite gain, n = 13 (control) and n = 21 (PEG). C. Caudal zippering point progression relative to a somite landmark, n = 10 (control) and n = 12 (PEG). D. Embryo axis elongation, n = 12 (control) and n = 15 (PEG). e. Sequential confocal images of a chick embryo posterior neuropore soon after i3D printing a pillar between its neural folds but not attached to its tissues, and 90 minutes later when theNunattached cylinder had been extruded from the neuropore (green arrow). * indicates thezippering point, scale bar = 50 μm. f. Quantification of rate of zippering point progression in the posterior neuropores of control embryos live-imaged without i3D printing (N = 4) and in embryos with unattached pillars printed inside their neuropore lumen (N = 5). Points represent individual embryos. Source data
Extended Data Fig. 2
Extended Data Fig. 2. Validation of i3D bioprinted structure material properties.
a. Schematic showing conversion of HCC-PEG polymer into an iMeSH structure through photocrosslinking using two-photon irradiation. Elastic PEG deformation caused by force application (magenta arrows) is schematically illustrated. b. AFM quantification of Young’s modulus of i3D shapes printed in four different embryos with equivalent polymerisation settings. The results have been derived from force-distance curves recorded at indentation depths of 3 μm and rates of 0.3 μm/s (Embryo 1,2,4) or 0.5 μm/s (Embryo 3). c. Repeated AFM measures on the top view and cut cross-section of a cube constructed by photo-crosslinking of 8 arm PEG B. The measured cube is shown schematically. Measurements were as indicated in the diagram, at 50 μm apart and repeated 3 times for each position. Thegraph represents normalised values of stiffness over the average stiffness of both top and cut cross-section. Points represent the 3 repeated measurements in each position, plotted also as mean value +/- standard deviation. Indentation was made with PARK pyramidal tip at 1um and velocity of 0.5 μm/sec. d. Incremental compressive force vs. displacement data for a sample of PEG hydrogel at repeated compressive loading at different strain rates (0.1 %/s and 0.01 %/s). Force and displacement increments are evaluated from the initial 5% pre-strain level. Three loading cycles are shown for each strain rate. The slope of the regression line corresponds to the stiffness of each sample. e. Stress-strain testing of i3D polymer and corresponding prediction derived from a neo-Hookean model. Points represent the mean +/- SEM, n = 8 i3D shapes. f. Indentation force, indentation depth, and stiffness vs. time from AFM indentation at constant imposed force on two PEG hydrogel samples. The stiffness values are calculated as ratio of indentation force and corresponding indentation depth. The almost constant values of indentation depth and stiffness vs. time (up to 4 hours), show the elastic behaviour of PEG hydrogel. Source data
Extended Data Fig. 3
Extended Data Fig. 3. In silico analysis of AFM testing procedure and bending deformation of a bridge structure.
a. Detail of FEM models in the contact region for a spherical indenter with diameter 0.8 μm. The mesh density in the contact region is the same for all the models. A double plane symmetry (X-Y and Z-Y) is considered. Geometry of the FEM models, assuming different thickness of PEG (4 μm, 8 μm, 16 μm, 54 μm), also in contact with embryonic tissue (PEG/T 54/32 μm), under the indentation region. Young’s modulus was set to 80 kPa and 8 kPa for PEG and embryonic tissue, respectively, with Poisson’s ratio of 0.49 for both materials. b. Indentation force vs. indentation depth for the different FEM models as estimated from the numerical analyses. c. Young’s modulus E estimated through a fitting procedure of the Hertz contact formula to the data of indentation force vs. indentation depth. At the intersection of each row and column, it is possible to get the percentage difference between the values of the Young’s modulus estimated for each pair of geometric configurations. These values are low, showing that the estimation of the Young’s modulus of PEG is marginally affected by the boundary conditions of the samples. d. Representative image of the bridge structure measured by AFM. 8 arm PEG A was photocrosslinked on functionalised PEG A glass slides to ensure attachment. e. FEM model geometry of the bridge sample tested with AFM indentation. Pillars and beam have a square transversal section with size 100 μm; the axis length is 550 μm and 600 μm for pillars and beam, respectively. The base of the pillars is fixed, to resemble the connection of the sample to the glass slide used in the experiments. The AFM indentation is performed by using a spherical indenter with diameter of 10.8 μm and cantilever stiffness of 2.9N/m. The indenter is applied on the top section of the pillars and on the middle section of the beam (separately). f. Colour map of the displacement (Y axis) for an indentation of 6 μm in the middle section of the beam. The displacement field shows that the beam also undergoes a bending deformation. g. Colour maps of maximum and minimum principal values of the nominal strain in the region of indentation for the case of indentation in the middle section of the beam. h. Indentation force vs. indentation depth measured by AFM experiment and estimated by FEM simulation. The data show a lower stiffness for the indentation in the middle section of the beam, because in this condition the indentation force is also affected by the bending deformation. Source data
Extended Data Fig. 4
Extended Data Fig. 4. Horizontal bar force sensors.
a. Horizontal bars printed superficially or to greater ventral depth between the neural folds of different embryos, showing ability to generate structures suspended between embryonic tissues.Images are representative of more than 3 replicates of thin and thick structures. b. Time series showing variable deformation of three bars between the neural folds of the same embryo. Arrow: shown in (C). *: quickly detaches. #: initially deforms, then detaches. c. Optical re-slice of the bar indicated by an arrow in (B) showing homogenous dorsal bending. d. Idealised FEM model showing highly non-linear force-displacement relationship between bars with slight differences in initial curvature. Perfectly straight bars (e = 0) resist very high axial force before deforming suddenly. Scale bars = 100 μm throughout. Source data
Extended Data Fig. 5
Extended Data Fig. 5. ‘V’ spring force sensors.
a. Confocal time series showing progressive deformation of a double ‘V’ iMeSH between chick neural folds. Green arrows indicate the direction of force application. Force values are those calculated from an individualised FEM models in (B). Scale bar = 100 μm. b. Individualised FEM models for the iMeSH shape in (A) showing agreement between empirically observed and modelled shape deformation. c. Force-displacement modelling of a double ‘V’ spring shape contrasted with a simple cylinder shape. Note the highly non-linear relationship of the ‘V’ springs compared with a cylinder shape. d. Visualisation of extreme deformation of an idealised iMeSH cylinder, exceeding deformations observed in vivo, compressed up to a 46% reduction of the initial diameter. This deformed configuration corresponds to a maximum local strain of 20%. Ad-hoc FEM models are required for higher deformation ranges. Source data
Extended Data Fig. 6
Extended Data Fig. 6. i3D cylinder incorporation within the closing neural tube.
a, b. Representative embryo (of 4 independent embryos cultured overnight) showing encircling of an i3D cylinder by the surface ectoderm and neural folds, leaving an open defect, shown as maximum projections (A) and 3D confocal reconstructions (B). Note the persistent apical enrichment of phalloidin-labelled neuroepithelial F-actin. Scale bar = 100 μm. c. Live-imaging of a CellMask-labelled embryos (representative of 6 independent embryos with stiff cylinders) showing progression of rostral-to-caudal zippering (*) until it encircles a stiff cylinder incorporated within its neural folds. Note triangle and square shapes incorporated in the cylinder illustrating control over printed geometries and lack of rotation. Scale bar = 100 μm. Source data
Extended Data Fig. 7
Extended Data Fig. 7. Effect of geometrical inhomogeneities on contact force quantification.
a. Four examples, from independent embryos, of iMeSH cylinder with different levels of irregularity in the wall thickness and diameter. Scale bar = 100 μm. b. Contours of the logarithmic strain in the medial-lateral direction of specific iMeSH cylinders with real geometry, featuring inhomogeneities in the wall thickness and diameter. c. Contours of the logarithmic strain in the medial-lateral direction of idealised iMeSH cylinders, with constant wall thickness and diameter, corresponding to the mean value of the realNones. d. Comparison of force-displacement curves of real and idealized iMeSH cylinders. TheNpercentage errors due to modelling of an idealized geometry with respect to real one are reported at two values (10 μm and 20 μm) of the displacement in the medial-lateral direction. Source data
Extended Data Fig. 8
Extended Data Fig. 8. Development of Finite Elements Method (FEM) models and derivation of a parametrized equation to evaluate force from cylinder iMeSH shapes.
a. Dorsoventral view of an i3D cylinder incorporated within the neural folds of a representative chick embryo at different time points (t0 = 0, t1 = 65 min). Scale bar = 100 μm. b. Scheme showing the compressive force F on the cylinder walls, due to the growth and folding of the neural tube, and the corresponding deformation of the cylinder. In the reference system, x is the medial-lateral direction and y the cranio-caudal direction. c. Contours of absolute displacement in the medial-lateral direction (ux) and in the cranio-caudal direction (uy). The cylinder narrowing in the medial-lateral direction from experimental data is the input of numerical analysis, which allows to estimate the corresponding contact force. d. The cylinder stiffness k, as the ratio between the contact force F and the displacement ux, is proportional to the hydrogel Young’s modulus E and to a geometric factor gF, which depends on cylinder height H, diameter D and wall thickness T. The scalar α in the parametric equation is a fitting constant (α = 7.718). e. Contact force (F) versus displacement (ux) for cylinders with the same height (H = 100 mm), thickness (T = 25 mm) and elastic modulus (E = 80 kPa) and varying diameter D, from numerical analyses. f. Displacement (ux) versus time (t) measured in a i3D cylinder incorporated in a chick embryo at different time points in a representative experiment. g. Contact force values versus time estimated via the parametric equation using experimental displacement data as input. Source data
Extended Data Fig. 9
Extended Data Fig. 9. iMeSH cylinders can be directly attached to tissues.
a. Apical surface of an iPSC-derived neuroepithelial cell layer showing cortical F-actin expected to be under tension (magenta springs). Scale bar = 10 μm. b. Laser ablation of a vertical line in the apical surface of a live-imaged iPSC-derived neuroepithelium. Arrows indicate displacement visualised by PIV. Scale bar = 50 μm. c, d. iMeSH cylinders were printed attached to the apical surface of iPSC-derived neuroepithelial cells (C) or chick embryos (representative of 7 embryos with laser ablations with printed cylinders) (D). A straight laser ablation (dashed red line) is created in the neuroepithelium and the iMeSH re-imaged immediately after. Merged and PIV visualisation illustrate cylinder expansion, absorbing elastic energy released from the ablation site. Images are representative of 6 independent wells. Green fluorescence along the ablation line is present even without i3D polymer and likely reflects a change in laser-ablated CellMaskTM used to visualise cell borders. Scale bars = 50 μm. Source data
Extended Data Fig. 10
Extended Data Fig. 10. iMeSH cylinders do not disrupt tissue morphology and allow to quantify actomyosin-dependent pro-closure impulse.
a. Dorsoventral confocal image showing F-actin and myosin-II wholemount staining of a chick embryo with an iMeSH cylinder between the neural folds. Note this also illustrates the robust attachment of iMeSH to tissues, withstanding washes in solution and repositioning for imaging. Brackets through the iMeSH and 100 μm rostral to it indicate the positions of optical crosssections in B-C. b, c. Optical cross-sections through actomyosin-stained embryos fixed 1 hour or 3 hours following iMeSH printing. Arrowheads indicate persistent apical F-actin enrichment, arrows indicate normal morphology of the neural fold tips lateral to the iMeSH. In A-C: images are representative of 3 independent embryos. Scale bars = 100 μm. d. 3D reconstruction showing an iMeSH cylinder suspended between the RNP neural folds. Scale bar = 100 μm. e. Projections showing cylinder deformation over two hours. F and G indicate the positions of the corresponding panels. Scale bar = 100 μm. f, g. Optically-resliced projections showing the curvature of the ventral neuroepithelium (annotated) below the neural fold tips. Dashed lines indicate the T0 apical contour, and the white arrows indicate the change in bending. Scale bar = 50 μm. h. Quantification of the ventral neuroepithelial curvature at the start of imaging and 1.5-2 hours later in seven independent embryos caudal to, or at the level of, the cylinder. P values by twotailed T-test paired by embryo. i. Impulse was calculated as the maximum force applied to the i3D cylinder within 1 hour. Points represent independent embryos. Log2-normalised values of vehicle embryos are compared against Y27-treated embryos by t two-tailed test, n = 10 per group. j. Optical cross-sections through the neuroepithelium of wholemount stained vehicle and ROCKinhibited embryos with iMeSH cylinders showing diminished F-actin in the latter. Scale bar = 50 μm. Images are representative of 3 independent embryos per treatment group. Source data

References

    1. Zhu, M. & Zernicka-Goetz, M. Principles of self-organization of the mammalian embryo. Cell183, 1467–1478 (2020). - PMC - PubMed
    1. Collinet, C. & Lecuit, T. Programmed and self-organized flow of information during morphogenesis. Nat. Rev. Mol. Cell Biol.22, 245–265 (2021). - PubMed
    1. Boyle, B. et al. Estimating global burden of disease due to congenital anomaly: an analysis of European data. Arch. Dis. Child. Fetal Neonatal Ed.103, F22–F28 (2018). - PMC - PubMed
    1. Zaganjor, I. et al. Describing the prevalence of neural tube defects worldwide: a systematic literature review. PLoS ONE11, e0151586 (2016). - PMC - PubMed
    1. Nikolopoulou, E., Galea, G. L., Rolo, A., Greene, N. D. & Copp, A. J. Neural tube closure: cellular, molecular and biomechanical mechanisms. Development144, 552–566 (2017). - PMC - PubMed

Substances

LinkOut - more resources