. 2024 Jul;56(7):1434-1445.
doi: 10.1038/s41588-024-01799-3. Epub 2024 Jul 5.

Saturation genome editing of BAP1 functionally classifies somatic and germline variants

Affiliations

Saturation genome editing of BAP1 functionally classifies somatic and germline variants

Andrew J Waters et al. Nat Genet. 2024 Jul.

Abstract

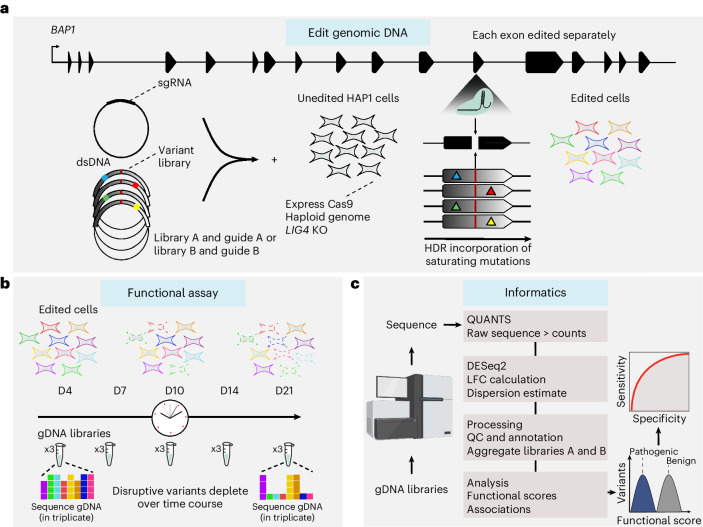
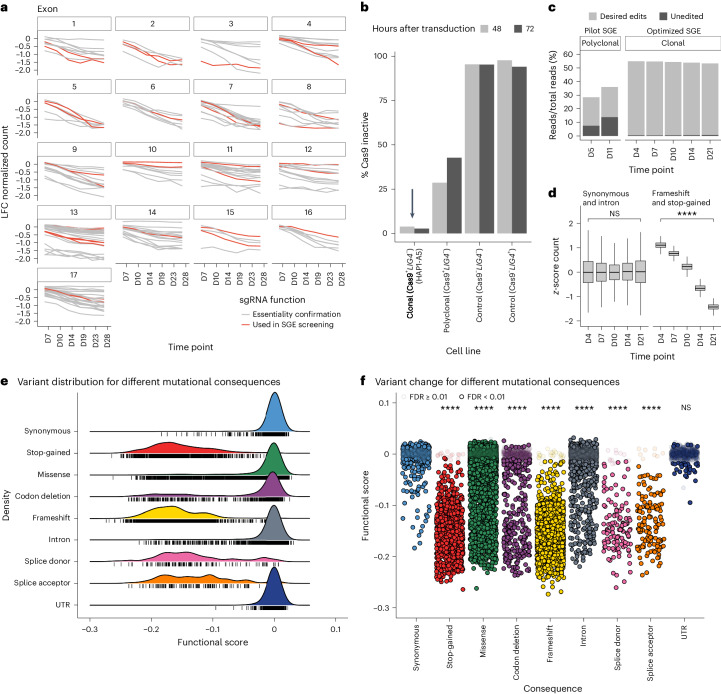
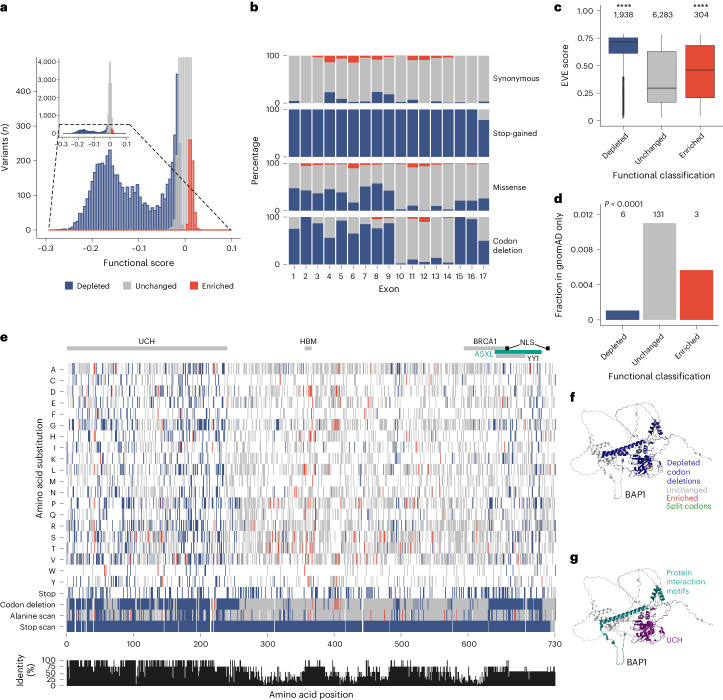
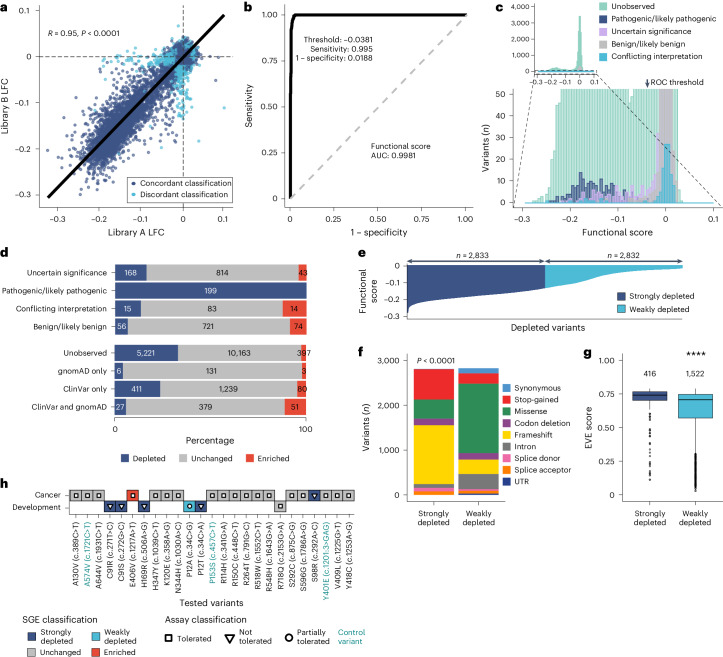
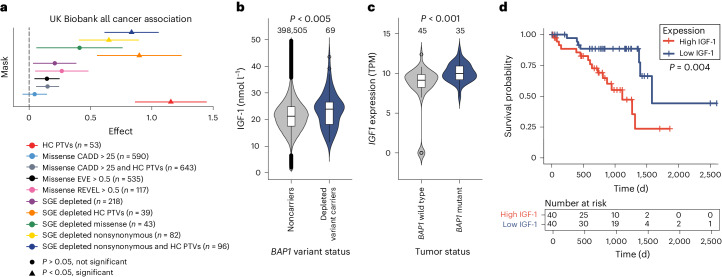
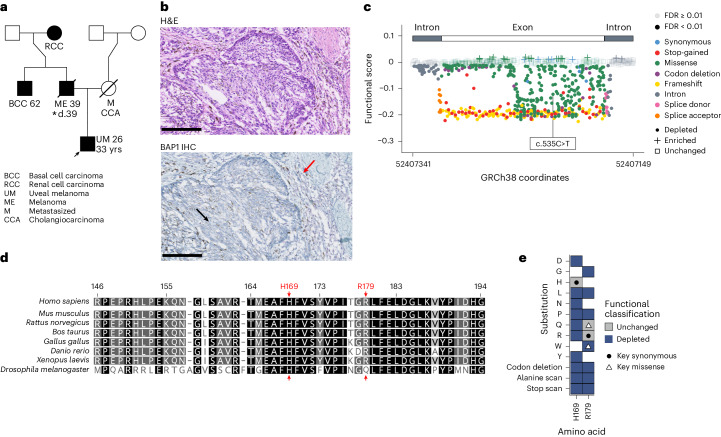
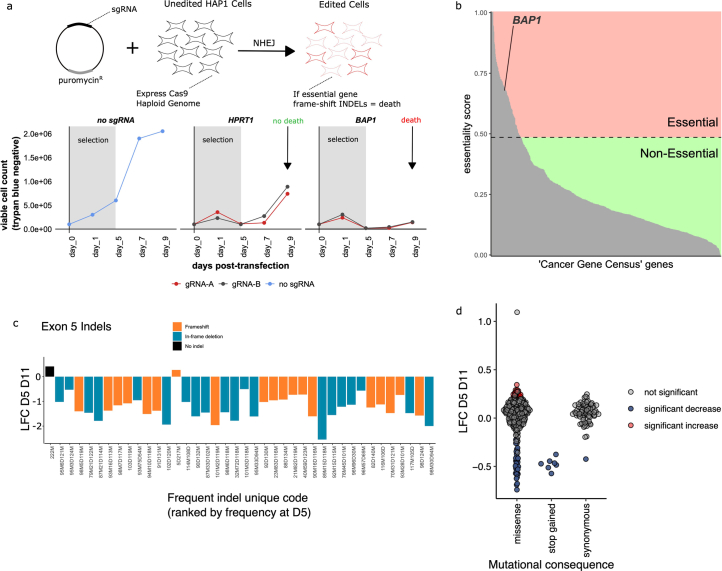
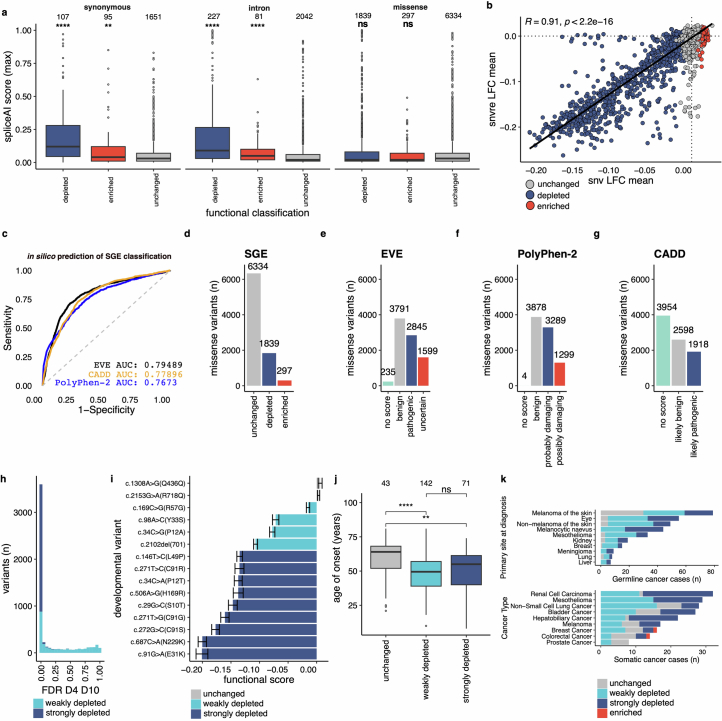
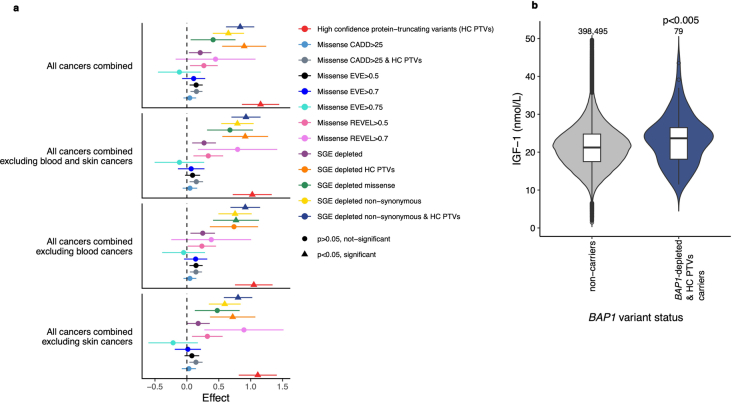
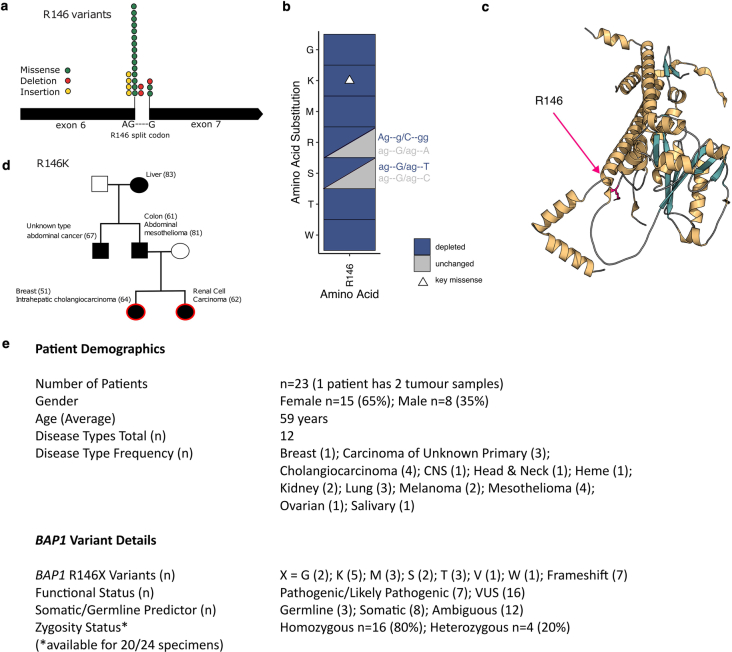
Many variants that we inherit from our parents or acquire de novo or somatically are rare, limiting the precision with which we can associate them with disease. We performed exhaustive saturation genome editing (SGE) of BAP1, the disruption of which is linked to tumorigenesis and altered neurodevelopment. We experimentally characterized 18,108 unique variants, of which 6,196 were found to have abnormal functions, and then used these data to evaluate phenotypic associations in the UK Biobank. We also characterized variants in a large population-ascertained tumor collection, in cancer pedigrees and ClinVar, and explored the behavior of cancer-associated variants compared to that of variants linked to neurodevelopmental phenotypes. Our analyses demonstrated that disruptive germline BAP1 variants were significantly associated with higher circulating levels of the mitogen IGF-1, suggesting a possible pathological mechanism and therapeutic target. Furthermore, we built a variant classifier with >98% sensitivity and specificity and quantify evidence strengths to aid precision variant interpretation.


Conflict of interest statement

The authors declare no competing interests.

Figures

Fig. 1
Fig. 1. Experimental design and workflow for SGE of the BAP1 locus.
a, Target regions of ≤245 bp were designed for all coding exons of the canonical BAP1 transcript: ENST00000460680.6 (ref. ). Target regions were processed in separate experiments to sequentially cover all regions. For each region, LIG4-KO, Cas9-expressing HAP1-A5 cells were transfected in triplicate with an sgRNA-expressing plasmid and a corresponding variant library; homologous recombination with this template library at the Cas9 lesion/cut site results in the introduction of variants into the genome, generating populations of edited cells. This allows for assessment of variant function, because only benign variants will rescue cell fitness following CRISPR−Cas9-mediated disruption of BAP1, an essential gene. Each region was edited separately using two independent template library−sgRNA pairs; each variant library (library A or library B) contained saturating mutations (colored squares) and library-specific synonymous PPEs (dark red line) to prevent sgRNA−Cas9-mediated recutting of incorporated genomic tracts. dsDNA, double-stranded DNA. b, Cells were cultured over time with pellets collected at D4, D7, D10, D14 and D21. gDNA, genomic DNA. c, Sequencing was used to assess the population dynamics of genomic DNA libraries, generating counts for each variant using the QUANTS pipeline. DESeq2 was used to convert counts into an LFC of variant abundance over time. LFCs were then median scaled and a single functional score was computed through the aggregation of library A and library B data. Functional scores were categorized on the basis of a significance threshold and assessed for accuracy against variants with known pathogenic or benign classifications.
Fig. 2
Fig. 2. Cell fitness/essentiality using optimized SGE reports the mutational consequences of editing of the BAP1 locus.
a, A targeted CRISPR−Cas9 screen in HAP1-A5 cells confirmed BAP1 essentiality and permitted selection of sgRNAs with favorable depletion kinetics for use in SGE (Methods). b, FACS analysis counts (green fluorescent protein (GFP)-positive cells) demonstrated that the HAP1-A5 clone has very high Cas9 activity (arrow), measured at 48 and 72 h after transduction with a GFP/blue fluorescent protein (BFP) activity construct (Methods: ‘Ploidy and FACS analysis’), compared to the parental ‘Polyclonal (Cas9+ LIG4)’ line. A total of 10,000−20,000 cells were analyzed for each line. Cell count percentages derived from negative-control lines with no Cas9 showed expected low levels of Cas9 activity (see Extended Data Fig. 1a and Supplementary Fig. 1a for representative FACS data). c, Editing using pilot SGE conditions: a template library (496 variants) coupled with sgRNA-A targeting exon 5 of BAP1 was transfected into the polyclonal (Cas9+ LIG4) line and cells were sampled at D5 and D11 (time points previously used in SGE). More than 10% of the counts were unedited (wild type), which decreased to <1% when the clonal (Cas9+ LIG4) cell line (HAP1-A5) was edited using the same sgRNA and HDR homology arms with optimized SGE conditions, including a high-complexity template library (1,040 variants) sampled over five time points. d, Count abundance for variants that resulted in synonymous changes or edited intronic regions did not change significantly over a 21-day SGE screen (two-sided Mann−Whitney–Wilcoxon test; D4 versus D21 counts, P = 0.3; NS, not significant), whereas variants resulting in stop-gained and frameshift consequences were significantly depleted (****P < 2.2 ⨯ 1016; n = 8,707 synonymous and intronic variants; n = 5,628 frameshift and stop-gained variants; mean z-score counts of three biological replicates at each time point). Boxes show the interquartile range, the horizontal lines show the median z-score count and whiskers show the maximum and minimum values that are not outliers. e, Density plot showing functional scores colored by Ensembl Variant Effect Predictor (VEP) mutational consequence. Black tick marks represent single variant values. f, Jitter plot showing VEP mutational consequence categories versus functional score. Data points that have FDR ≥ 0.01 are semitransparent and the median synonymous functional score differs significantly from that for all other categories except UTR (Kruskal−Wallis test: P < 2.2 ⨯ 1016, H = 6,692.2; two-sided Dunn’s BH FDR ****q < 2.2 ⨯ 1016). Source data
Fig. 3
Fig. 3. Functional classification of BAP1 variants.
a, Histogram showing all 18,108 unique variants assayed, grouped into 75 intervals and colored according to functional classification. Inset shows a magnified section of functional score intervals with ≤500 variants. b, Composition of functional classes by exon and mutational consequence (color key as in a). c, EVE scores for functional classes (n variants in class shown). Both depleted and enriched classes have significantly different median values from the unchanged class (Kurskal−Wallis, P < 2.2 ⨯ 10−16; two-sided Dunn’s BH FDR, ****q < 0.0001; depleted q < 2.2 ⨯ 10−16 and enriched q = 3.4 ⨯ 10−5), demonstrating that depleted and enriched variants are less represented over evolution compared to unchanged variants and are therefore more likely to be disruptive. Boxes show the interquartile range, horizontal lines show the median EVE score, whiskers show maximum and minimum values that are not outliers, and outliers are shown as points. d, The bar chart shows the number of variants in each class that are in gnomAD and not ClinVar (n shown) divided by the number of variants in each class assayed. Fewer depleted and enriched variants than unchanged variants were observed in gnomAD (two-sided chi-squared test: χ2 = 49.1, P < 2.14 ⨯ 10−11). e, Heat map showing amino acid-level substitutions (‘A’:‘stop’) created by nucleotide-level saturation across 730 codons (single nucleotide variants (SNVs) only), colored by functional classification (SNV missense changes with discordant functional classifications between alternative codons were excluded; n = 158). Of note, ‘codon deletion’, ‘alanine scan’ and ‘stop scan’ changes were designed to be incorporated at each of the 720 nonsplit codons (of 730 total codons). Bar chart shows the percentage identity calculated from Geneious alignment of the eight species shown in Fig. 6d. Key protein regions are shown (UCH, ubiquitin C-terminal hydrolase; HBM, HCF1 binding motif; BRCA1, BRCA1 binding domain; ASXL, additional sex combs like 1/2/3 interaction; YY1, Ying Yang 1 binding domain; NLS, nuclear localization signal). f,g, AlphaFold BAP1 model with SGE-depleted codon deletions colored dark blue (f). Depleted codon deletions accurately delineate the UCH domain (purple) and protein interaction region (cyan), as highlighted in g. Depletion also occurs in uncharacterized regions, including the α-helix C terminal to the UCH domain, proximal to the protein interaction region (arrow, f). Source data
Fig. 4
Fig. 4. SGE data are technically robust and provide highly accurate clinical classification.
a, Independent SGE libraries (A and B) were used to edit most target regions with 13,106 of 14,624 variants showing a concordant functional classification (dark blue) and 1,518 variants discordant between libraries (light blue). Of note, the degrees of LFC for each independent variant measurement were highly concordant based on Pearson’s correlation coefficient (R) and two-tailed t-test P < 2.2 ⨯ 10−16. b, ROC curve for SGE functional score, with AUC value shown. Also shown is the ideal threshold for maximum diagnostic sensitivity and specificity (plotted as ‘1 − specificity’). Calculated using pROC (version 1.18.4) in R. c, Top, a histogram showing the 18,108 unique variants grouped within 75 intervals of functional score, colored by ClinVar clinical significance. Bottom, a magnified region highlights that pathogenic/likely pathogenic (dark blue) variants are depleted. The arrow shows the x-axis position of the ideal threshold. d, Top, functional classification by ClinVar clinical significance (≥1*, 4 September 2023). Bottom, functional classification by observation in ClinVar and gnomAD (n variants shown). e, Depleted variants (n = 5,665) categorized into strongly depleted (lower 50%, dark blue) and weakly depleted (upper 50%, light blue) variants, either side of the median functional score (−0.1260642). f, More frameshift and stop-gained variants and fewer missense variants were strongly depleted compared to weakly depleted variants (two-sided chi-squared test, χ2 = 10,759, P < 2.2 ⨯ 10−16). g, Strongly and weakly depleted missense variants have significantly different EVE scores (two-sided Mann−Whitney−Wilcoxon test, ****P < 2.2 ⨯ 10−16). Boxes show the interquartile range, horizontal lines show the median EVE score, whiskers show maximum and minimum values that are not outliers, and outliers are shown as points. h, Concordance of SGE functional classification and orthogonal functional assays for VUS in patients with cancer and developmental disorders,. Color indicates SGE classification and shape corresponds to orthogonal assay classification. Control variants (from a case−control study) are shown in green text. SGE variants that were strongly depleted (dark blue) and not tolerated in orthogonal assays (triangles) are completely concordant. P12A, which was partially tolerated in an orthogonal assay, was weakly depleted in SGE. All tolerated variants (white squares) in assays were unchanged in SGE (gray), except for E406V, which was enriched (red). Source data
Fig. 5
Fig. 5. SGE-depleted variants are associated with population-level cancer risk and increased IGF-1 levels.
a, PheWAS forest plot for all-site cancers using SGE-depleted variants and controls; regression model effect is shown by data points and ± effect standard error is shown by bars (Supplementary Table 7). Rare variant burden test masks (and CADD, EVE and REVEL predictors) are shown by color for BAP1 variants in UK Biobank (n carriers shown in key). Significance, according to the corrected P value determined by generalized linear modeling (Supplementary Method 14), is indicated by a triangle (significant) or a circle (not significant). SGE-depleted nonsynonymous variants (yellow) showed a significant effect and are therefore associated with increased cancer risk. SGE-depleted high-confidence (HC) protein-truncating variants (PTVs; orange) demonstrated a significant effect, as did HC PTVs (red). b, UK Biobank SGE-depleted nonsynonymous variant carriers (n = 69) had a significantly higher median blood concentration of IGF-1 compared to noncarriers (n = 398,505); P< 0.005 (P = 0.0033, two-sided Mann−Whitney−Wilcoxon test). Violin plots are colored by BAP1 variant status, boxes show the interquartile range, horizontal lines show the median IGF-1 blood concentration (nmol l−1), whiskers show maximum and minimum values that are not outliers, and outliers are shown as points. c, IGF1 mRNA expression levels in transcripts per million (TPM) obtained from TCGA for 80 uveal melanoma tumors. BAP1-mutant tumors (n = 35) have higher IGF1 expression than those with wild-type BAP1 (n = 45). Colors, outliers and box description are as in b, except the horizontal line is the median IGF1 expression in tumors. P< 0.001 (P = 0.00029, two-sided Mann−Whitney−Wilcoxon test). d, The 80 samples from patients with uveal melanoma were ranked by TCGA IGF1 expression level, with tumors with the top 50% highest expression levels classified as having high expression and the bottom 50% classified as having low expression. Top, Kaplan−Meier estimates, with deceased status (overall survival) shown by vertical tick marks and the model for survival probability based on the overall survival time (in days) shown by lines colored to indicate IGF1 expression level. The P value was calculated using the log-rank test and indicates a significant difference between the overall survival probability for tumors with high and low IGF1 expression from patients in the cohort. Bottom, number at-risk table shows a higher number of patients alive at each time increment for patients whose tumor expressed low versus high levels of IGF-1. Source data
Fig. 6
Fig. 6. Integration of the BAP1 SGE functional score with a clinical example.
a, Pedigree with a proband carrying a c.535C>T variant (HGVSc, ENST00000460680.6:c.535C>T; HGVSp, ENSP00000417132.1:p.Arg179Trp; R179W) in exon 7 of BAP1. The proband was a 33-year-old male presenting with uveal melanoma (UM) at 26 years (arrow) whose father, uncle and grandmother presented with melanoma (ME), basal cell carcinoma (BCC) and renal cell carcinoma (RCC), respectively. The proband’s mother was not known to be a carrier and died of metastatic (M) cancer, possibly cholangiocarcinoma (CCA). The pedigree follows established nomenclature: black, clinically confirmed disease (malignant tumor); square, male; circle, female; diagonal line, deceased; d., age at death; number, age at disease presentation. An asterisk indicates the patient for whom samples are shown in b. b, Pathology of the primary cutaneous melanoma in the patient from a. Top, micrograph showing hematoxylin and eosin (H&E) staining. Bottom, micrograph showing BAP1 immunohistochemical staining; staining is absent in tumor tissue (black arrow) but is present (purple cells) in immune infiltrate (red arrow). Scale bars, 100 μm. Micrographs are representative of three histological sections. c, Functional scores across exon 7. Exonic/intronic ranges within the target region are shown, with points colored by VEP consequence. Transparency based on FDR. Shape denotes functional classification. The variant in a is labeled. d, Multiple-sequence alignment of exon 7 created by global alignment of BAP1 orthologs from eight species (gap open/extension penalty = 12/3); numbers are protein positions of human BAP1 (ENSP00000417132.1) and residues are colored by identity (black, 100%; dark gray, 80−100%; light gray, 60−80%; white, <60%). R179 (and the highly conserved H169 proton donor) is highlighted by a red arrow. Note that the glutamine residue in Drosophila aligns at human position R179, the only missense variant at this position tolerated in SGE. e, Heat map (see Extended Data Fig. 6 for the full heat map) of amino acid substitutions for two key positions, H169 and R179, colored by functional classification. White space results from SNV saturation not producing all amino acid substitutions. c.535C>T produces R179W, which is depleted. R179R, a synonymous change, is unchanged, other missense changes (R179P/L/G/A/*) and R179 codon deletion are depleted and only R179Q is tolerated. H169 in the catalytic core is intolerant to all observed changes, except for a synonymous change. Black circle, key synonymous changes; white triangle, key missense changes. Source data
Extended Data Fig. 1
Extended Data Fig. 1. Clonal HAP1-A5 line and experimental protocol optimization improves editing rate.
a. FACS data comparing the activity of Cas9 in a polyclonal Cas9+ LIG4- HAP1 cell line (top row) with a monoclonal line (HAP1-A5) derived from the same polyclonal line (bottom row) at 72hrs post-transduction. BFP+ GFP+ cells (green) gated in top right quadrant are cells in which Cas9 has failed to inactivate GFP by editing. The Cas9-inactive fraction (green) is significantly reduced, and the Cas9-active fraction (blue) is significantly increased in the clonal line. The negative control contains no sgRNA targeting to GFP coding sequence. Non-fluorescent cells in black. 10,000-20,000 cells were assessed per sample. See Supplementary Fig. 1a for representative gating. b. Nocodazole-based metaphase arrest and DAPI staining was performed on cells edited at exon 5 of BAP1 at D3 post-transfection (PT) and D19 (final passage) PT. Unsorted and untransfected wild-type HAP1 cells were included as a control, as were untransfected clonal line cells. A slight increase in ploidy is seen as a result of transfection and culturing. 1n are un-arrested haploid cells, 2n and 4n are metaphase-arrested haploid and diploid cells, respectively. 10,000-20,000 cells were assessed per line. See Supplementary Fig. 1b for representative gating. c. X-fect (Takara) based transfection of 6 million clonal HAP1-A5 cells using the pMax-GFP (Lonza) 3486bp construct, which is of a similar to size to a typical HDR library, and exon 5 sgRNA-A plasmid. Pre-selection sees a transfection rate of 64% and post-selection with puromycin (+PURO) showing 98% GFP+ cells (green) at Day 3 (D3) post-transfection (PT). GFP- cells in black. 50,000 cells assessed per sample. See Supplementary Fig. 1c for representative gating. d. Sanger sequencing of HAP1-A5 clone at LIG4 locus confirms expected frameshifting, 10 base-pair deletion in CDS, creating a null allele (Horizon Bioscience). Source data
Extended Data Fig. 2
Extended Data Fig. 2. BAP1 is essential in HAP1 cells and amenable to SGE.
a. Experimental scheme and viable cell counts in polyclonal Cas9+ LIG4- HAP1 cells after targeting loci with sgRNAs, based on assumed non-homologous end joining (NHEJ). Cells targeted with BAP1 sgRNAs do not strongly increase in number between day 7 and day 9 post-transfection whereas sgRNAs to a known HAP1 non-essential gene, HPRT1 do. A plasmid not expressing a sgRNA which does not cleave the genome, shows log growth between day 5 and day 7, plateauing between day 7 and day 9 due to confluency. This demonstrates that cutting the genome at a non-essential locus has some genotoxic effects. b. Hart et al., HAP1-derived Bayes factor essentiality data was scaled across all genes included in the Cancer Gene Census (as of 2020). The dashed line marks the scaled value for the threshold Bayes factor (>6) above which there is a ~90% probability of essentiality. BAP1 position relative to other genes is shown. c. Cells edited in a similar manner to that shown in ‘a’ were sampled at day 5 and day 11 and indels counted and ranked by frequency, frameshift and in-frame deletions deplete over time suggesting essentiality of the BAP1 locus. d. A pilot SGE experiment using a minimal library at exon 5 shows screening by SGE at the BAP1 locus works as expected, with stop-gained variants depleting, synonymous variants generally not changing and missense variants showing a spectrum of variant effect. Source data
Extended Data Fig. 3
Extended Data Fig. 3. Positional effect modelling of editing across all SGE regions reveals minimal bias.
a. Counts for Day 4 Library A genomic editing events divided by plasmid library A counts for each variant as an indication of the relative rate of variant incorporation across editing regions. Variants that are edited at codons with PAM/protospacer protection edits (PPEs) are highlighted with a black cross. As expected, variants which revert the PPEs to the wild-type nucleotide sequence cannot prevent re-cutting and show depletion. Points are coloured by VEP mutational consequence. There is no extreme bias in the representation of stop-gained and frameshift variants at Day 4, indicating that compromising variants have yet to deplete by the baseline. A slight increase in incorporation is seen at most PPE positions, this is likely due to enhanced protection from re-editing relative to the rest of the edited regions. The rate of incorporation is slightly reduced at increasing distance from the Cas9 cleavage site (which is in close proximity to PPE labelled codons). Exon 8 A is missing as this guide resulted in profound cell death at the transfection stage. b. Counts for Day 4 Library B genomic editing events divided by plasmid library B counts. An extreme positional effect is observed for region 13-1 B, this data was excluded from analyses. Exon 3 B is missing as this guide resulted in profound cell death at the transfection stage. Source data
Extended Data Fig. 4
Extended Data Fig. 4. Comparison of LFCs between separate libraries or timepoints reveals kinetics of variant change.
a. and b. show the combined LFC calculated using an inverse-weighted mean of Library A and Library B LFCs plotted against either Library A (a.) or Library B (b.) LFC. LFCs are highly concordant as expected, based on Pearson’s correlation coefficient (R) and two-tailed t-test p<2.2e-16. Variants that fall within codons that also contain fixed PAM/protospacer protection edits (PPEs, coloured red for Library A and green for Library B) are more likely to be outliers to the correlation, these codon variants were not weighted in Combined LFC calculations with the variant LFC derived from the library where there is not a PPE. c. LFC between D4 and D7 plotted against functional score (combined LFC) and coloured by functional classification, significant changes (FDR<0.01) for the LFC plotted on the y-axis are shown as non-transparent. d. As ‘c’ but comparing LFC between D4 and D10, a subset of variants marked in transparent shade can be seen which do not deplete significantly by D10, those that are coloured transparent dark blue, do become significantly depleted by D21. Those that are not transparent and dark blue are significantly depleted by D10, suggesting different variant depletion kinetics. e. As in ‘c’ and ‘d’ but comparing LFC between D4 and D14. There is a linear relationship and high correlation between the penultimate timepoint and functional score, suggesting little difference in the kinetics of depletion. f. Functional score compared with LFC D4 D21 shows an extremely high correlation, suggesting very little/no difference between these two related metrics of variant change. Pearson’s correlation coefficient is shown (R) and two-tailed t-test p<2.2e-16 for all plots. Source data
Extended Data Fig. 5
Extended Data Fig. 5. Nucleotide-level map of BAP1 variant effect.
Functional scores for all 18,108 variants assessed, separated by exon region with GRCh38 genomic coordinates of regions targeted shown in the direction of transcription (BAP1 is transcribed from the negative strand). Frameshift, splice donor/acceptor and stop-gained variants deplete throughout the length of the gene, distinct regions of missense intolerance can be seen. Data points are coloured by VEP mutational consequence, functional classifications are distinguished by shape and significance by transparency. Source data
Extended Data Fig. 6
Extended Data Fig. 6. Amino acid-level map of BAP1 variant effect.
Heat map to show functional classification for protein-level changes. This includes missense changes created by SNVs, alanine scan, stop scan and codon deletions. Synonymous substitutions are also shown. Distinct regions of mutational intolerance can be seen. Stop-gained variants that do not significantly deplete can be seen in 7 terminal codons of exon 17. Non-depleting stop-gained variants generated through the ‘stop scan’ function (NNN>TGA) are also seen at K630 in exon 14 and S482 in exon 13, however SNVs leading to stop-gained mutations (NNN>TAG) do deplete at these loci. White space is due to either low-count filtering at the QC stage, because SNV level saturation does not produce all amino acid level substitutions, or because redundant SNVs for the same missense change resulting in discordant functional classifications were removed in this plot (n=158). Source data
Extended Data Fig. 7
Extended Data Fig. 7. Internal and external metric correlations.
a. SpliceAI values are significantly higher for depleted and enriched synonymous/intron variants vs unchanged synonymous/intron variants (two-sided Mann-Whitney-Wilcoxon Test, ****p<0.0001, **p<0.01, depleted/enriched synonymous vs unchanged synonymous p<2.2e-16 and p=0.009, respectively; depleted/enriched intron vs unchanged intron p<2.2e-16 and p=2.9e-05, respectively). Non-splice region missense variants are not significantly different between depleted/enriched missense vs unchanged missense p=0.15 and p=0.11, respectively (two-sided Mann-Whitney-Wilcoxon Test). Box shows interquartile range, horizontal line median maximum spliceAI score, whiskers show maximum and minimum values, outliers as points. b. Average functional score for 4,619 ‘control’ variants (3,993 missense, 188 stop-gained and 438 synonymous) generated using redundant codons (snvre LFC mean) created in VaLiAnT, compared to average functional score for the same variant generated by a SNV, coloured by SNV classification. Pearson’s Correlation Coefficient R and two-sided t-test p value shown. c. SGE classifications used as standards to compare in silico predictors: 8,470 non-splice region missense, 6,334 unchanged and 1,839 depleted variants (297 enriched were excluded). EVE, CADD and PolyPhen-2 reported SGE classifications with 79.5%, 77.9% and 76.7% accuracy, respectively. d-g. Bar charts show variants by classification for 8,470 missense variants. h. Strongly depleted variants show earlier depletion than most weakly depleted variants, observed by LFC D4 D10 FDR. i. Known, BAP1 developmental variants show strong and weak depletion (c.1308A>G and c.2153G>A are unchanged). Functional score (bar) and DESeq2-calculated standard error (+/-error bars) from 3 biological replicates. j. Age of cancer onset for 256 carriers of BAP1 germline variants reported in a clinical analysis of 181 carrier families. Strongly or weakly depleted variant carriers show no difference in age of onset. Carriers of variants in either depleted category have an earlier age of onset compared to unchanged variant carriers (two-sided Dunn’s BH FDR, ****q=5.91e-05, **q=0.0074, ns q=0.17). Box shows interquartile range, horizontal line median age of onset, whiskers show maximum and minimum values, outliers as points. k. Top, germline cancer variants by primary diagnosis site (where tumor site had >5 associated variants), coloured by functional classification. Bottom, MSK-IMPACT somatic variants by cancer type (where cancer type had >5 associated variants). Strongly and weakly depleted classifications are distributed throughout cancer sites/types. Source data
Extended Data Fig. 8
Extended Data Fig. 8. UKBB rare variant burden masks across cancer types and IGF-1 levels are increased in UKBB BAP1 HC PTVs.
a. Rare variant burden test masks shown by colour for BAP1 variants in UKBB across cancer phenotype masks. The significance was calculated according to corrected p-value determined by generalized linear modelling (see Supplementary Method 14), is signified by triangle (significant) or circle (not significant). In order to make comparisons, we also created masks separate from SGE-depletion, including; all BAP1 HC PTVs in UKBB (red), BAP1 missense variants with CADD scores > 25 (light blue) and BAP1 HC PTVs plus missense variants with CADD scores > 25 (grey), missense with EVE score>0.75/>0.7/>0.5 (very high (cyan), high (royal blue), and moderate pathogenicity (black) bins, respectively), and REVEL score>0.7/>0.5 (high (light pink) and moderate (dark pink) pathogenicity thresholds, respectively). Significance and effect differ between cancer types. For all cancers, SGE depleted non-synonymous variants (yellow) show a significant effect and are therefore associated with an increased cancer risk. No in silico tools assessed allow for a significant association with cancer to be achieved, most notably in ‘All cancers combined excluding blood’, where SGE depleted missense (green) are significantly associated with cancer, allowing for direct comparison with missense only prediction. The number of carriers for each rare variant burden test mask in each cancer phenotype mask can be seen in Supplementary Table 7. Error bars define the +/- standard error of the regression model effect. b. UKBB BAP1 HC PTV variant carriers combined with SGE-depleted non-synonymous variant carriers (total n=79 out of 96 carriers, shown in Supplementary Table 7, have IGF-1 values) have a significantly higher median blood concentration of Insulin-like Growth Factor 1 (IGF-1) compared to non-carriers (n=398,495), p=0.004 (two-sided Mann-Whitney-Wilcoxon Test). Violin plot coloured by BAP1 variant status for clarity. Box shows interquartile range, horizontal line the median IGF-1 blood concentration (nmol/L), whiskers show maximum and minimum values that are not outliers, outliers as circles. Source data
Extended Data Fig. 9
Extended Data Fig. 9. SGE resolves pathogenicity of variants in a recurrently mutated BAP1 codon identified through large-scale next generation sequencing of tumors.
Analysis of R146 variants in the Foundation Medicine cohort. We searched the Foundation Medicine database to identify novel BAP1 variants. This analysis revealed multiple variants in the R146 codon of BAP1 including missense and frameshift events. a. Variants are shown against a BAP1 gene structure and are split between different nucleotides within the codon spanning exons 6 and 7. b. All missense variants found at position R146 in the Foundation Medicine database are significantly depleted in SGE as seen by heatmap, the white triangle highlights R146K, of interest in ‘d’. Two codons were measured redundantly at the nucleotide level, and have different classifications (triplet codes in blue/grey), this includes synonymous changes, indicating disruption to splicing over the split-codon. c. All altered residues at 146 fall into a side chain proximal to the catalytic core (R146 residue highlighted in pink). d. A BAP1 R146K (c.437G>A) variant, observed in the Foundation Medicine database is a confirmed germline variant. A patient presenting with cholangiocarcinoma at 64 and their sister (a renal cell carcinoma (RCC) patient at 62) were found to carry the variant (red circles). Other first and second-degree relatives were reported to present with RCC, mesothelioma, melanoma, liver cancer, colon cancer, and a cancer of unknown primary e. Summary of patient demographics and variant details for Foundation Medicine BAP1 accessions. Source data

References

    1. Landrum MJ, et al. ClinVar: improving access to variant interpretations and supporting evidence. Nucleic Acids Res. 2018;46:D1062–D1067. - PMC - PubMed
    1. Star P, et al. Germline BAP1-positive patients: the dilemmas of cancer surveillance and a proposed interdisciplinary consensus monitoring strategy. Eur. J. Cancer. 2018;92:48–53. - PubMed
    1. Chau C, et al. Families with BAP1-tumor predisposition syndrome in the Netherlands: path to identification and a proposal for genetic screening guidelines. Cancers. 2019;11:1114. - PMC - PubMed
    1. Lalloo F, et al. Clinical practice guidelines for the diagnosis and surveillance of BAP1 tumour predisposition syndrome. Eur. J. Hum. Genet. 2023;31:1261–1269. - PMC - PubMed
    1. Fennell DA, et al. Rucaparib in patients with BAP1-deficient or BRCA1-deficient mesothelioma (MiST1): an open-label, single-arm, phase 2a clinical trial. Lancet Respir. Med. 2021;9:593–600. - PubMed

LinkOut - more resources