. 2024 Jul;56(7):1446-1455.
doi: 10.1038/s41588-024-01800-z. Epub 2024 Jul 5.

Saturation genome editing maps the functional spectrum of pathogenic VHL alleles

Affiliations

Saturation genome editing maps the functional spectrum of pathogenic VHL alleles

Megan Buckley et al. Nat Genet. 2024 Jul.

Abstract

To maximize the impact of precision medicine approaches, it is critical to identify genetic variants underlying disease and to accurately quantify their functional effects. A gene exemplifying the challenge of variant interpretation is the von Hippel-Lindautumor suppressor (VHL). VHL encodes an E3 ubiquitin ligase that regulates the cellular response to hypoxia. Germline pathogenic variants in VHL predispose patients to tumors including clear cell renal cell carcinoma (ccRCC) and pheochromocytoma, and somatic VHL mutations are frequently observed in sporadic renal cancer. Here we optimize and apply saturation genome editing to assay nearly all possible single-nucleotide variants (SNVs) across VHL's coding sequence. To delineate mechanisms, we quantify mRNA dosage effects and compare functional effects in isogenic cell lines. Function scores for 2,268 VHL SNVs identify a core set of pathogenic alleles driving ccRCC with perfect accuracy, inform differential risk across tumor types and reveal new mechanisms by which variants impact function. These results have immediate utility for classifying VHL variants encountered clinically and illustrate how precise functional measurements can resolve pleiotropic and dosage-dependent genotype-phenotype relationships across complete genes.


Conflict of interest statement

The authors declare no competing interests.

Figures

Fig. 1
Fig. 1. A highly optimized SGE protocol to assay VHL variants.
a, CRISPR knockout screening data from the Cancer Dependency Map (DepMap) reveal VHL loss widely leads to reduced growth in cell lines lacking VHL mutations (n = 29 kidney-derived and n = 1,048 other lines; boxplot: center line, median; box limits, upper and lower quartiles; whiskers, 1.5× interquartile range; all points shown). b, CRISPR-induced editing of VHL was performed in HAP1 cells (day 0), and outcomes were quantified by NGS. Distributions of InDel scores, calculated as the log2 ratio of day 13 frequency to day 6 frequency, show frameshifting, and in-frame InDels are strongly depleted in parental HAP1 (left) compared to HAP1–HIF1A–knockout (–KO) (right) (median InDel score −3.20 versus −0.20, respectively; Wilcoxon rank-sum two-sided P = 5.6 × 10−18). c, The strategy to perform SGE across the complete coding sequence of VHL is shown, with ClinVar variant counts for all ‘pathogenic’ and ’likely pathogenic’ variants (red) and VUS (orange) displayed from gnomAD. SGE regions were designed to tile exons 1–3, as well as a region of intron 1. A total of 480 SNVs in ClinVar are in SGE regions, of which 269 are VUS. (Introns not to scale.) d, For each SGE region, a library of oligos containing all possible SNVs was synthesized and cloned into a vector with homology arms to facilitate genomic integration via CRISPR-induced HDR. Variants present in cells were quantified over time via amplicon sequencing, and function scores were calculated to reflect variants’ effects on fitness. e,f, Function scores for synonymous, nonsense and canonical splice site SNVs are shown for a single SGE region (exon 2) assayed in normal media (e) or media supplemented with 2.5 µM DAB (f).
Fig. 2
Fig. 2. A complete map of SNV effects across VHL.
a, Function scores across transfection replicates are plotted for n = 2,200 SNVs (Pearson’s R = 0.90). b, Replicate scores were averaged and normalized to obtain a final function score for each variant. The inset shows only synonymous, nonsense and canonical splice site SNVs. c, Function scores are plotted by coding sequence (CDS) position for each coding and intronic region assayed, with β-sheets and ɑ-helices of VHL’s secondary structure shown above. Scores of select well-studied VHL disease variants are indicated by amino acid substitution, with SGE data for additional variants of known phenotype in Supplementary Table 2.
Fig. 3
Fig. 3. Function scores capture fitness effects secondary to splicing alterations and impairment of protein function.
a, Targeted RNA-sequencing of VHL mRNA from edited cells was performed to calculate RNA scores for n = 1,626 exonic SNVs. The relationship between RNA scores and function scores reveals most LoF variants are expressed at normal levels in mRNA, and only low RNA scores reliably predict LoF at the cellular level (Extended Data Fig. 4c). Two synonymous variants shown independently to disrupt splicing are indicated,, as well as c.462A>C, the splice region variant with the lowest RNA score. b,c, The maximum SpliceAI score for each SNV is plotted against RNA scores for exonic SNVs (Pearson’s R = −0.70; b) and function scores for intronic SNVs (R = −0.90; c). d, The proportion of missense variants scoring as depleted by SGE (q < 0.01) is displayed for each residue exposure label. e, FoldX ΔΔG predictions were higher for n = 242 depleted missense SNVs (median = 3.63) than for n = 697 nondepleted SNVs (median 0.70) (boxplot: center line, median; box limits, upper and lower quartiles; whiskers, 1.5× interquartile range). fh, The average score of missense variants at each amino acid position is shown in color on the VHL structure (PDB: 1LM8). Residues highly intolerant to missense variation include S111, H115, W117 and W88 at the HIF1A recognition site (g), as well as L158 and C162 at the ELOC interface (h).
Fig. 4
Fig. 4. Highly accurate identification of pathogenic VHL alleles in humans using SGE.
a,b, The distribution of function scores for VHL SNVs reported in ClinVar (a) and observed in cBioPortal, cancer samples (b) is shown. c,d, For SNVs observed in tumors, lower function scores correlate with more independent observations in cBioPortal (c; n = 233 SNVs, Spearman’s  = −0.25, two-sided P = 9.7 × 10−5;  = −0.58, P = 2.7 × 10−22 when analysis restricted to n = 172 SNVs seen in ccRCC) and higher allele frequencies within samples (d; n = 334 samples,  = −0.22, two-sided P = 3.7 × 10−5). e, A combined population allele count for each SNV assayed was determined by summing independent observations from gnomAD, UKB and TOPMed. Of n = 233 variants observed more than once in population sequencing, 96.6% were not significantly depleted. f,g, Gold-standard sets of variants were defined using orthologous data from ClinVar, cBioPortal and population sequencing. In f, all variants with at least two cBioPortal ccRCC observations or one ccRCC observation and a ClinVar ‘pathogenic’ or ‘likely pathogenic’ annotation (n = 120 ccRCC-associated SNVs) are plotted with variants deemed ‘benign’ or ‘likely benign’ in ClinVar and seen at least once in population sequencing (n = 108 neutral SNVs). g, Due to the lack of missense variants classified as ‘benign’ or ‘likely benign’ in ClinVar, we defined a neutral set to include those present in at least two population controls and not deemed ‘pathogenic’ or ‘likely pathogenic’ in ClinVar (n = 99 neutral missense SNVs versus n = 73 ccRCC missense SNVs). h, Function scores are plotted against cBioPortal ccRCC observations for SNVs reported in ClinVar to be ‘benign’ or ‘likely benign’ (LB), ‘pathogenic’ or ‘likely pathogenic’ (LP) or VUS (here including SNVs with conflicting interpretations), and for SNVs absent from ClinVar. SNVs are colored by cancer type (as in b). Lines correspond to thresholds for distinguishing LOF1 (less than −1.26), LOF2 (less than −0.39) and neutral (greater than −0.23) classes.
Fig. 5
Fig. 5. A gradient of functional effects underlies phenotypic differences of VHL variants.
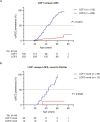
a, SNVs (n = 797) in exons 2 and 3 were assayed in HAP1–HIF1A–KO cells. Compared to previous data (top), variants were well-tolerated, independent of consequence. b, Function scores across isogenic lines showed no significant correlation (Spearman’s ρ = −0.06, P = 0.08). c, ‘Pathogenic’ and ‘likely pathogenic’ SNVs from ClinVar were grouped based on annotations in VHLdb. SNVs associated only with type 1 VHL disease or ccRCC were deemed ‘type 1’ (n = 74 SNVs), whereas SNVs associated only with type 2 disease or predominantly pheochromocytoma were deemed ‘pheo-predominant’ (n = 29 SNVs, excluding SNVs associated with type 2B disease). The remaining pathogenic SNVs lacked unambiguous phenotypic data in VHLdb (n = 64 SNVs, ‘type unclear’). The boxplot shows function scores for SNVs in these categories, as well as for n = 2,033 other SNVs assayed, including variants either not deemed pathogenic in ClinVar or absent (one-way ANOVA, adjusted P = 0.00043 between ‘pheo-predominant’ and ‘type unclear’; ****P < 1.0 × 10−10 for all other comparisons; boxplot: center line, median; box limits, upper and lower quartiles; whiskers, 1.5× interquartile range; all points shown). d, Patients in the Freiburg VHL Registry with missense variants assayed by SGE (n = 321) were grouped based on the function class of their germline variant. Due to the high prevalence of p.Y98H in this cohort, an additional LOF2 group excluding p.Y98H was analyzed, as well. A Kaplan–Meier estimator was used to assess age-related ccRCC penetrance (log-rank test for significance).
Fig. 6
Fig. 6. Insights into mechanisms underlying genotype–phenotype associations.
a, Frameshifting InDels present in cBioPortal ccRCC samples are grouped by reading frame and plotted above SGE function scores in the 3′-most region of exon 3. From p.R200, all frameshifting InDels seen in ccRCC result in the same reading frame, which extends the protein by 41 amino acids. b, The crystal structure of VHL in complex is shown next to an AlphaFold prediction of the full-length VHL protein plus the 41-amino acid C-terminal extension common to InDels observed in ccRCC. c, InDel scores for CRISPR-induced edits located between p.R200 and p.*214 are plotted, with InDels grouped by reading frame. n = 10 InDels resulting in a +1 bp frameshift scored significantly lower than n = 9 in-frame InDels and n = 7 −1 bp frameshifting InDels (one-way ANOVA: P = 1.0 × 10−7 and P = 2.6 × 10−6, respectively; boxplot center line, median; box limits, upper and lower quartiles; whiskers, 1.5× interquartile range). d, Clonal HAP1 lines harboring variants leading to the 41-amino acid C-terminal extension (c.606dup and c.620_624del) were stained for endogenous expression of VHL and HIF1A and imaged using confocal microscopy. (Data are representative of two independent stains; scale bar, 10 µm; ROI, region of interest.) e, A western blot was performed to assess VHL and HIF1A protein expression in clonally isolated HAP1 lines harboring specific variants. (Results are representative of two independent blots.) f, A dual-fluorophore SCR reporter was used to quantify the readthrough of nonsense variants as the proportion of mCherry+ cells by flow cytometry. Points show each of n = 2 replicate transfections. Source data
Extended Data Fig. 1
Extended Data Fig. 1. Optimizing SGE libraries to tile the complete VHL coding sequence.
a, A schematic showing the seven SGE regions tiling across VHL. b,c, Frequency of SNVs plotted by position in the initial libraries for exon 1–5′ (b) and exon 1–3′ (c). d,e, Histograms of variant frequency for the initial libraries for exon 1–5′ (d) and exon 1–3′ (e). Based on these distributions, additional synonymous SNVs were added to final library designs. fl, Frequency of SNVs in the final SGE libraries used for each region.
Extended Data Fig. 2
Extended Data Fig. 2. Addition of DAB to SGE experiments improves data quality.
Histograms of function scores for regions where SGE was performed in normal HAP1 growth media (top) and media supplemented with 2.5 µM DAB (bottom). Function scores span a greater range when derived using DAB.
Extended Data Fig. 3
Extended Data Fig. 3. An absence of LoF variants in the 5′ coding region of exon 1.
a, The rate of editing by HDR as measured by NGS is plotted for each replicate SGE experiment, sampled on day 6 post-transfection. b, Function scores for variants in exon 1 are plotted by genomic position and colored by q value. Positions of the three different SGE regions tiling exon 1 are indicated on the x axis. c, Histograms of function scores colored by mutation consequence are shown for each SGE region. Nonsense variants consistently score lowly across SGE regions, with the exception of the exon 1–5′ region.
Extended Data Fig. 4
Extended Data Fig. 4. A map of RNA scores for n = 1,626 SNVs in VHL.
a, RNA scores, defined as each SNV’s abundance in cDNA normalized to its abundance in gDNA, are plotted by transcript position. RNA scores shown are from samples collected 6 days post-transfection. b, Day 6 RNA scores from individual replicates are highly correlated (Pearson’s R = 0.87). c, Comparison of function scores and RNA scores indicates that below an RNA score threshold of −3.0 (dashed line), 6 of 7 synonymous variants were significantly depleted.
Extended Data Fig. 5
Extended Data Fig. 5. Comparing RNA scores across timepoints.
ac, Scores for n = 356 SNVs analyzed in exon 2 are plotted by transcript position. RNA scores are plotted for samples collected 6 days post-transfection (a) and 20 days post-transfection (b). Function scores are plotted for the same set of exon 2 variants (c). d, RNA scores correlate across timepoints (Pearson’s R = 0.86). Many variants with low RNA scores on day 6 have relatively higher RNA scores on day 20. (y = x plotted as a dashed line for reference.) e, The ΔRNA score for each SNV, defined as the day 20 RNA score minus the day 6 RNA score, is plotted for n = 184 LOF1, n = 81 LOF2, n = 118 intermediate and n = 1,226 neutral SNVs. Variants with day 6 RNA scores below the threshold of −3.0 are plotted separately for n = 10 LOF1, n = 5 LOF2 and n = 2 intermediate SNVs. (Boxplots: center line, median; box limits, upper and lower quartiles; whiskers, 1.5× interquartile range; all points shown.) f, SpliceAI component scores predict specific splice alterations, including acceptor loss, acceptor gain, donor loss and donor gain. Component SpliceAI scores are plotted against RNA scores for exonic SNVs.
Extended Data Fig. 6
Extended Data Fig. 6. Expression of HIF1A and VHL in clonal HAP1 lines with variants assayed in SGE.
a,b, Clonal HAP1 cell lines were isolated containing SNVs introduced independently via prime editing. Western blots were performed to assess VHL and HIF1A protein levels, with α-tubulin stained as a loading control. SNVs scored as significantly depleted in SGE (all except c.228C>G, c.222C>A and c.191G>C) showed increased levels of HIF1A expression compared to unedited HAP1 and cells expressing p.F76L, a variant scored neutrally by SGE. Of note, c.222C>A and c.462A>C had RNA scores of −4.45 and −5.82, respectively. Clonal variability may account for subtle differences between results from the SGE assay and the degree of HIF1A upregulation observed by western blot. (Results are representative of 2 independent blots per line.) Source data
Extended Data Fig. 7
Extended Data Fig. 7. Function scores accurately predict pathogenicity of germline and somatic variants.
a, The distribution of function scores for missense and splice region SNVs reported in ClinVar is shown (n = 482 SNVs, including 129 ‘pathogenic’ and ‘likely pathogenic’ SNVs and 15 ‘likely benign’ SNVs). b, Missense and splice region SNVs observed in cBioPortal are plotted by function score (inset shows variants present in at least one sample). c,d, Receiver operating characteristic (ROC) curves are shown for the classification of ClinVar variants using SGE function scores. ‘Pathogenic’ SNVs (c) or ‘pathogenic’ and ‘likely pathogenic’ SNVs (d) were distinguished from n = 190 ‘benign’ or ‘likely benign’ SNVs. e,f, The same analyses were repeated as in (c) and (d), restricting to only missense and splice region SNVs. g, Function classes, defined from SGE data, are illustrated to show performance at separating ClinVar variants by mutation consequence. Thresholds for distinguishing LOF1 (less than −1.26), LOF2 (less than −0.39) and neutral (greater than −0.23) classes are indicated. (Intermediately scored variants are not plotted.) h, The number of ccRCC entries in cBioPortal is plotted by function class for n = 225 LOF1, n = 102 LOF2, n = 173 intermediate and n = 1,700 neutral SNVs. (Boxplot: center line, median; box limits, upper and lower quartiles; whiskers, 1.5× interquartile range; all points shown.) i, For each unique SNV in cBioPortal (n = 233 SNVs), function score is plotted versus the number of ccRCC samples in which the SNV was observed. Variants are split by OncoKB annotation and mutational hotspot status in cBioPortal, with thresholds for defining LOF1, LOF2 and neutral variants indicated.
Extended Data Fig. 8
Extended Data Fig. 8. Function scores for missense variants outperform predictions from computational models.
a,b, ROC curves indicate the performance of different metrics at distinguishing disease-associated missense variants in VHL. The metrics evaluated were SGE function scores, REVEL scores, boostDM scores from the VHL-ccRCC model, EVE scores, VARITY R scores and CADD scores. Missense SNVs were included if scored by all metrics (that is, those present in SGE data from p.M54 to p.A207). In a, n = 65 missense variants deemed ‘pathogenic’ in ClinVar were distinguished from n = 87 missense SNVs deemed neutral (as in Fig. 4g). In b, missense variants present in the gold-standard set of ccRCC-associated SNVs (n = 73) were classified against the same neutral set of variants as in (a). c, Function scores for n = 953 missense SNVs are plotted versus scores from each computational predictor, colored by ClinVar status. d, Function scores were used to define two sets of unseen variants (that is, those absent from ClinVar, cBioPortal, population sequencing and VHLdb). Each metric was assessed on its ability to distinguish unseen missense SNVs with function scores below −0.479 (n = 19) from the set of missense SNVs with function scores closest to 0 (n = 100). e, Missense variants classified by SGE as LOF1/LOF2 or neutral were grouped by whether they were discordantly classified by 0, 1 to 2 or all 3 top variant effect predictors (VARITY, EVE and REVEL). Function scores, EVE scores, vertebrate phyloP scores and FoldX predictions are shown across groups (boxplot: center line, median; box limits, upper and lower quartiles; whiskers, 1.5× interquartile range; all points shown except n = 22 SNVs with FoldX scores greater than 12.0 in the right panel).
Extended Data Fig. 9
Extended Data Fig. 9. Stratification of patients with VHL disease by SGE function class.
a, Patients in the Freiburg VHL Registry were grouped according to whether their germline VHL variant was functionally classified as LOF1 or LOF2 by SGE, and a Kaplan–Meier estimator was used to assess differences in age-related ccRCC penetrance with log-rank test for significance (additional details in Methods). b, The same analysis and log-rank test were repeated including only patients with variants not reported to be pathogenic in ClinVar at time of analysis (that is, absent, VUS or conflicting interpretations).
Extended Data Fig. 10
Extended Data Fig. 10. Functional effects of nonsense variants in relation to position and stop codon context.
a, Function scores are plotted by position in exon 1 of VHL and colored to highlight nonsense variants. All nonsense SNVs tested between c.160A and c.601C scored as depleted, except for c.264G>A, a variant associated with type 2 VHL disease. b,c, Function scores for n = 40 nonsense variants between c.160 and c.601 are plotted by termination codon (b) and 4-bp termination codon context (c). Differences between function scores by termination codon were tested using a one-way ANOVA. (Boxplot: center line, median; box limits, upper and lower quartiles; whiskers, 1.5× interquartile range; all points shown.) In c, the blue line indicates the mean score for each stop codon context and the size of each dot corresponds to the number of cBioPortal ccRCC samples in which the SNV has been observed. d, A dual-fluorophore stop-codon readthrough (SCR) reporter assay was used to quantify readthrough of nonsense variants assayed by SGE. Nonsense variants with 138 bp of surrounding VHL sequence were cloned between EGFP and mCherry, such that mCherry expression only occurs if the nonsense codon fails to terminate translation. e,f, Flow cytometry data for live populations of single cells are shown for each plasmid tested, with gating to determine the fraction of transfected cells (EGFP+) positive for mCherry expression. Data were normalized to a control vector without a stop codon (pSCR-VHL-no-stop). Control plasmids are in (e), and plasmids containing VHL nonsense codons are in (f).

References

    1. Cerami E, et al. The cBio cancer genomics portal: an open platform for exploring multidimensional cancer genomics data. Cancer Discov. 2012;2:401–404. - PMC - PubMed
    1. Gao J, et al. Integrative analysis of complex cancer genomics and clinical profiles using the cBioPortal. Sci. Signal. 2013;6:pl1. - PMC - PubMed
    1. Landrum MJ, et al. ClinVar: public archive of interpretations of clinically relevant variants. Nucleic Acids Res. 2016;44:D862–D868. - PMC - PubMed
    1. Kuang D, et al. Prioritizing genes for systematic variant effect mapping. Bioinformatics. 2021;36:5448–5455. - PMC - PubMed
    1. Ioannidis NM, et al. REVEL: an ensemble method for predicting the pathogenicity of rare missense variants. Am. J. Hum. Genet. 2016;99:877–885. - PMC - PubMed

Substances

LinkOut - more resources