

An In Silico Modelling Approach to Predict Hemodynamic Outcomes in Diabetic and Hypertensive Kidney Disease
- PMID: 38969955
- PMCID: PMC11511740
- DOI: 10.1007/s10439-024-03573-2
An In Silico Modelling Approach to Predict Hemodynamic Outcomes in Diabetic and Hypertensive Kidney Disease
Abstract
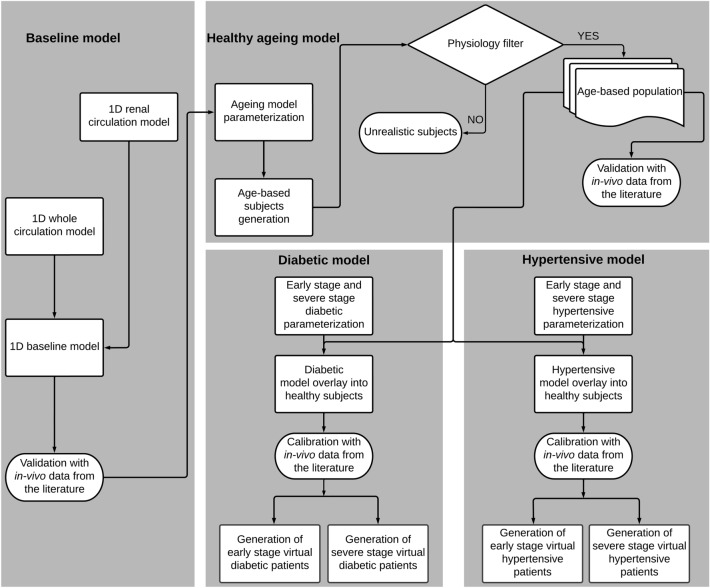
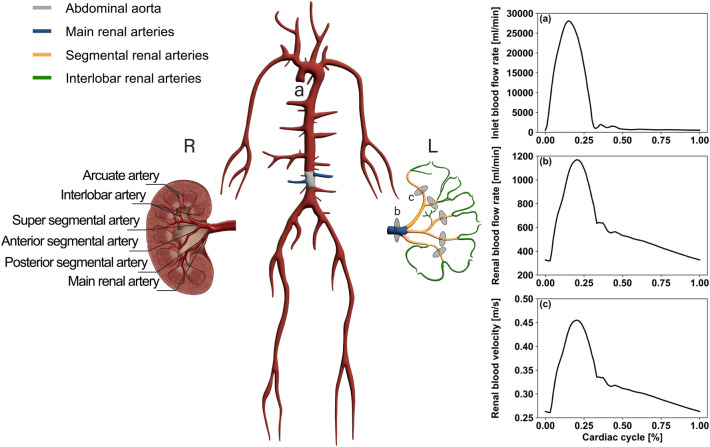
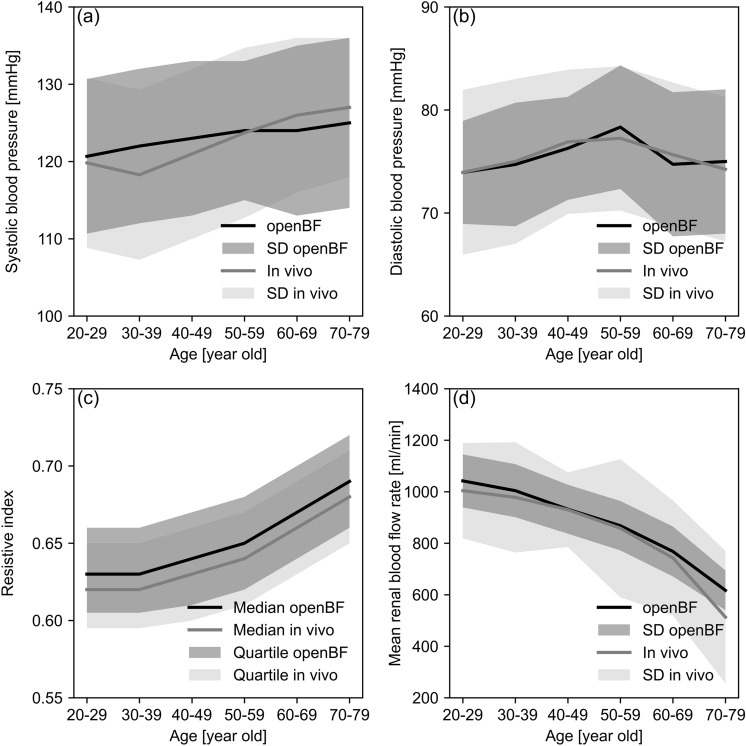
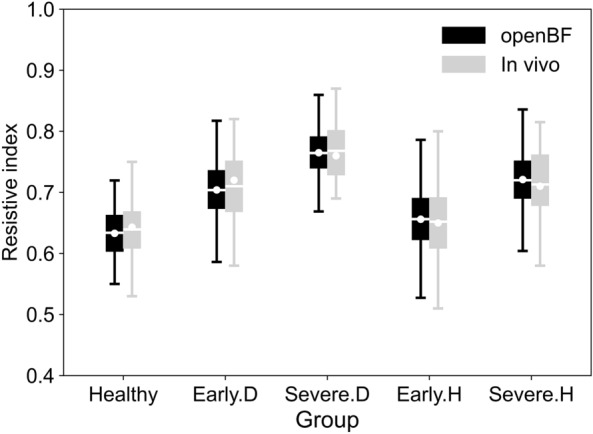
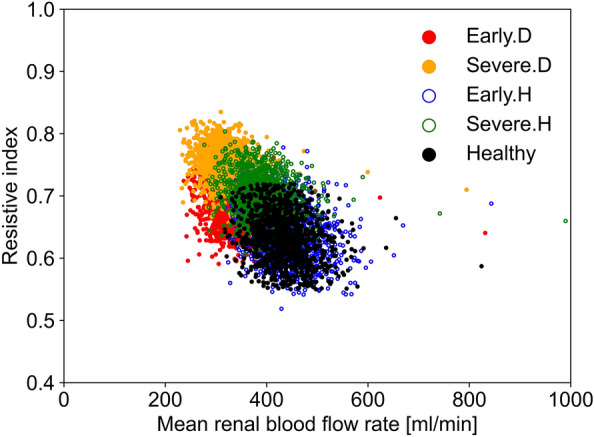
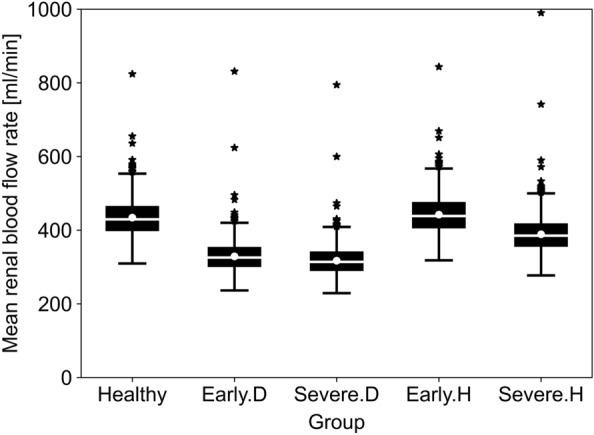
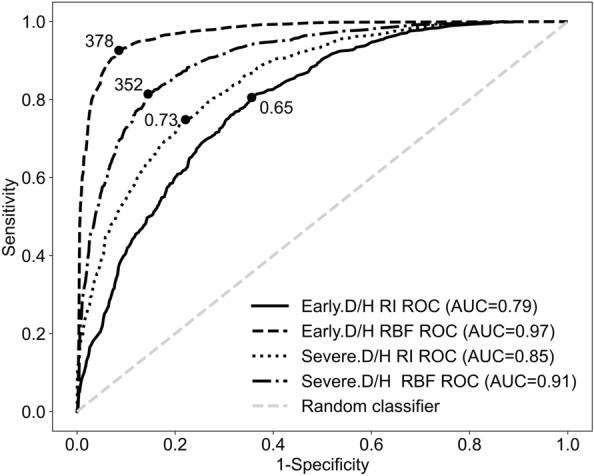
Early diagnosis of kidney disease remains an unmet clinical challenge, preventing timely and effective intervention. Diabetes and hypertension are two main causes of kidney disease, can often appear together, and can only be distinguished by invasive biopsy. In this study, we developed a modelling approach to simulate blood velocity, volumetric flow rate, and pressure wave propagation in arterial networks of ageing, diabetic, and hypertensive virtual populations. The model was validated by comparing our predictions for pressure, volumetric flow rate and waveform-derived indexes with in vivo data on ageing populations from the literature. The model simulated the effects of kidney disease, and was calibrated to align quantitatively with in vivo data on diabetic and hypertensive nephropathy from the literature. Our study identified some potential biomarkers extracted from renal blood flow rate and flow pulsatility. For typical patient age groups, resistive index values were 0.69 (SD 0.05) and 0.74 (SD 0.02) in the early and severe stages of diabetic nephropathy, respectively. Similar trends were observed in the same stages of hypertensive nephropathy, with a range from 0.65 (SD 0.07) to 0.73 (SD 0.05), respectively. Mean renal blood flow rate through a single diseased kidney ranged from 329 (SD 40, early) to 317 (SD 38, severe) ml/min in diabetic nephropathy and 443 (SD 54, early) to 388 (SD 47, severe) ml/min in hypertensive nephropathy, showing potential as a biomarker for early diagnosis of kidney disease. This modelling approach demonstrated its potential application in informing biomarker identification and facilitating the setup of clinical trials.
Keywords: 1D modelling; Biomarkers; Chronic kidney disease; Diabetes mellitus; Hypertension; Renal circulation modelling.
© 2024. The Author(s).
Conflict of interest statement
The authors have no conflict of interest to declare.
Figures
Similar articles
-
Blood pressure control in chronic kidney disease according to underlying renal disease: the Fukushima CKD cohort.Clin Exp Nephrol. 2020 May;24(5):427-434. doi: 10.1007/s10157-019-01838-y. Epub 2019 Dec 26. Clin Exp Nephrol. 2020. PMID: 31875937
-
Renal protection in diabetes--an emerging role for calcium antagonists.Cardiology. 1997;88 Suppl 3:56-62. doi: 10.1159/000177509. Cardiology. 1997. PMID: 9397296 Review.
-
Association of Higher Advanced Oxidation Protein Products (AOPPs) Levels in Patients with Diabetic and Hypertensive Nephropathy.Medicina (Kaunas). 2019 Oct 7;55(10):675. doi: 10.3390/medicina55100675. Medicina (Kaunas). 2019. PMID: 31591338 Free PMC article.
-
Arterial spin labeling MRI is able to detect early hemodynamic changes in diabetic nephropathy.J Magn Reson Imaging. 2017 Dec;46(6):1810-1817. doi: 10.1002/jmri.25717. Epub 2017 Apr 6. J Magn Reson Imaging. 2017. PMID: 28383796
-
Renal protection in diabetes: an emerging role for calcium antagonists.J Hypertens Suppl. 1996 Nov;14(4):S21-5. doi: 10.1097/00004872-199606234-00005. J Hypertens Suppl. 1996. PMID: 8986939 Review.
Cited by
-
Cardiac digital twins: a tool to investigate the function and treatment of the diabetic heart.Cardiovasc Diabetol. 2025 Jul 18;24(1):293. doi: 10.1186/s12933-025-02839-w. Cardiovasc Diabetol. 2025. PMID: 40682127 Free PMC article. Review.
References
MeSH terms
Supplementary concepts
Grants and funding
LinkOut - more resources
Full Text Sources
Medical
