

Genome-wide analysis of MYB transcription factor family and AsMYB1R subfamily contribution to ROS homeostasis regulation in Avena sativa under PEG-induced drought stress
- PMID: 38970019
- PMCID: PMC11227197
- DOI: 10.1186/s12870-024-05251-w
Genome-wide analysis of MYB transcription factor family and AsMYB1R subfamily contribution to ROS homeostasis regulation in Avena sativa under PEG-induced drought stress
Abstract
Background: The myeloblastosis (MYB) transcription factor (TF) family is one of the largest and most important TF families in plants, playing an important role in a life cycle and abiotic stress.
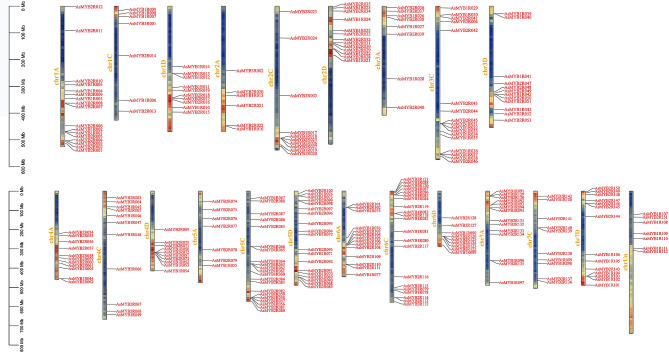
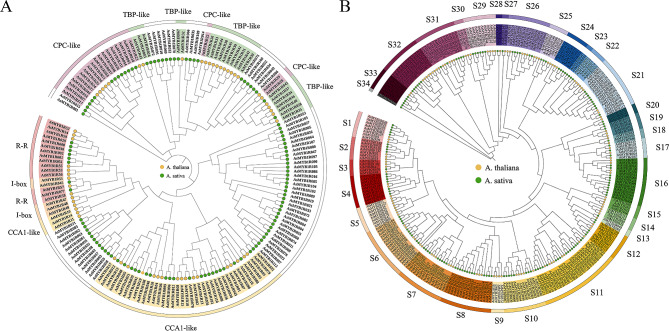
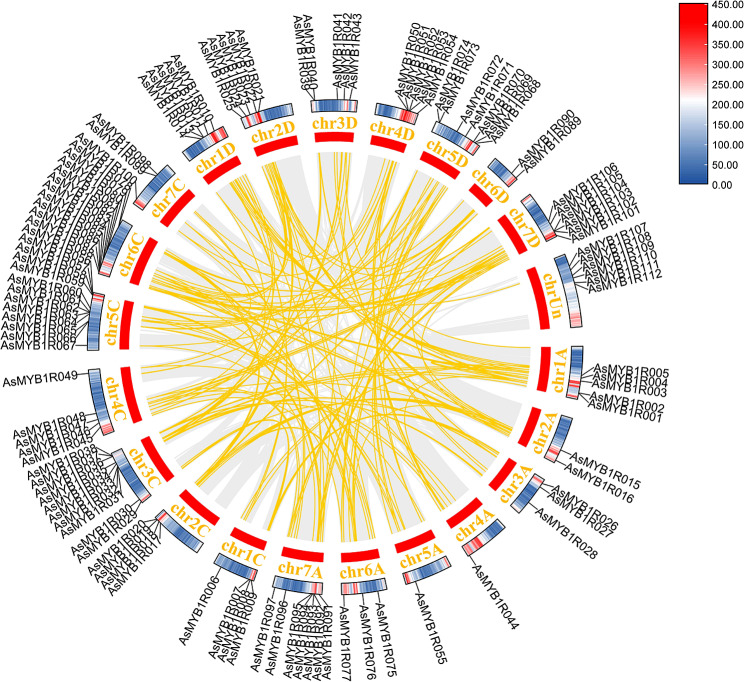
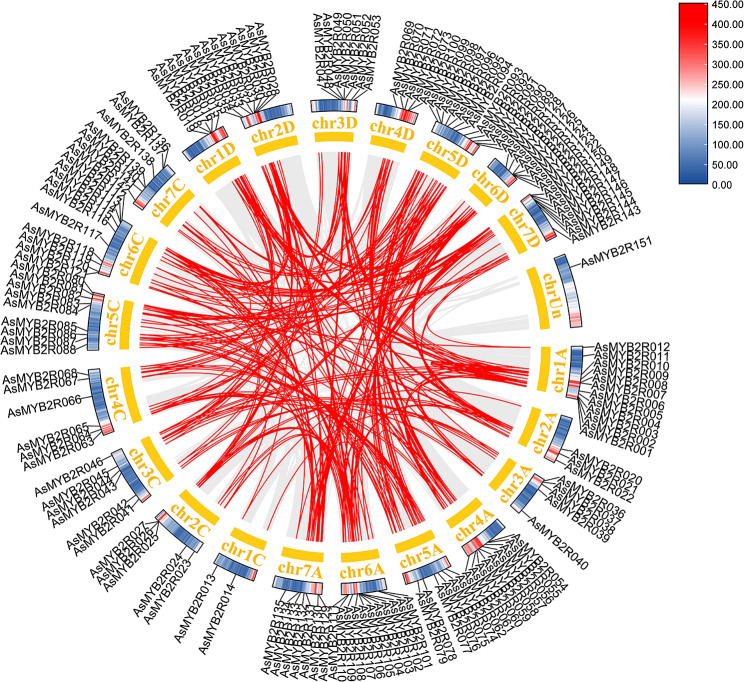
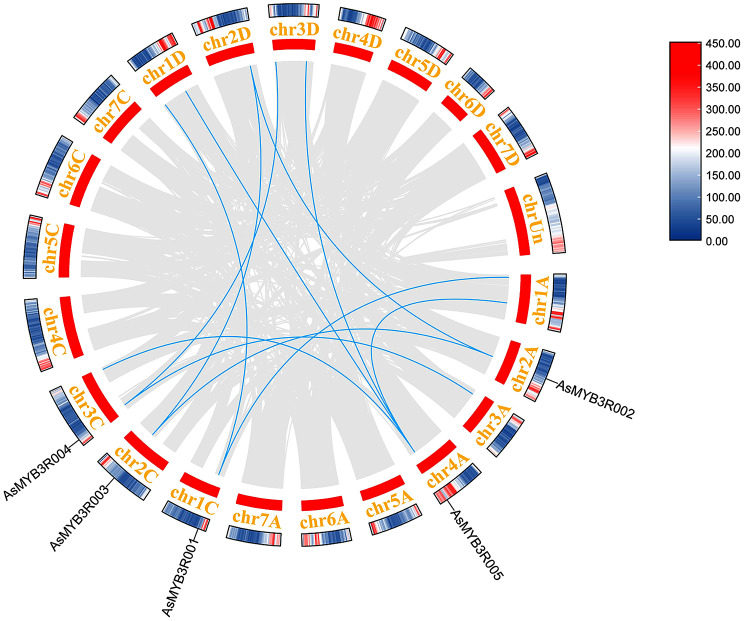
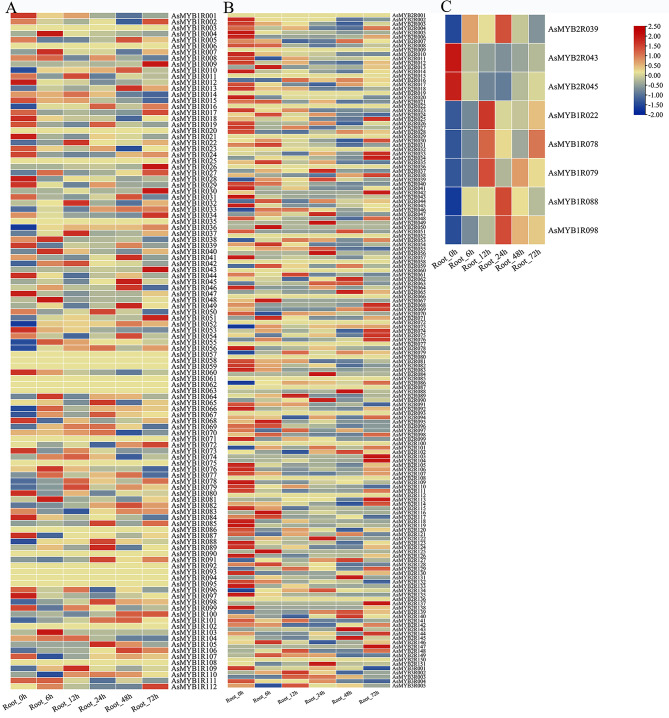
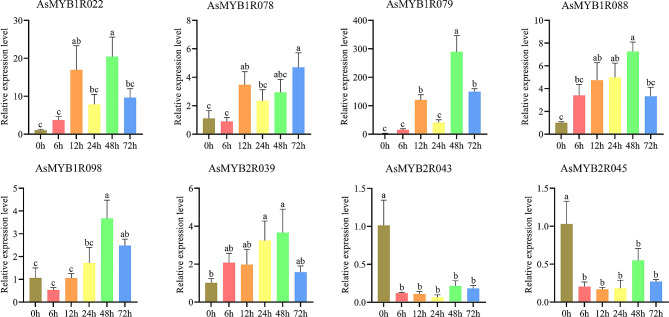
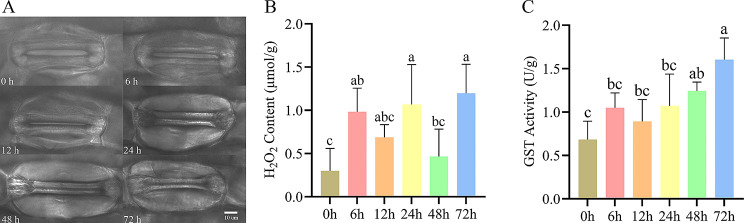
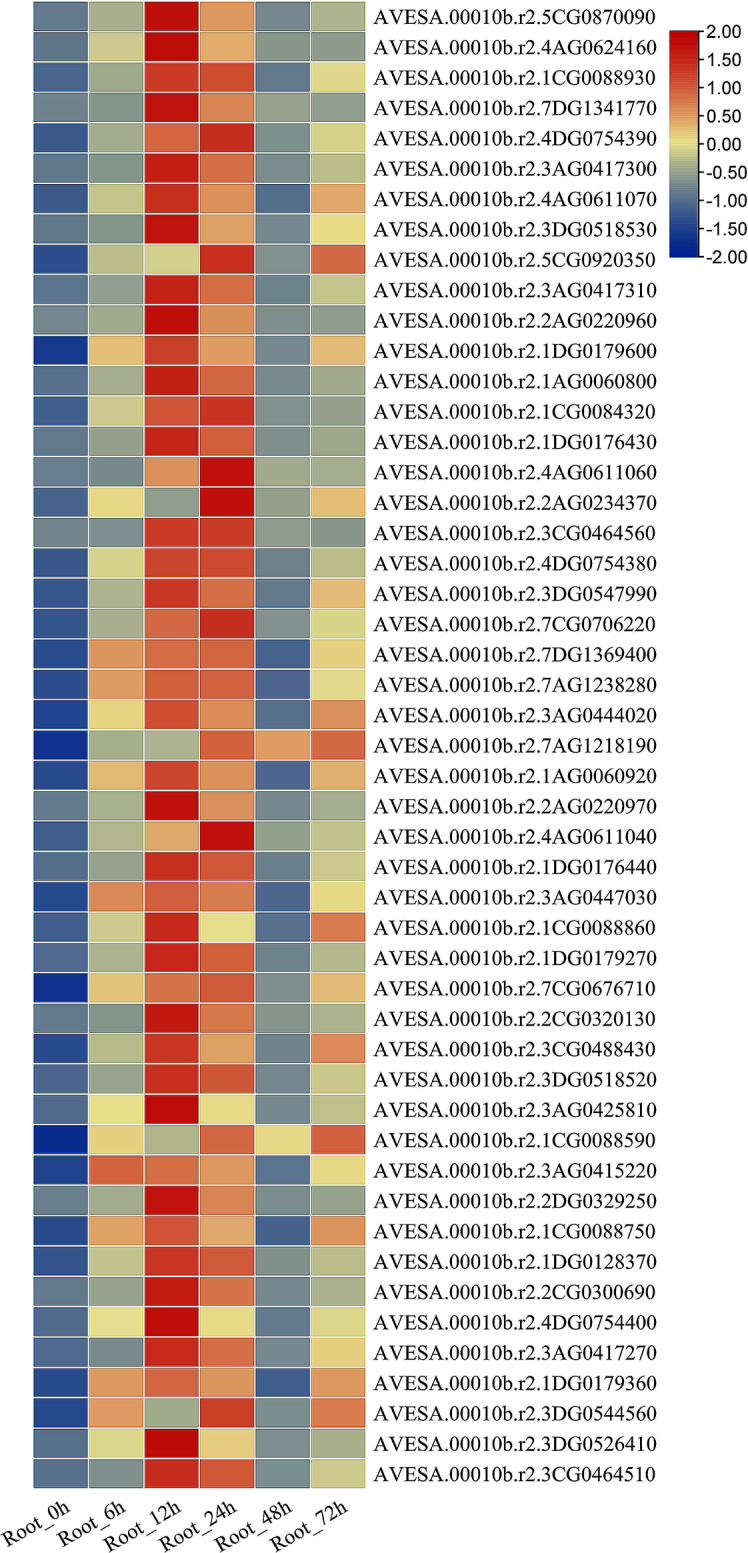
Results: In this study, 268 Avena sativa MYB (AsMYB) TFs from Avena sativa were identified and named according to their order of location on the chromosomes, respectively. Phylogenetic analysis of the AsMYB and Arabidopsis MYB proteins were performed to determine their homology, the AsMYB1R proteins were classified into 5 subgroups, and the AsMYB2R proteins were classified into 34 subgroups. The conserved domains and gene structure were highly conserved among the subgroups. Eight differentially expressed AsMYB genes were screened in the transcriptome of transcriptional data and validated through RT-qPCR. Three genes in AsMYB2R subgroup, which are related to the shortened growth period, stomatal closure, and nutrient and water transport by PEG-induced drought stress, were investigated in more details. The AsMYB1R subgroup genes LHY and REV 1, together with GST, regulate ROS homeostasis to ensure ROS signal transduction and scavenge excess ROS to avoid oxidative damage.
Conclusion: The results of this study confirmed that the AsMYB TFs family is involved in the homeostatic regulation of ROS under drought stress. This lays the foundation for further investigating the involvement of the AsMYB TFs family in regulating A. sativa drought response mechanisms.
Keywords: Avena sativa; Drought stress; MYB transcription factors; ROS.
© 2024. The Author(s).
Conflict of interest statement
The authors declare no competing interests.
Figures


Similar articles
-
Glutathione S-transferase in mediating adaptive responses of oats (Avena sativa) to osmotic and cadmium stress: genome-wide analysis.BMC Plant Biol. 2025 Apr 25;25(1):538. doi: 10.1186/s12870-025-06559-x. BMC Plant Biol. 2025. PMID: 40281415 Free PMC article.
-
MYB transcription factors, their regulation and interactions with non-coding RNAs during drought stress in Brassica juncea.BMC Plant Biol. 2024 Oct 24;24(1):999. doi: 10.1186/s12870-024-05736-8. BMC Plant Biol. 2024. PMID: 39448923 Free PMC article.
-
Genome-Wide Identification and Expression Analysis of MYB Transcription Factor Family in Response to Various Abiotic Stresses in Coconut (Cocos nucifera L.).Int J Mol Sci. 2024 Sep 18;25(18):10048. doi: 10.3390/ijms251810048. Int J Mol Sci. 2024. PMID: 39337532 Free PMC article.
-
Transcription Factors Interact with ABA through Gene Expression and Signaling Pathways to Mitigate Drought and Salinity Stress.Biomolecules. 2021 Aug 5;11(8):1159. doi: 10.3390/biom11081159. Biomolecules. 2021. PMID: 34439825 Free PMC article. Review.
-
MYB transcription factors in plants: A comprehensive review of their discovery, structure, classification, functional diversity and regulatory mechanism.Int J Biol Macromol. 2024 Dec;282(Pt 2):136652. doi: 10.1016/j.ijbiomac.2024.136652. Epub 2024 Oct 18. Int J Biol Macromol. 2024. PMID: 39427786 Review.
Cited by
-
Glutathione S-transferase in mediating adaptive responses of oats (Avena sativa) to osmotic and cadmium stress: genome-wide analysis.BMC Plant Biol. 2025 Apr 25;25(1):538. doi: 10.1186/s12870-025-06559-x. BMC Plant Biol. 2025. PMID: 40281415 Free PMC article.
-
Genome-wide identification and integrative analysis of KNOX family characterization, duplication and expression provide insights into PEG-induced drought stress in Toona fargesii.BMC Genomics. 2025 Apr 29;26(1):423. doi: 10.1186/s12864-025-11628-4. BMC Genomics. 2025. PMID: 40301756 Free PMC article.
-
Genome-wide identification and characterization of the Brassinazole-resistant gene family and associated responses to osmotic stress in Avena sativa.Front Plant Sci. 2025 Aug 14;16:1616026. doi: 10.3389/fpls.2025.1616026. eCollection 2025. Front Plant Sci. 2025. PMID: 40894492 Free PMC article.
References
-
- Verma A, Deepti S. Abiotic stress and crop improvement: current scenario. Adv Plants Agric Res. 2016; 4(4):345–6.
-
- Irigoyen JJ, Einerich DW, Sánchez-Díaz M. Water stress induced changes in concentrations of proline and total soluble sugars in nodulated alfalfa (Medicago sativa) plants. Physiol Plant. 1992;84(1):55–60. doi: 10.1111/j.1399-3054.1992.tb08764.x. - DOI
MeSH terms
Substances
LinkOut - more resources
Full Text Sources
Research Materials
Miscellaneous
