. 2024 Jul 5;23(1):137.
doi: 10.1186/s12943-024-02049-0.

Tumor cell-intrinsic MELK enhanced CCL2-dependent immunosuppression to exacerbate hepatocarcinogenesis and confer resistance of HCC to radiotherapy

Affiliations

Tumor cell-intrinsic MELK enhanced CCL2-dependent immunosuppression to exacerbate hepatocarcinogenesis and confer resistance of HCC to radiotherapy

Bufu Tang et al. Mol Cancer. .

Abstract

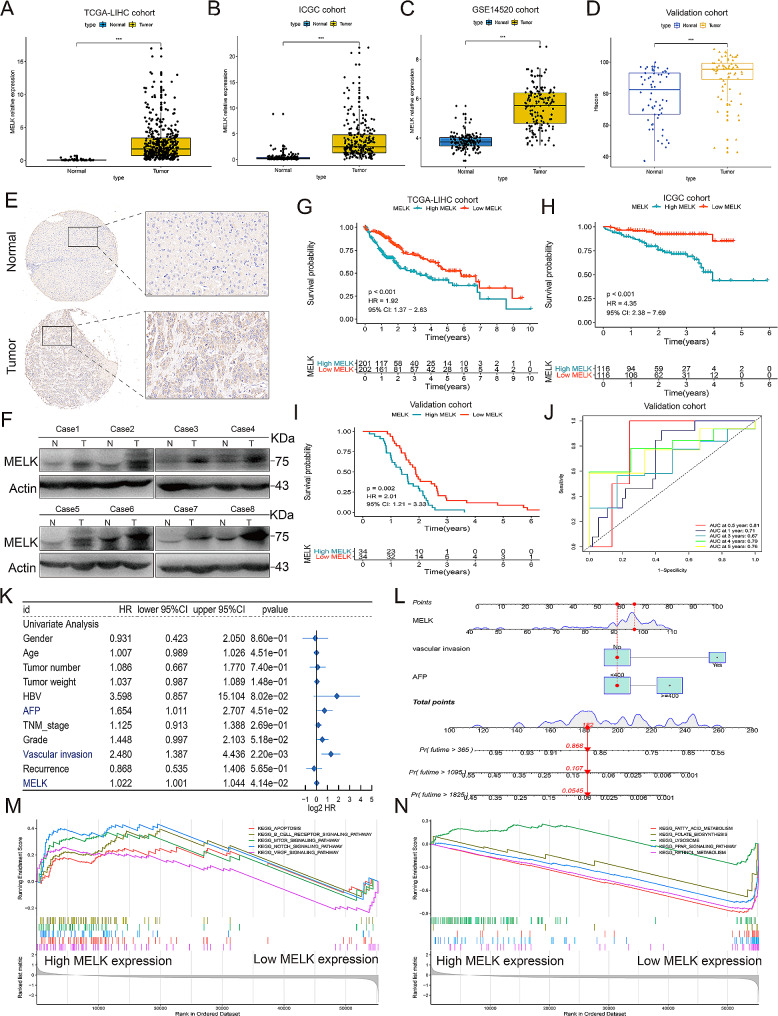
Background: The outcome of hepatocellular carcinoma (HCC) is limited by its complex molecular characteristics and changeable tumor microenvironment (TME). Here we focused on elucidating the functional consequences of Maternal embryonic leucine zipper kinase (MELK) in the tumorigenesis, progression and metastasis of HCC, and exploring the effect of MELK on immune cell regulation in the TME, meanwhile clarifying the corresponding signaling networks.

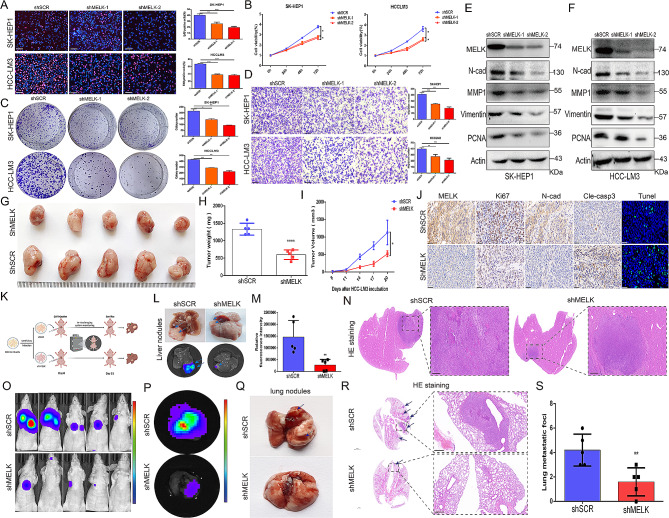
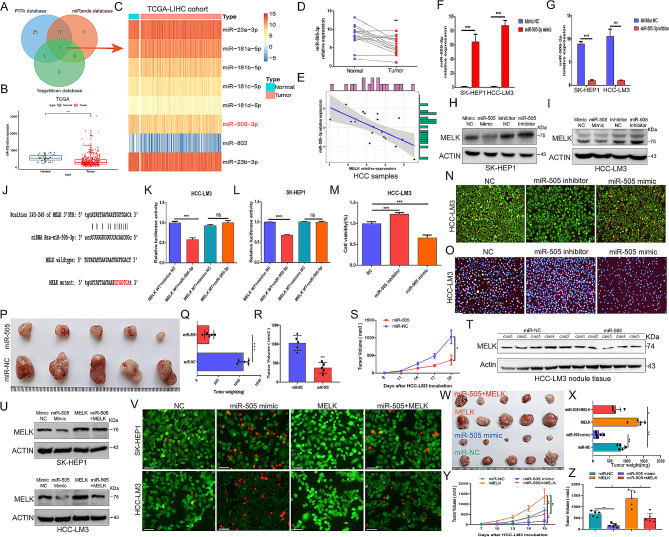
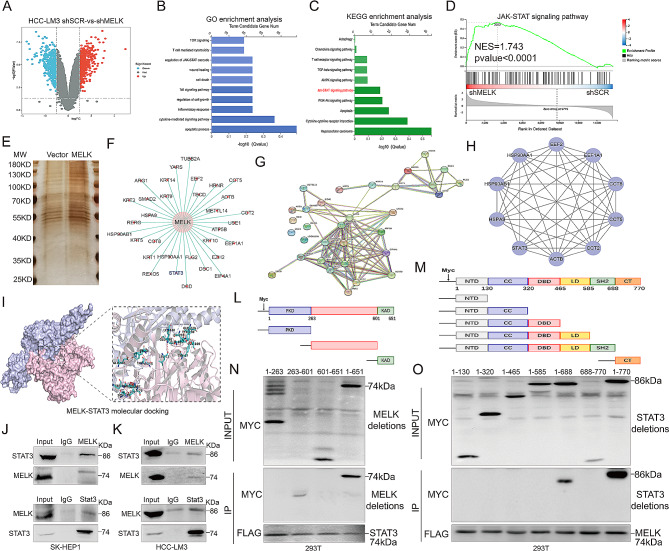
Methods: Bioinformatic analysis was used to validate the prognostic value of MELK for HCC. Murine xenograft assays and HCC lung metastasis mouse model confirmed the role of MELK in tumorigenesis and metastasis in HCC. Luciferase assays, RNA sequencing, immunopurification-mass spectrometry (IP-MS) and coimmunoprecipitation (CoIP) were applied to explore the upstream regulators, downstream essential molecules and corresponding mechanisms of MELK in HCC.

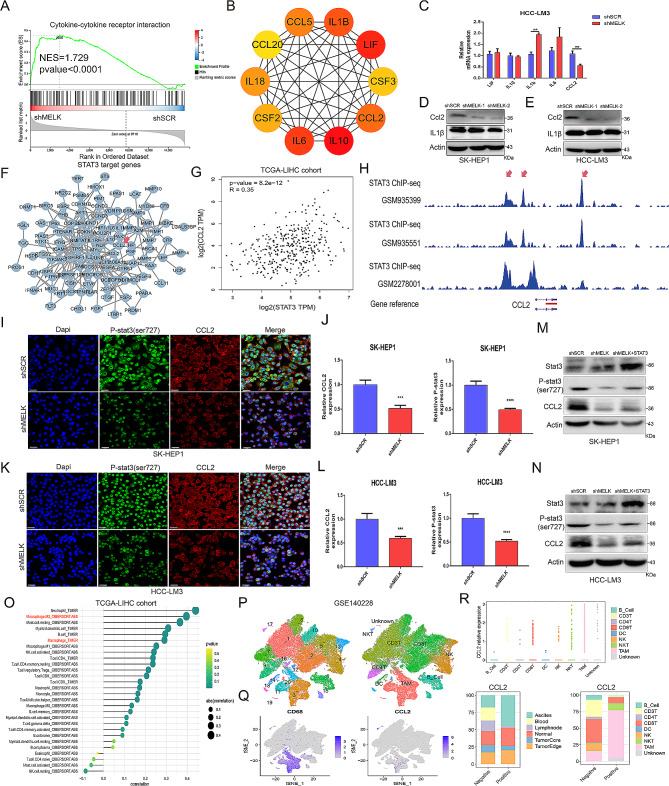
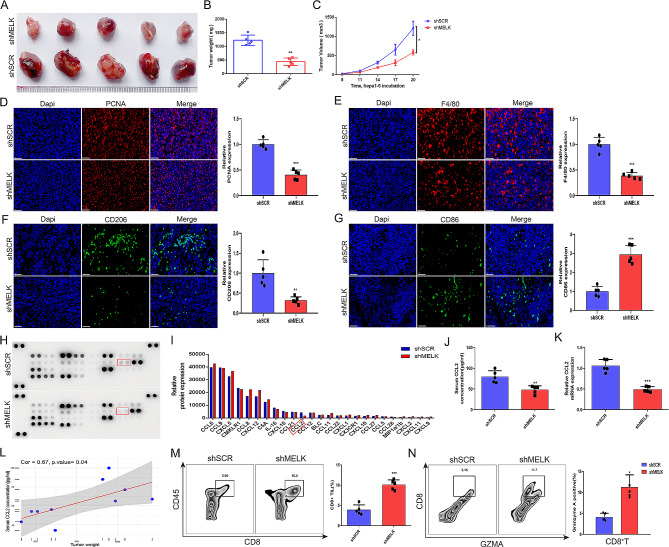
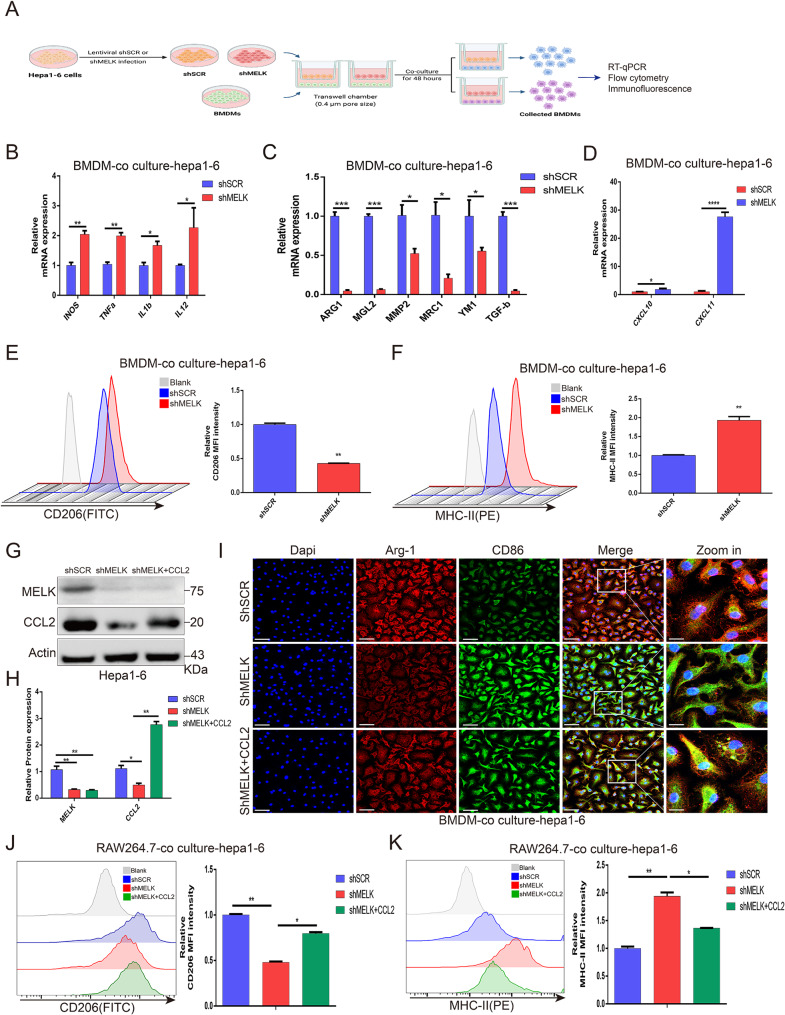
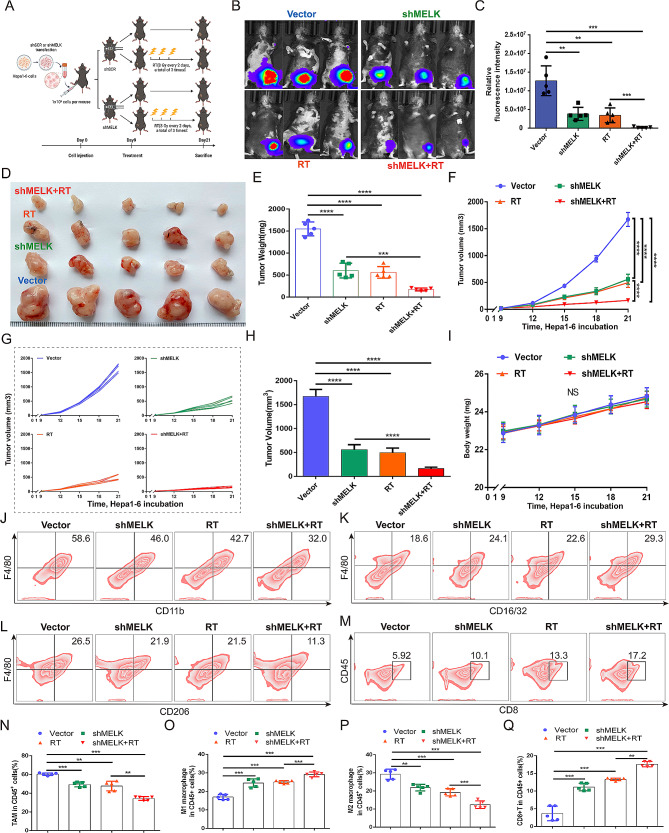
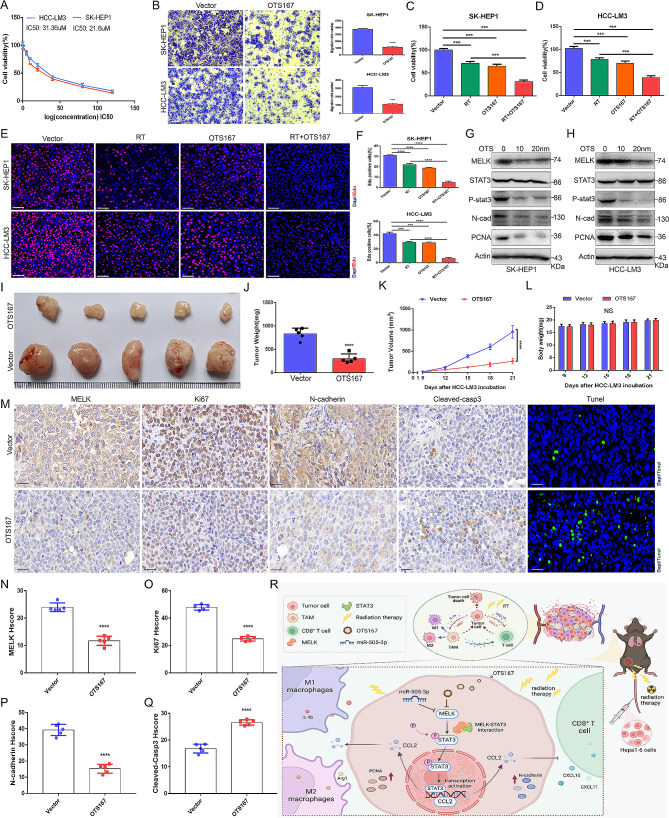
Results: We confirmed MELK to be a reliable prognostic factor of HCC and identified MELK as an effective candidate in facilitating the tumorigenesis, progression, and metastasis of HCC; the effects of MELK depended on the targeted regulation of the upstream factor miR-505-3p and interaction with STAT3, which induced STAT3 phosphorylation and increased the expression of its target gene CCL2 in HCC. In addition, we confirmed that tumor cell-intrinsic MELK inhibition is beneficial in stimulating M1 macrophage polarization, hindering M2 macrophage polarization and inducing CD8 + T-cell recruitment, which are dependent on the alteration of CCL2 expression. Importantly, MELK inhibition amplified RT-related immune effects, thereby synergizing with RT to exert substantial antitumor effects. OTS167, an inhibitor of MELK, was also proven to effectively impair the growth and progression of HCC and exert a superior antitumor effect in combination with radiotherapy (RT).

Conclusions: Altogether, our findings highlight the functional role of MELK as a promising target in molecular therapy and in the combination of RT therapy to improve antitumor effect for HCC.

Keywords: CCL2; Hepatocellular carcinoma (HCC); Radiotherapy (RT); STAT3; Tumor-associated macrophage (TAM); miR-505.


Conflict of interest statement

The authors declare no competing interests.

Figures

Fig. 1
Fig. 1
Upregulated MELK predicts a poor prognosis in HCC patients. (A-C) The expression difference between tumor tissues and corresponding normal tissues in the TCGA-LIHC cohort (A), ICGC cohort (B) and GSE14520 cohort (C). (D) An external validation cohort confirming the expression changes of MELK between HCC tissues and normal samples. (E-F) IHC staining (E) and Western blot (WB) assay (F) reflecting the expression characteristics of MELK in HCC tissues and normal samples. (G-I) Survival analysis showing the prognosis of HCC patients with high or low MELK expression in the TCGA-LIHC cohort (G), ICGC cohort (H) and validation cohort (I). (J) ROC curves confirming the prognostic predictive reliability of MELK expression in HCC patients in the validation cohort. (K) Identification of prognostic predictive factors of HCC. (L) The construction of a nomogram integrating the prognostic factors of HCC. (M) The signaling pathways are positively related to the high expression of MELK. (N) The signaling pathways negatively related to the high expression of MELK. *** p < 0.001, **** p < 0.0001
Fig. 2
Fig. 2
MELK contributes to the tumorigenesis, progression and spontaneous lung metastasis of HCC. (A) EdU assay confirming that MELK knockdown suppressed the proliferation of HCC cells. (B) CCK-8 assay showing the inhibition of MELK knockdown in the proliferation of SK-HEP1 and HCC-LM3 cells. (C) Colony formation assay showing the suppression of colony formation by MELK knockdown in HCC cells. (D) Transwell migration assay indicating that MELK knockdown impaired the migration of HCC cells. (E-F) WB assay showing the effect of MELK inhibition on the expression of proliferation- and migration-related factors. (G) Difference in the growth of HCC-LM3 tumors with or without MELK knockdown (n = 5/group). (H-I) Differences in tumor weight (H) and tumor volume (I) in HCC-LM3 tumors with or without MELK knockdown (n = 5/group). (J) IHC staining and TUNEL staining showing the effect of MELK inhibition on tumor proliferation, migration and apoptosis. (K) Construction scheme for the orthotopic implantation model of HCC-LM3 tumors in BALB/c nude mice. (L) General visualization and fluorescence imaging showing the difference in HCC-LM3 tumor growth with or without MELK knockdown. (M) The difference in the fluorescence intensity of HCC-LM3 tumors with or without MELK knockdown (n = 5/group). (N) HE staining reflecting pathological differences in tumor progression upon HCC-LM3 MELK knockdown. (O-P) In vivo bioluminescence imaging showing the inhibition of HCC-LM3 MELK in lung metastasis (n = 5/group). (Q) Macroscopic changes in lung metastasis upon HCC-LM3 MELK knockdown. (R) HE staining showing pathological changes in lung metastasis upon HCC-LM3 MELK knockdown. (S) Changes in intrapulmonary metastasis numbers upon HCC-LM3 MELK inhibition (n = 5/group). * p < 0.05, ** p < 0.01, *** p < 0.001, **** p < 0.0001
Fig. 3
Fig. 3
miR-505-3p serves as an upstream factor to target regulate the MELK-mediated tumorigenesis. (A) Prediction of potential upstream miRNAs regulating MELK using the PITA, miRanda and TargetScan databases. (B-C) Expression characteristics of the candidate miRNAs in the TCGA-LIHC cohort. (D) Differences in miR-505-3p expression in tumor tissues and corresponding samples in the validation cohort. (E) miR-505-3p expression showed a negative correlation with MELK expression in HCC samples. (F-G) Changes in the expression of miR-505-3p in HCC cells under miR-505-3p mimic (F) or miR-505-3p inhibitor transfection (G). (H-I) WB assay showing the effect of miR-505-3p changes on MELK expression in SK-HEP1 (H) and HCC-LM3 (I) cells. (J) Mutation strategy of predicted miRNA-targeting sites of miR-505-3p on the 3’-UTR of MELK. (K-L) Dual-luciferase reporter analysis confirming the miRNA-targeting sites of miR-505-3p on the 3’-UTR of MELK. (M) Effect of miR-505-3p expression on the viability of HCC-LM3 cells. (N) Live/dead cell assays showing the role of miR-505-3p in HCC-LM3 cell viability. (O) EdU assay showing the proliferation capability of HCC-LM3 upon miR-505-3p expression change. (P) Effect of miR-505-3p on the growth of HCC-LM3 tumors. (Q-S) Differences in tumor weight (Q) and tumor volume (R-S) in HCC-LM3 tumors in response to miR-NC and miR-505-3p treatment. (T) WB reflecting the change of MELK expression in response to miR-505-3p treatment. (U) WB showing the expression characteristic of MELK in response to the indicated treatments. (V) Live/dead cell assays indicating the inhibition effect of miR-505 on cell viability is reversed by MELK overexpression. (W) Suppression effect of miR-505-3p on the growth of HCC-LM3 tumors is diminished by forced expression of MELK (n = 5/group). (X-Z) Differences in tumor weight (X) and tumor volume (Y-Z) in HCC-LM3 tumors in response to the indicated treatment (n = 5/group). ns, no significance, * p < 0.05, ** p < 0.01, *** p < 0.001, **** p < 0.0001
Fig. 4
Fig. 4
MELK interacts with STAT3 directly in HCC. (A) Volcano plot depicting the differentially expressed genes (DEGs) between MELK knockdown HCC-LM3 cells and the corresponding control HCC-LM3 cells. (B) GO enrichment analysis of the DEGs. (C) KEGG enrichment analysis of the DEGs. (D) GSEA revealing the close correlation between MELK expression and JAK-STAT signaling pathway activation. (E) Separation and visualization of the MELK-containing protein complex in 293T cells using SDS–PAGE and silver staining. (F) Mass spectrometry showing the proteins interacting with MELK in 293T cells. (G) PPI analysis for the 32 MELK-interacting proteins. (H) The hub 10 MELK-interacting proteins identified by PPI. (I) Molecular docking depicting the potential interaction sites of STAT3 and MELK. (J-K) Coimmunoprecipitation (CoIP) detecting the interaction between MELK and STAT3 in SK-HEP1 (J) and HCC-LM3 (K) cells. (L) Strategies to define different MELK fragments. (M) Strategies to define different STAT3 fragments. (N) Mapping the MELK fragment that interacts with STAT3. (O) Mapping the STAT3 fragment that interacts with MELK.
Fig. 5
Fig. 5
MELK activates STAT3 phosphorylation and increases the expression of its target gene CCL2 in HCC. (A) GSEA showing the close relationship between cytokine‒cytokine receptor interaction signal pathway activity and MELK expression in HCC-LM3 cells. (B) Protein‒protein interaction (PPI) analysis identifying 10 hub genes in the cytokine‒cytokine receptor interaction pathway closely related to MELK. (C) qRT‒PCR analysis detecting the effect of MELK on the expression of the identified hub genes in HCC-LM3 cells. (D-E) WB analysis showing the effect of MELK on the expression of CCL2 and IL-1β in SK-HEP1 (D) and HCC-LM3 cells (E). (F) STAT3 target genes predicted by the Gene Transcription Regulation Database (GTRD). (G) Correlation between the expression of STAT3 and CCL2 in the TCGA-LIHC cohort. (H) ChIP-seq assays showing the colocalization regions of STAT3 and CCL2. (I-L) IF staining reflecting the effect of MELK knockdown on the expression of phospho-STAT3 and CCL2 in SK-HEP1 (I-J) and HCC-LM3 cells (K-L). (M-N) WB analysis confirming that STAT3 overexpression reverses the MELK-mediated suppression of CCL2 expression in SK-HEP1 (M) and HCC-LM3 cells (N). (O) The correlation between CCL2 expression and immune cell infiltration in the TCGA-LIHC cohort. (P) The immune cellular landscape of HCC in the GSE140228 cohort. (Q) The expression profiles of CCL2 in different immune cells. (R) The correlation between CCL2 expression and the infiltration level of immune cells in tumors. ** p < 0.01, *** p < 0.001, **** p < 0.0001
Fig. 6
Fig. 6
Tumor cell-intrinsic MELK inhibition affects the infiltration and polarization of TAMs. (A) The effect of MELK knockdown on tumor growth in mouse xenograft models (n = 5/group). (B-C) The effect of MELK inhibition on tumor weight (B) and tumor volume (C) (n = 5/group). (D-G) IF staining reflecting the expression changes of PCNA (D), F4/80 (E), CD206 (F) and CD86 (G) upon MELK inhibition in tumor tissues. (H-I) Antibody filter array implying the effects of MELK expression on cytokines related to immune cell recruitment. (J) ELISA showing the effect of tumoral MELK inhibition on serum CCL2 concentration. (K) qRT‒PCR analysis detecting the expression change of CCL2 upon MELK inhibition. (L) The correlation between tumor weight and serum CCL2 concentration. (M) FCM analysis showing the role of MELK expression in CD8 + T-cell recruitment to tumor tissue. (N) FCM analysis showing the effect of MELK expression on the GZMA-positive cell proportion in recruited CD8 + T cells in tumor tissue. * p < 0.05, ** p < 0.01, *** p < 0.001
Fig. 7
Fig. 7
CCL2 is required for tumoral MELK-mediated TAM polarization in HCC. (A) Schematic illustration of the coculture system construction (drawn by https://biorender.com/). (B-C) qRT‒PCR revealing the expression changes in M1- and M2-related markers in BMDMs upon coculture Hepa 1–6 MELK inhibition. (D) qRT‒PCR showing the expression of CXCL10 and CXCL11 in BMDMs cocultured with MELK knockdown Hepa1-6 cells. (E-F) FCM analysis showing the expression changes of CD206 (E) and MHC-II (F) in BMDMs cocultured with MELK knockdown Hepa1-6 cells. (G-H) WB analysis confirming the expression changes in MELK and CCL2 in Hepa1-6 cells under different treatments. (I) IF staining reflecting the expression changes in ARG-1 and CD86 in BMDMs after coculturing with Hepa1-6 cells with different treatments. (J-K) FCM analysis detecting the expression characteristics of CD206 (J) and MHC-II (K) in RAW264.7 cells cocultured with Hepa1-6 cells under different treatments. * p < 0.05, ** p < 0.01, *** p < 0.001, **** p < 0.0001
Fig. 8
Fig. 8
The combination of MELK knockdown and RT treatment achieves the optimal antitumoral effect compared to the single treatment. (A) Treatment scheme for Hepa1-6 tumor-bearing mouse models. (B-C) In vivo bioluminescence imaging showing subcutaneous Hepa1-6 tumors in mouse models. (D) Differences in tumor growth in response to different treatments (n = 5/group). (E) Differences in tumor weight in response to different treatments (n = 5/group). (F-H) Differences in tumor volume in response to different treatments (n = 5/group). (I) Body weight of mouse models in response to different treatments (n = 5/group). (J-Q) Differences in the infiltration level of TAMs (J, N), M1 phenotype (K, O), M2 phenotype (L, P) and CD8 + T cells (M, Q) in tumors in response to different treatments (n = 5/group). ** p < 0.01, *** p < 0.001, **** p < 0.0001
Fig. 9
Fig. 9
The combination of pharmacological inhibition of MELK and RT substantially restrains tumorigenesis and progression of HCC. (A) Confirmation of the half maximal inhibitory concentration (IC50) of OTS167 in HCC cells. (B) Transwell migration assays showing the effect of OT167 on the migration of HCC cells. (C) CCK-8 assays detecting the cell viability of SK-HEP1 (C) and HCC-LM3 cells (D) in response to different treatments. (E-F) EdU assays depicting the proliferation of HCC cells in response to different treatments. (G-H) WB analysis showing the expression of tumorigenesis- and progression-related factors in SK-HEP1 (G) and HC-LM3 cells (H) in response to different treatments. (I-K) The effect of OTS167 on Hepa1-6 tumor growth (I), tumor weight (J) and tumor volume (K) in mouse models (n = 5/group). (L) The effect of OTS167 on the body weight of mouse models (n = 5/group). (M-Q) IHC staining and TUNEL staining showing the expression of MELK, Ki67, N-cadherin, cleaved casp3 and apoptotic cells in tumor tissues under OTS167 treatment (n = 5/group). (R) Schematic diagram displaying the overall process and mechanism of this study (drawn by https://biorender.com/). ns, no significance, * p < 0.05, *** p < 0.001, **** p < 0.0001

Similar articles

Cited by

References

    1. Sung H, Ferlay J, Siegel RL, Laversanne M, Soerjomataram I, Jemal A, Bray F. Global Cancer statistics 2020: GLOBOCAN estimates of incidence and Mortality Worldwide for 36 cancers in 185 countries. Cancer J Clin. 2021;71(3):209–49. doi: 10.3322/caac.21660. - DOI - PubMed
    1. Llovet JM, Montal R, Sia D, Finn RS. Molecular therapies and precision medicine for hepatocellular carcinoma, Nature reviews. Clin Oncol. 2018;15(10):599–616. - PubMed
    1. de Lope CR, Tremosini S, Forner A, Reig M, Bruix J. Management of HCC. J Hepatol. 2012;56(1):S75–87. doi: 10.1016/S0168-8278(12)60009-9. - DOI - PubMed
    1. Marquardt JU, Galle PR, Teufel A. Molecular diagnosis and therapy of hepatocellular carcinoma (HCC): an emerging field for advanced technologies. J Hepatol. 2012;56(1):267–75. doi: 10.1016/j.jhep.2011.07.007. - DOI - PubMed
    1. Kong D, Liu C, Miao X, Wang Y, Ding X, Gong W. Current statuses of molecular targeted and immune checkpoint therapies in hepatocellular carcinoma. Am J cancer Res. 2020;10(5):1522–33. - PMC - PubMed

MeSH terms