. 2024 Jul 5;22(1):399.
doi: 10.1186/s12951-024-02594-2.

Neuroimmune modulating and energy supporting nanozyme-mimic scaffold synergistically promotes axon regeneration after spinal cord injury

Affiliations

Neuroimmune modulating and energy supporting nanozyme-mimic scaffold synergistically promotes axon regeneration after spinal cord injury

Genjiang Zheng et al. J Nanobiotechnology. .

Abstract

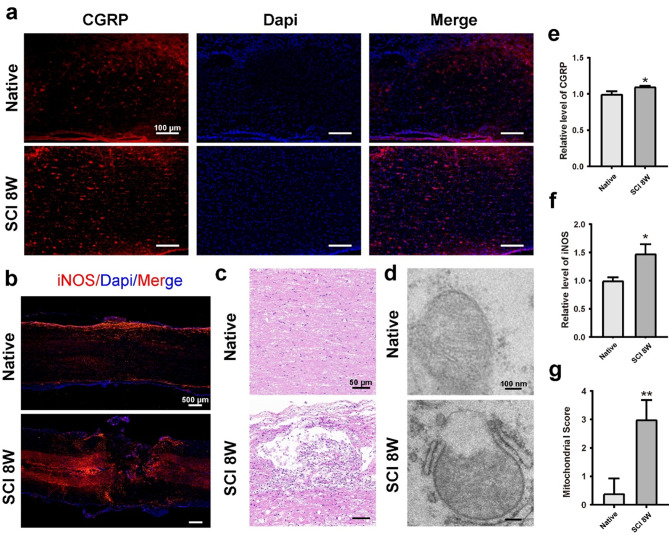
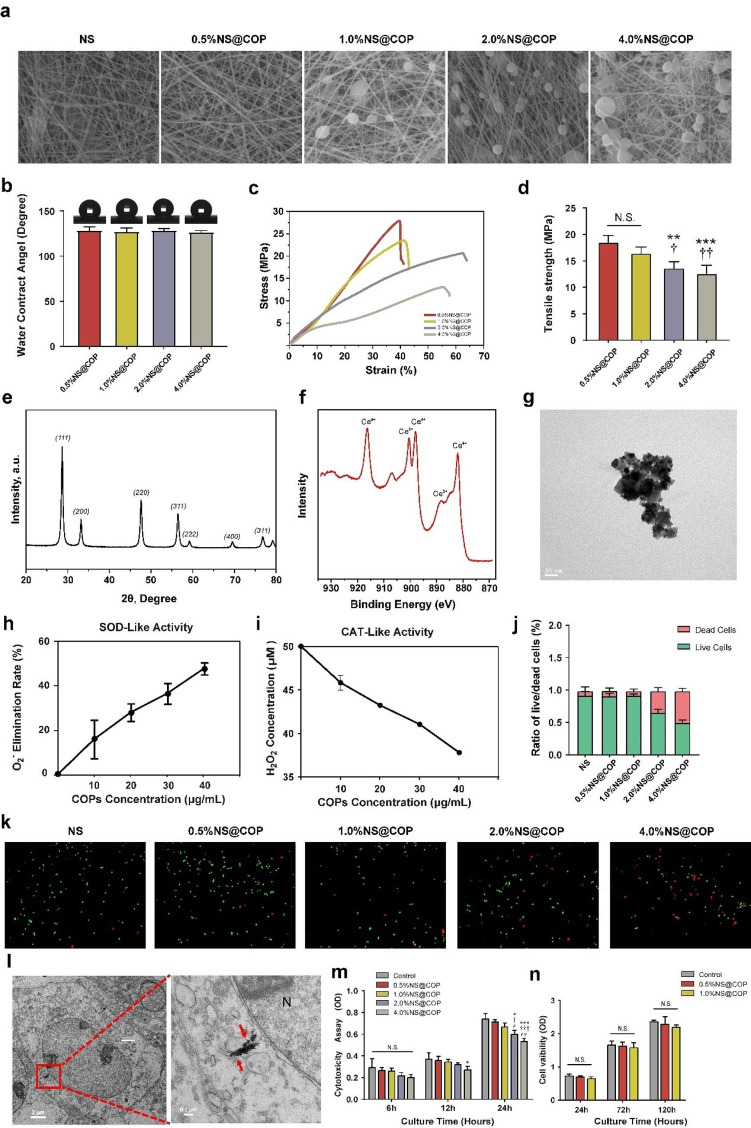
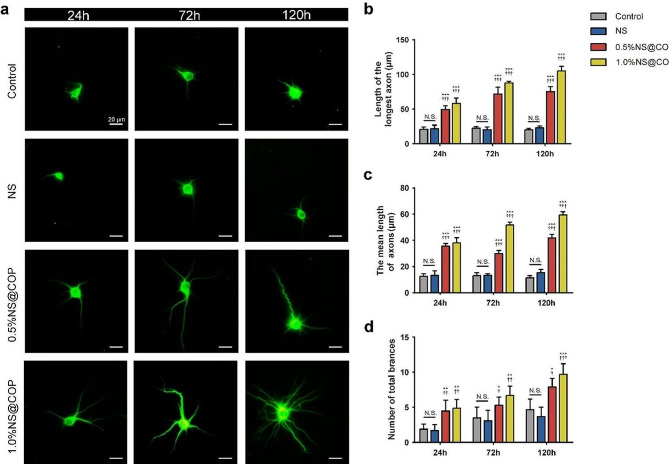
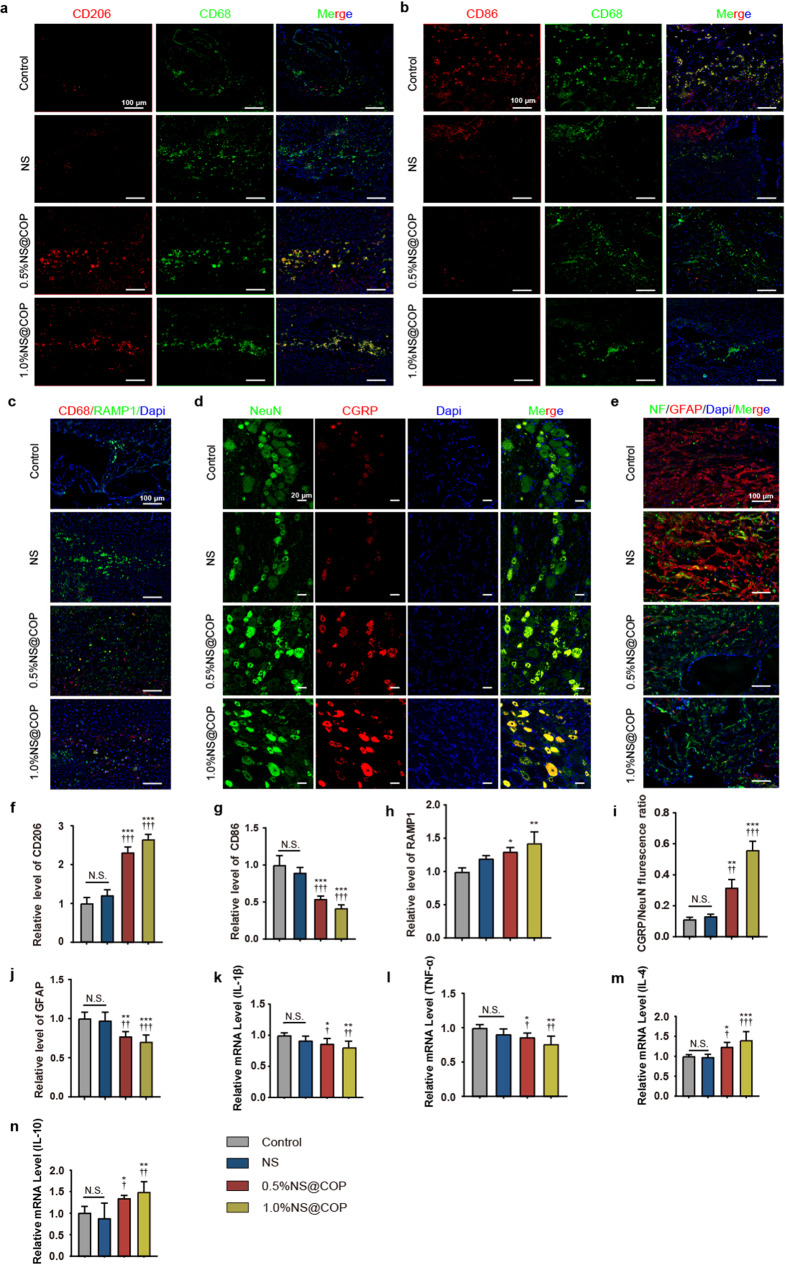
Spinal cord injury (SCI) represents a profound central nervous system affliction, resulting in irreversibly compromised daily activities and disabilities. SCI involves excessive inflammatory responses, which are characterized by the existence of high levels of proinflammatory M1 macrophages, and neuronal mitochondrial energy deficit, exacerbating secondary damage and impeding axon regeneration. This study delves into the mechanistic intricacies of SCI, offering insights from the perspectives of neuroimmune regulation and mitochondrial function, leading to a pro-fibrotic macrophage phenotype and energy-supplying deficit. To address these challenges, we developed a smart scaffold incorporating enzyme mimicry nanoparticle-ceriumoxide (COPs) into nanofibers (NS@COP), which aims to pioneer a targeted neuroimmune repair strategy, rescuing CGRP receptor on macrophage and concurrently remodeling mitochondrial function. Our findings indicate that the integrated COPs restore the responsiveness of pro-inflammatory macrophages to calcitonin gene-related peptide (CGRP) signal by up-regulating receptor activity modifying protein 1 (RAMP1), a vital component of the CGRP receptor. This promotes macrophage fate commitment to an anti-inflammatory pro-resolution M2 phenotype, then alleviating glial scar formation. In addition, NS@COP implantation also protected neuronal mitochondrial function. Collectively, our results suggest that the strategy of integrating nanozyme COP nanoparticles into a nanofiber scaffold provides a promising therapeutic candidate for spinal cord trauma via rational regulation of neuroimmune communication and mitochondrial function.

Keywords: Axonal regeneration; Calcitonin gene-related peptide; Cerium oxide nanoparticles; Mitochondria; Polarization of macrophages; Reactive oxygen species.


Conflict of interest statement

The authors have declared that no conflicts of interest exist.

Figures

Scheme 1
Scheme 1
Schematic illustration of the therapeutic nano-enzyme NS@COP scaffold for axon regeneration after spinal cord injury
Fig. 1
Fig. 1
Increased neuropeptide CGRP release, excessive oxidative stress, and mitochondrial structural damage in spinal cord tissue at 8 weeks after injury. a) Representative image of immunofluorescence staining of CGRP in native spinal cord and spinal cord at 8 weeks postinjury (n = 3). Scale Bar = 100 μm. b) Representative image of H&E staining of native spinal cord and spinal cord at 8 weeks postinjury (n = 3). Scale Bar = 500 μm. c) Representive images of anti-iNOS positive cells in native and injured spinal cord at 8 weeks postinjury (n = 3). Scale Bar = 50 μm. d) Representive images of mitochondrial structure in native spinal cord and spinal cord at 8 weeks postinjury (n = 3). Scale Bar = 100 μm. e-f) Quantitative analysis of the relative levels of CGRP and iNOS in native and injured spinal cord at 8 weeks post-injury. g) Semiquantitative scoring of mitochondrial structure of native and injured spinal cord at 8 weeks post-injury. Data are presented as mean ± SD. (*) denotes p < 0.05, (**) denotes p < 0.01, (***) denotes p < 0.001, vs. native group
Fig. 2
Fig. 2
Fabrication, characterization, and cytocompatibility of PCL nanoscaffold with COPs nanozymes. a) SEM images of NS and NS@COP scaffolds with different proportions of COP nanoparticles. Scale Bar = 2 μm. b) Hydrophilicity of PCL, 0.5%NS@COP, 1.0%NS@COP, 2.0%NS@COP and 4.0%NS@COP (n = 5). c, d) Strain–stress curve and tensile strength of PCL, 0.5%NS@COP, 1.0%NS@COP, 2.0%NS@COP, and 4.0%NS@COP (n = 5). e, f, and g) XRD, XPS, and TEM analysis of COP nanoparticles (n = 5). h, i) SOD and CAT mimic activity of COPs (n = 3). j) Quantifications of Live/Dead cell staining. k) Live/Dead cell staining of PC12 cells co-cultured with scaffolds. Scale Bar = 200 μm. l) COPs internalization to cells, visualized by TEM. Red arrows indicate COPs (N: nucleus). Scale Bar = 2 μm. m) Cytocompatibility assay examined at 6, 12, 24 h. o) Cell viability examined at 24, 72, and 120 h. Data are presented as mean ± SD. (*) denotes p < 0.05, (**) denotes p < 0.01, (***) denotes p < 0.001, vs. NS group: (†) denotes p < 0.05, (††) denotes p < 0.01, (†††) denotes p < 0.001, vs. 0.5%NS@COP group: (#) denotes p < 0.05, vs. 1.0%NS@COP group
Fig. 3
Fig. 3
Regulation of macrophage anti-inflammatory activity by the NS@COP scaffold. a-b) CGRP secretion was detected by ELISA. c-d) Quantitative analysis of the relative levels of iNOS and ARG1 in control, NS, 0.5%NS@COP, and 1.0%NS@COP group. e-f) Representative images of immunofluorescence staining of iNOS and ARG1 in RAW264.7 cells stimulated by H2O2 (100 µM) and treated with CGRP (10 nM). Scale Bar = 100 μm. (g) Western blot analysis of RAMP1, p-AKT, AKT, and β-actin expression in RAW264.7 cells with different treatments. (n = 3). (h–j) The results of western blot analysis are expressed as percentages of positive mean ± SD. (n = 3). k) Schematic representation of the RAW264.7 macrophage with different treatments. (l-n) Release of IL-1β, TNF-α, and IL-10 protein was tested by ELISA after the indicated periods. (*) denotes p < 0.05, (**) denotes p < 0.01, (***) denotes p < 0.001, vs. control group: (†) denotes p < 0.05, (††) denotes p < 0.01, (†††) denotes p < 0.001, vs. NS group
Fig. 4
Fig. 4
NS@COP restored mitochondrial membrane potential and ultra structure of cells in vitro. a, c, and d) Representative images of immunofluorescence staining of mitochondrial membrane potential (ΔΨm) detected by JC-1 probe and Mitotracker indicator, respectively. b) Representative TEM images of mitochondrial ultrastructure of cells stimulated by H2O2 (100 µM) and treated with different NS@COP for 24 h (n = 3). Scale Bar = 200 nm. g, h) Quantitative analysis of the relative fluorescent level of (a) and (c) (n = 3). f) Semiquantitative scoring of mitochondrial structure of control, NS, 0.5%NS@COP, and 1.0%NS@COP group, respectively (n = 3). Data are presented as mean ± SD. (*) denotes p < 0.05, (**) denotes p < 0.01, (***) denotes p < 0.001, vs. control group: (†) denotes p < 0.05, (††) denotes p < 0.01, (†††) denotes p < 0.001, vs. NS group
Fig. 5
Fig. 5
The NS@COP scaffold promotes axon outgrowth of H2O2-modeled cortical neurons in vitro. a) Representative images of immunofluorescence staining of MAP2 of cortical neurons co-cultured with different NS@COP scaffolds for 24 h, 72 h, and 120 h, respectively (n = 3). Scale Bar = 20 μm. b-d) Quantitative analysis of length of the longest axon, the mean length of the axons, and the number of total branches for 24 h, 72 h, and 120 h, respectively (n = 3). Data are presented as mean ± SD. (*) denotes p < 0.05, (**) denotes p < 0.01, (***) denotes p < 0.001, vs. control group: (†) denotes p < 0.05, (††) denotes p < 0.01, (†††) denotes p < 0.001, vs. NS group
Fig. 6
Fig. 6
Motor function recovery in spinal cord injury rats after implantation of NS@COPs. a) The experimental timeline schematics. b) Images of implanting scaffolds during SCI operation (Black arrow ahead) points to the surgical sites. c) Function recovery of rats on week 8 post-surgery evaluated by BBB scores. d) Representative footprints of the rats in the control, NS, 0.5%NS@COP, and 1.0%NS@COP groups. The fore-and hind limbs of the rats were inked red and blue, respectively. e) Typical hindlimbs-spreading status of SCI rats on week 8 post-surgery. f) Representative images of macrography of spinal cord operative segments at 8 weeks post-surgery. g) Histological examination on the longitudinal sections of the spinal cords collected on week 8 post-surgery. n = 3. Scale Bar = 0.5 mm
Fig. 7
Fig. 7
Implantation of the NS@COP scaffold enhances sensory neuropeptide production, promoting the transition of M1 to M2 macrophages and reducing inflammation in rats with spinal cord injury. a-b) Representative images of immunofluorescence staining of CD86 and CD206 of spinal cord tissue in control, NS, 0.5%NS@COP and 1.0%NS@COP groups at 8 weeks postsurgery (n = 5). Scale Bar = 100 μm. c) Representative images of immunofluorescence staining of RAMP1 of spinal cord tissue in control, NS, 0.5%NS@COP, and 1.0%NS@COP groups at 8 weeks post surgery (n = 5). Scale Bar = 100 μm. d) Representative double-immunofluorescence images of DRG neurons, in which neurogenic peptide and stimulation are characterized by the presence of CGRP, and the neurons are indicated by NeuN (n = 5). Scale Bar = 20 μm. e) Representative images of immunofluorescence staining of the injured spinal cord segments. Spinal cord lesion sites were visualized using NF200 and GFAP staining (n = 5). Scale Bar = 100 μm. f) Semiquantitative analysis of the relative fluorescent intensity of (c). g-i) Semiquantitative analysis of the relative fluorescent intensity of (a), (b), and (e). Data represented as mean ± SD. j-m) Levels of mRNA for IL-1β, TNF-α, IL-4 and IL-10 (n = 5). (*) denotes p < 0.05, (**) denotes p < 0.01, (***) denotes p < 0.001, vs. control group: (†) denotes p < 0.05, (††) denotes p < 0.01, (†††) denotes p < 0.001, vs. NS group
Fig. 8
Fig. 8
NS@COP alleviated the oxidative damage and restored mitochondrial ultrastructure at predetermined time post-spinal cord injury. a-b) Representative images of immunofluorescence staining of iNOS of spinal cord surgery segments from different groups at 4 and 8 weeks postinjury. Scale Bar = 500 μm. The magnified images on the right are from the box area of the image on the left (n = 3). c-d) Quantitative analysis of the relative fluorescent intensity of (a) and (b) (n = 3). e) Representative TEM images of mitochondrial ultrastructure of axons at 4 weeks postoperatively. Scale Bar = 0.5 μm. f) Representative TEM images of mitochondrial ultrastructure of axons at 8 weeks postoperatively. Scale Bar = 0.5 μm. g-h) Semiquantitative scoring of mitochondrial structure of 4 and 8 weeks postoperatively (n = 5). Data are presented as mean ± SD. (*) denotes p < 0.05, (**) denotes p < 0.01, (***) denotes p < 0.001, vs. control group: (†) denotes p < 0.05, (††) denotes p < 0.01, (†††) denotes p < 0.001, vs. NS group
Fig. 9
Fig. 9
NS@COP prevents cavity formation and enhances neuronal axon regeneration and synaptogenesis. a) Representative images of immunofluorescence staining of the full views of the injured spinal cord segments. Spinal cord lesion sites were visualized using NF200 and GFAP staining (n = 5). Scale Bar = 500 μm. b) Representative images of immunofluorescence staining of spinal cord adjacent to the lesion and in the lesion sites (n = 5). Scale Bar = 100 μm. c-d) Quantitative analysis of the relative fluorescent intensity of NF200 and NF200/GFAP ratio in the lesion sites. e) Size of lesion cavity measured from (a). f) Quantitative analysis of the relative fluorescent intensity of SYP in the lesion sites. g) Representative images of immunofluorescence staining of NF200 and SYP of spinal cord tissue in control, NS, 0.5%NS@COP, and 1.0%NS@COP groups at 8 weeks post surgery (n = 5). Scale Bar = 500 μm. h) Ultrastructural images of the transverse sections at the lesion site of the SCI at different groups(n = 5).Scare Bar = 0.5 μm. i) Representative images of electron microscopy images of the cross sections at the lesion site of the SCI at different groups(n = 5).Scare Bar = 200 nm. j) Quantitative analysis of the number of axons from TEM images. k) Quantitative analysis of the area-based G-ratio from TEM images. Data are presented as mean ± SD. (*) denotes p < 0.05, (**) denotes p < 0.01, (***) denotes p < 0.001, vs. control group: (†) denotes p < 0.05, (††) denotes p < 0.01, (†††) denotes p < 0.001, vs. NS group

Similar articles

Cited by

References

    1. Global regional. National burden of traumatic brain injury and spinal cord injury, 1990–2016: a systematic analysis for the global burden of Disease Study 2016. Lancet Neurol. 2019;18(1):56–87. doi: 10.1016/S1474-4422(18)30415-0. - DOI - PMC - PubMed
    1. Karimi-Abdolrezaee S, Billakanti R. Reactive astrogliosis after spinal cord injury-beneficial and detrimental effects. Mol Neurobiol. 2012;46(2):251–64. doi: 10.1007/s12035-012-8287-4. - DOI - PubMed
    1. Hara M, Kobayakawa K, Ohkawa Y, Kumamaru H, Yokota K, Saito T, et al. Interaction of reactive astrocytes with type I collagen induces astrocytic scar formation through the integrin-N-cadherin pathway after spinal cord injury. Nat Med. 2017;23(7):818–28. doi: 10.1038/nm.4354. - DOI - PubMed
    1. Sofroniew MV. Dissecting spinal cord regeneration. Nature. 2018;557(7705):343–50. doi: 10.1038/s41586-018-0068-4. - DOI - PubMed
    1. Cookson MR, Shaw PJ. Oxidative stress and motor neurone disease. Brain Pathol. 1999;9(1):165–86. doi: 10.1111/j.1750-3639.1999.tb00217.x. - DOI - PMC - PubMed

Substances